Designing Wells to Optimize Performance and Efficiency - ICWT
Designing Wells to Optimize Performance and Efficiency - ICWT
Designing Wells to Optimize Performance and Efficiency - ICWT

You also want an ePaper? Increase the reach of your titles
YUMPU automatically turns print PDFs into web optimized ePapers that Google loves.
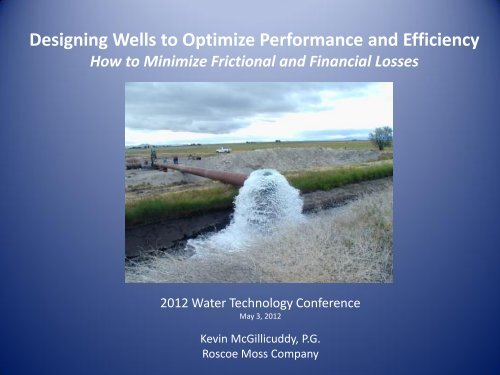
<strong>Designing</strong> <strong>Wells</strong> <strong>to</strong> <strong>Optimize</strong> <strong>Performance</strong> <strong>and</strong> <strong>Efficiency</strong><br />
How <strong>to</strong> Minimize Frictional <strong>and</strong> Financial Losses<br />
Well <strong>Efficiency</strong><br />
Optimizing Production <strong>and</strong> Cost<br />
2012 Water Technology Conference<br />
May 3, 2012<br />
Kevin McGillicuddy, P.G.<br />
Roscoe Moss Company
Efficient Well Design <strong>and</strong> Operation:<br />
Topics<br />
• Fac<strong>to</strong>rs contributing <strong>to</strong> pumping drawdown<br />
• Steps taken <strong>to</strong> reduce losses<br />
• Calculation of Well <strong>Efficiency</strong><br />
• Cost Implications
Pumping Well Terminology<br />
Cone Of Depression<br />
Discharge Rate<br />
Static (non pumping) Level<br />
Pumping Level<br />
Drawdown in Well<br />
Aquifer Loss<br />
Well Loss<br />
AQUIFER<br />
3
Well <strong>Efficiency</strong><br />
Defined as : drawdown in the aquifer<br />
<strong>to</strong>tal drawdown in the well<br />
4
Critical Components in <strong>Designing</strong><br />
Efficient Gravel Envelope <strong>Wells</strong><br />
• Underst<strong>and</strong>ing fac<strong>to</strong>rs contributing <strong>to</strong> pumping<br />
drawdown<br />
– Aquifer losses<br />
– Well losses<br />
• Selection of Appropriate Gravel Pack<br />
• Selection of Screen Slot Size<br />
• Application of Rigorous <strong>and</strong> Thorough Well Development<br />
Techniques
Collect Representative Borehole Samples
Select Samples for Sieve Tests
Determine Gradation<br />
of Aquifer Sediments
Wt. % Finer<br />
(passing)<br />
20-48<br />
50-60<br />
68-86<br />
Sump<br />
0<br />
1/4 x 10<br />
4 x 16<br />
4x20<br />
4x16.2<br />
Sieve Analysis<br />
U.S. Sieve Sizes<br />
20 16 14 12 8 6<br />
100<br />
90<br />
80<br />
70<br />
60<br />
50<br />
10<br />
6 - 9 x multiplier<br />
Slot size 0.070"<br />
40<br />
30<br />
20<br />
10<br />
0<br />
0.0010 0.0100 0.1000 1.0000<br />
Grain Size (inches )
Slot Size Selection<br />
• Sized <strong>to</strong> pass 10 <strong>to</strong> 20% gravel pack<br />
• Slot size more critical than % open area<br />
• Open area of 3 – 5% = 90+ % efficient<br />
• Entrance velocity of 2 – 4 fps = 90+% efficient<br />
(1)<br />
(1)<br />
(1) Modern Techniques in Well Design, Journal AWWA Williams, D.E.,Ph.D, 1985
<strong>Efficiency</strong> Case Study – Big Pine, CA<br />
Well #374 Well #375<br />
1000 ft<br />
Depth : 450’ 450’<br />
Diameter : 18” 18”<br />
Perforations : 260 - 440’ 260 - 440’<br />
Slot Size: 0.080” 0.080”<br />
Screen Type : wire-wrap louvered<br />
% open area: 27% 5 %
<strong>Efficiency</strong> Results<br />
Well #374 Well #375<br />
27% open area 5 % open area<br />
Step Q E Q E<br />
(gpm) (%) (gpm) (%)<br />
1 873 91.1 883 93.9<br />
2 1803 83.3 1855 88<br />
3 2078 81.3 2034 87<br />
4 2617 77.5 2607 83.9
Properly Designed Gravel Envelope &<br />
Screen Slot Size<br />
Well Screen Filter Pack Aquifer
Well Development<br />
Any process used <strong>to</strong> improve permeability of an aquifer <strong>and</strong><br />
repair drilling damage.<br />
Accomplished by removing fines through the gravel pack <strong>and</strong> well<br />
screen.<br />
Must be aggressive <strong>and</strong> directed.
Damage Zone<br />
Repair Drilling Damage
Phases of Well Development<br />
Pre-development : Controlling drilling fluids during drilling<br />
<strong>and</strong> construction<br />
Preliminary development : swabbing, jetting, flushing,<br />
airlifting, <strong>and</strong> bailing<br />
Final development : pumping, surging, <strong>and</strong> backwashing
Predevelopment<br />
• Predevelopment consists of the procedures followed during<br />
drilling <strong>and</strong> construction that minimize damage <strong>to</strong> the aquifer<br />
• The single most important procedure here is the control of<br />
drilling fluid properties; weight, viscosity, <strong>and</strong> s<strong>and</strong> content<br />
• Always condition drilling fluids <strong>to</strong> the proper characteristics<br />
before casing <strong>and</strong> gravel pack installation.
Failure <strong>to</strong> Account for Mud Properties
Collapse Due <strong>to</strong> Slot Plugging
Preliminary Development<br />
• Preliminary development comprises those procedures<br />
performed by the drill rig immediately after casing, screen,<br />
<strong>and</strong> gravel installation.<br />
• These procedures include Swabbing <strong>and</strong> Circulating, Jetting,<br />
Wire-line Swabbing <strong>and</strong> bailing, <strong>and</strong> simultaneous Swabbing<br />
<strong>and</strong> Airlifting.<br />
• Chemical Development is included here.
Swabbing <strong>and</strong> Circulating<br />
• Preliminary development should begin immediately following<br />
construction<br />
• His<strong>to</strong>rically done with a single swab on the bot<strong>to</strong>m of the drill<br />
string while fresh water is pumped down the drill pipe<br />
• Current construction techniques favor the dual swab <strong>and</strong><br />
simultaneous air-lift method<br />
• Swabs should fit snugly inside screen <strong>and</strong> be supported by<br />
steel plates
Wire-Line Swabbing<br />
• Single swab attached <strong>to</strong> a cable <strong>to</strong>ol<br />
scow or bailer.<br />
• Line swabbing normally begins at the<br />
<strong>to</strong>p of the screen section in short (20 <strong>to</strong><br />
40’) sections.<br />
• The swab is repeatedly hoisted with<br />
increased speed <strong>and</strong> length of haul.<br />
• The well must be frequently bailed of<br />
debris
Development by Swabbing
Single Swab
Single Swab Development<br />
• Beginning at the bot<strong>to</strong>m of the<br />
screen, the swab is vigorously raised<br />
<strong>and</strong> lowered.<br />
• Consolidates gravel, flushes fines <strong>and</strong><br />
filter cake from the gravel for removal<br />
by the circulating fluid.<br />
• Performed 2 or more times through<br />
the screen section, as long as gravel<br />
movement is noted.
Dual Swab Development<br />
• Very similar <strong>to</strong> the single swab<br />
technique.<br />
• The dual swab is vigorously<br />
raised <strong>and</strong> lowered while fresh<br />
water is pumped down the drill<br />
pipe.<br />
• The effectiveness of swabbing is<br />
measured by the amount of fine<br />
particles pulled in thru the<br />
screen.
Double Swab
Dual Swab <strong>and</strong> Simultaneous Airlift<br />
• The well is mechanically swabbed<br />
by raising <strong>and</strong> dropping the drill<br />
pipe equipped with a tight fitting<br />
dual swab on the bot<strong>to</strong>m.<br />
• During swabbing, water is airlifted<br />
from the well.<br />
• Swabbing is started at the <strong>to</strong>p of<br />
the screen <strong>to</strong> minimize the risk of<br />
s<strong>and</strong> locking the swabs.
Final Development / Pump Development
Pump Development<br />
• Final development step<br />
• Stresses larger area of aquifer around the<br />
well<br />
• Provides data for subsequent pump <strong>and</strong><br />
aquifer tests
Final Development<br />
• Final Development is accomplished by an extensive program<br />
of pumping, surging, <strong>and</strong> backwashing the well <strong>to</strong> remove<br />
any fine silts or s<strong>and</strong>s from the gravel pack <strong>and</strong> borehole<br />
wall.<br />
• To accomplish this, mobilize a development pump capable of<br />
150% of anticipated capacity.<br />
• Begin development slowly by pumping at about 20% of<br />
anticipated capacity, surge <strong>and</strong> backwash gently. Gradually<br />
increase efforts as well shows improvement.<br />
• Develop well <strong>to</strong> its maximum capacity while recording<br />
drawdown <strong>and</strong> s<strong>and</strong> content.
Roscoe Moss Company
Rossum<br />
S<strong>and</strong><br />
Tester
Specific Drawdown, s/Q (ft/GPM)<br />
Specific Drawdown, s/Q (ft/GPM)<br />
Specific Drawdown, s/Q (ft/GPM)<br />
Specific Drawdown, s/Q (ft/GPM)<br />
Well Development Type I - Under Developed<br />
0.16<br />
0.07<br />
• Five Types of well development<br />
0.14<br />
0.12<br />
0.1<br />
• Examples of Jurupa<br />
0.08<br />
0.06<br />
0.04<br />
• LACWD 40 4-68<br />
0.02<br />
Figure 6.6 Well Development Types<br />
0.06<br />
0.05<br />
0.04<br />
0.03<br />
0.02<br />
0.01<br />
Well Development Type II - Transitional<br />
0<br />
0 20 40 60 80 100 120 140 160 180 200<br />
Flow Rate, Q (GPM)<br />
Type I<br />
0<br />
0 20 40 60 80 100 120 140 160 180 200<br />
Flow Rate, Q (GPM)<br />
Type II<br />
Well Development Type III - Fully Developed<br />
0.1<br />
0.09<br />
0.08<br />
0.07<br />
0.06<br />
0.05<br />
0.04<br />
0.03<br />
0.02<br />
0.01<br />
0<br />
0 20 40 60 80 100 120 140 160 180 200<br />
Flow Rate, Q (GPM)<br />
0.25<br />
0.2<br />
0.15<br />
0.1<br />
0.05<br />
Well Development Type IV & V<br />
Fully Developed at Low Flow Rates - Transitional at High Flow Rates<br />
0<br />
0 20 40 60 80 100 120 140 160 180 200<br />
Flow Rate, Q (GPM)<br />
Type III<br />
TypeIV<br />
Type V
Specific Drawdown, s/Q<br />
0.080<br />
Well Development <strong>and</strong> Completion<br />
6-Jul-05<br />
• In this case the well was screened from 465 feet bgs <strong>to</strong><br />
7-Jul-05<br />
8-Jul-05<br />
0.070<br />
11-Jul-05<br />
795 feet bgs. Blank well casing was installed 12-Jul-05from<br />
13-Jul-05<br />
0.060<br />
ground surface <strong>to</strong> 465 feet bgs, <strong>and</strong> again from 795<br />
14-Jul-05<br />
Linear (8-Jul-05)<br />
0.050 feet bgs <strong>to</strong> 815 feet bgs.<br />
• Development that <strong>to</strong>ok place on this well over the<br />
0.040<br />
course of seven days.<br />
0.030<br />
Figure 10.8<br />
Development for Example Well<br />
Linear (8-Jul-05)<br />
Linear (11-Jul-05)<br />
Linear (12-Jul-05)<br />
Linear (14-Jul-05)<br />
Linear (14-Jul-05)<br />
• From this figure we see the well starts as a Type 1<br />
0.020<br />
development <strong>and</strong><br />
Trendlines<br />
transition in<strong>to</strong> a Type II <strong>and</strong> finally<br />
0.010 in<strong>to</strong> a Type III development.<br />
0.000<br />
0 500 1,000 1,500 2,000 2,500 3,000<br />
Discharge Rate, gpm<br />
38
Well <strong>Efficiency</strong><br />
Defined as : drawdown in the aquifer<br />
<strong>to</strong>tal drawdown in the well<br />
39
Water Level in Pumping Well<br />
Well Loss
Calculating Well <strong>Efficiency</strong><br />
E = Aquifer Losses<br />
Total Drawdown<br />
E = Aquifer Losses (BQ)<br />
Aquifer Losses + Well Losses (CQ²)<br />
E % = 100 x<br />
(BQ)<br />
(BQ + CQ²)<br />
41
Ground Surface<br />
Q<br />
Static Water Level<br />
Drawdown in Pumping Well<br />
Pumping Water Level<br />
Aquifer Loss<br />
(BQ)<br />
Well Loss<br />
2<br />
(CQ )<br />
Laminar flow losses<br />
B = Aquifer Loss Coefficient<br />
Turbulent flow losses<br />
C = Well Loss Coefficient<br />
Total Drawdown in Well<br />
= BQ + CQ 2
Drawdown, ft<br />
Calculating Well <strong>Efficiency</strong> Using Step Drawdown Test<br />
0<br />
1<br />
Time Since Pumping Began, Min<br />
10 100 1000<br />
50<br />
43
Pumping Step Test<br />
Discharge (Q) GPM<br />
STATIC WATER LEVEL<br />
Step 1 Pumping Level ----><br />
Step 2 Pumping Level ----><br />
Step 3 Pumping Level ----><br />
Specific Specific<br />
Discharge Drawdown Capacity Drawdown<br />
. Q s Q/s s/Q<br />
500 gpm 20 ft 25 gpm/ft .04 ft/gpm<br />
1000 gpm 52 ft 19 gpm/ft .05 ft/gpm<br />
1500 gpm 92 ft 16 gpm/ft .06 ft/gpm<br />
AQUIFER<br />
44
SPECIFIC DRAWDOWN, s/Q, ft/gpm<br />
Solving for Aquifer <strong>and</strong> Well Loss Coefficients -<br />
Specific Drawdown Plot<br />
0.06<br />
0.04<br />
C = 0.000025 ft/gpm (Well Loss Coefficient)<br />
0.02<br />
B = 0.025 ft/gpm (Aquifer Loss Coefficient)<br />
0<br />
0 500 1000 1500<br />
DISCHARGE, Q, [gpm]<br />
45
Data<br />
Discharge Drawdown Specific<br />
Capacity<br />
Specific<br />
Drawdown<br />
Aquifer<br />
Loss<br />
Well<br />
Loss<br />
Well<br />
<strong>Efficiency</strong><br />
Q gpm S ft Q/s gpm/ft s/Q ft/gpm BQ CQ %<br />
500 20 25 .04 12.5 6.3 67<br />
1000 52 19 .05 25 25 48<br />
1500 92 16 .06 37 56 40<br />
2<br />
B = 0.025 ft/gpm<br />
C = 0.000025 ft/gpm<br />
E % = 100 x<br />
BQ<br />
BQ + CQ²
Drawdown (s), ft<br />
Well <strong>Efficiency</strong> (E), %<br />
Specific Capacity Diagram – Design Discharge Rate<br />
0<br />
Discharge Rate (Q), gpm<br />
0 500<br />
1000 1500 2000<br />
Formation Loss (BQ)<br />
100<br />
80<br />
Design<br />
Total Drawdown<br />
Well Loss (CQ 2 )<br />
60<br />
100<br />
Well <strong>Efficiency</strong><br />
40<br />
20<br />
200<br />
0
Maintaining Well <strong>Efficiency</strong><br />
• Increased well losses (biological, physical clogging)<br />
• Decreased Specific Capacity<br />
• Decreased <strong>Efficiency</strong><br />
• Higher Operating Costs
Biological Fouling<br />
Scanning Electron Microscope Magnification = x 3850<br />
49
50<br />
Physical Clogging
Water Level in Pumping Well<br />
Well Loss
Example of Energy Cost<br />
Case 1: New Well<br />
<strong>Efficiency</strong> = 75%<br />
TDH = 308 ft<br />
Case 2: Well with 50 ft Additional Lift<br />
<strong>Efficiency</strong> = 65%<br />
TDH = 358 ft<br />
Where:<br />
Cost/Hour = gpm x TDH x 0.746 x Cost/kwh<br />
3960 x <strong>Efficiency</strong>
Annual Cost<br />
Parameter Case 1 Case 2<br />
Pumping Rate 1500 gpm 1500 gpm<br />
Pumping Level 250 ft 300 ft<br />
Discharge Pressure 58 ft 58 ft<br />
TDH 308 ft 358 ft<br />
Power Cost $ 0.10/kwh $ 0.10/kwh<br />
Well <strong>Efficiency</strong> 75 % 65%<br />
Annual Operation 4,380 hours 4,380 hours<br />
Annual Cost $50,595 $67,856<br />
Differential = $17,261
SUMMARY<br />
• The efficiency of the well should be considered during<br />
initial planning <strong>and</strong> design<br />
• <strong>Designing</strong> efficient wells requires minimizing well losses<br />
<strong>and</strong> underst<strong>and</strong>ing the relationship between the aquifer,<br />
filter pack <strong>and</strong> well screen<br />
• Achieve full production potential of the well by ensuring<br />
that it has been fully developed<br />
• Moni<strong>to</strong>r the specific capacity <strong>and</strong> efficiency of the well <strong>to</strong><br />
minimize operational costs
Questions<br />
Kevin McGillicuddy, P.G.<br />
(323) 263-4111<br />
Email: kmc@roscoemoss.com<br />
Website: www.roscoemoss.com