Cell-based Screening Assays - Ozyme
Cell-based Screening Assays - Ozyme
Cell-based Screening Assays - Ozyme

Create successful ePaper yourself
Turn your PDF publications into a flip-book with our unique Google optimized e-Paper software.
Whole <strong>Cell</strong> <strong>Assays</strong><br />
Antibody Validation for <strong>Cell</strong>-<strong>based</strong> Immunofluorescent <strong>Assays</strong><br />
Scientists at <strong>Cell</strong> Signaling Technology (CST) have validated over 800<br />
activation state-specific (e.g., phosphorylation-specific) and total protein<br />
antibodies for immunofluorescence (IF) applications such as automated<br />
cell-<strong>based</strong> assays.<br />
All CST antibodies approved for use in fluorescent cell-<strong>based</strong> assays have<br />
undergone a rigorous validation process to ensure optimal performance,<br />
including in-house testing on various high content platforms, such as the<br />
TTP ® LabTech Acumen ® e X3 and <strong>Cell</strong>omics ® ArrayScan ® V TI . Additionally,<br />
our exclusive line of XP ® monoclonal antibodies display the exceptional<br />
specificity, sensitivity, and reproducibility needed for the most robust<br />
automated fluorescent assays.<br />
Please contact our High Content <strong>Screening</strong> Group at HCS@cellsignal.com<br />
for more information or assistance with your HCS assays.<br />
Validation Includes:<br />
:: Antibody titration to determine optimal antibody concentration.<br />
:: Treatment of cell lines with pathway-specific inhibitors to verify<br />
treatment-induced translocation.<br />
:: Phosphatase treatment to verify phospho-specificity.<br />
:: Requirement of threshold signal-to-noise ratio in antibody:isotype<br />
comparison to ensure greatest possible sensitivity.<br />
:: Stringent testing to ensure lot-to-lot consistency.<br />
:: Antibody performance demonstrated in-house on multiple high content<br />
platforms.<br />
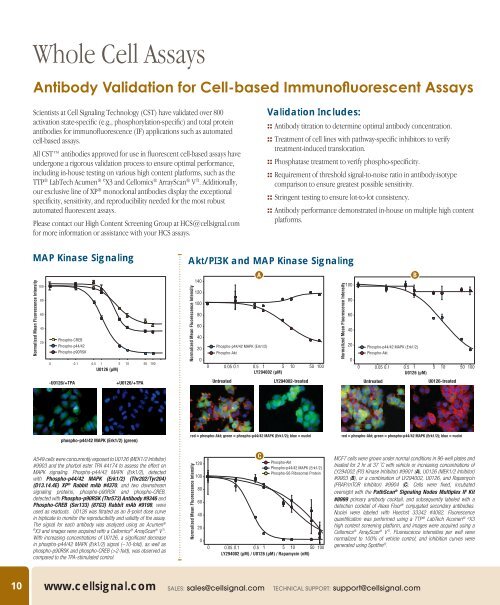
MAP Kinase Signaling<br />
Normalized Mean Fluorescence Intensity<br />
100<br />
80<br />
60<br />
40<br />
20<br />
Phospho-CREB<br />
Phospho-p44/42<br />
Phospho-p90RSK<br />
0 0.1 0.5 1 5 10 50 100<br />
U0126 (µM)<br />
Akt/PI3K and MAP Kinase Signaling<br />
Normalized Mean Fluorescence Intensity<br />
140<br />
120<br />
100<br />
80<br />
60<br />
40<br />
20<br />
0<br />
A<br />
Phospho-p44/42 MAPK (Erk1/2)<br />
Phospho-Akt<br />
0 0.05 0.1 0.5 1 5 10 50 100<br />
LY294002 (µM)<br />
-U0126/+TPA +U0126/+TPA<br />
Untreated LY294002-treated<br />
Normalized Mean Fluorescence Intensity<br />
100<br />
80<br />
60<br />
40<br />
20<br />
0<br />
B<br />
Phospho-p44/42 MAPK (Erk1/2)<br />
Phospho-Akt<br />
0 0.05 0.1 0.5 1 5 10 50 100<br />
U0126 (µM)<br />
Untreated<br />
U0126-treated<br />
phospho-p44/42 MAPK (Erk1/2) (green)<br />
red = phospho-Akt; green = phospho-p44/42 MAPK (Erk1/2); blue = nuclei<br />
red = phospho-Akt; green = phospho-p44/42 MAPK (Erk1/2); blue = nuclei<br />
A549 cells were concurrently exposed to U0126 (MEK1/2 Inhibitor)<br />
#9903 and the phorbol ester TPA #4174 to assess the effect on<br />
MAPK signaling. Phospho-p44/42 MAPK (Erk1/2), detected<br />
with Phospho-p44/42 MAPK (Erk1/2) (Thr202/Tyr204)<br />
(D13.14.4E) XP ® Rabbit mAb #4370, and two downstream<br />
signaling proteins, phospho-p90RSK and phospho-CREB,<br />
detected with Phospho-p90RSK (Thr573) Antibody #9346 and<br />
Phospho-CREB (Ser133) (87G3) Rabbit mAb #9198, were<br />
used as readouts. U0126 was titrated as an 8-point dose curve<br />
in triplicate to monitor the reproducibility and validity of the assay.<br />
The signal for each antibody was analyzed using an Acumen ®<br />
e X3 and images were acquired with a <strong>Cell</strong>omics ® ArrayScan ® V TI .<br />
With increasing concentrations of U0126, a significant decrease<br />
in phospho-p44/42 MAPK (Erk1/2) signal (~10-fold), as well as<br />
phospho-p90RSK and phospho-CREB (>2-fold), was observed as<br />
compared to the TPA-stimulated control.<br />
Normalized Mean Fluorescence Intensity<br />
120<br />
100<br />
80<br />
60<br />
40<br />
20<br />
0<br />
C<br />
Phospho-Akt<br />
Phospho-p44/42 MAPK (Erk1/2)<br />
Phospho-S6 Ribosomal Protein<br />
0 0.05 0.1 0.5 1 5 10 50 100<br />
LY294002 (µM) / U0126 (µM) / Rapamycin (nM)<br />
MCF7 cells were grown under normal conditions in 96-well plates and<br />
treated for 2 hr at 37 ˚C with vehicle or increasing concentrations of<br />
LY294002 (PI3 Kinase Inhibitor) #9901 (A), U0126 (MEK1/2 Inhibitor)<br />
#9903 (B), or a combination of LY294002, U0126, and Rapamycin<br />
(FRAP/mTOR Inhibitor) #9904 (C). <strong>Cell</strong>s were fixed, incubated<br />
overnight with the PathScan ® Signaling Nodes Multiplex IF Kit<br />
#8999 primary antibody cocktail, and subsequently labeled with a<br />
detection cocktail of Alexa Fluor ® conjugated secondary antibodies.<br />
Nuclei were labeled with Hoechst 33342 #4082. Fluorescence<br />
quantification was performed using a TTP ® LabTech Acumen ® e X3<br />
high content screening platform, and images were acquired using a<br />
<strong>Cell</strong>omics ® ArrayScan ® V TI . Fluorescence intensities per well were<br />
normalized to 100% of vehicle control, and inhibition curves were<br />
generated using Spotfire ® .<br />
10 www.cellsignal.com Sales: sales@cellsignal.com Technical Support: support@cellsignal.com