FCP OP MEDICAL BioHealth-Trends - medical.lu
FCP OP MEDICAL BioHealth-Trends - medical.lu
FCP OP MEDICAL BioHealth-Trends - medical.lu

You also want an ePaper? Increase the reach of your titles
YUMPU automatically turns print PDFs into web optimized ePapers that Google loves.
120<br />
110<br />
100<br />
90<br />
80<br />
70<br />
60<br />
50<br />
40<br />
30<br />
<strong>FCP</strong> <strong>OP</strong> <strong>MEDICAL</strong> <strong>BioHealth</strong>-<strong>Trends</strong> / Annual Report as of December 31, 2010<br />
(which is not represented at all in the NBI) and for<br />
biotechnology companies with a market capitalisation of less<br />
than USD 500 million (which make up only 8 % of the<br />
market capitalisation of the NBI). In contrast, the Fund's<br />
performance was 13.3 % higher than the DRG<br />
pharmaceuticals index (+7.6 % in EUR), and only a slight<br />
-1.8 % lower than the broad market S&P 500 (+22.7 %) (all<br />
data in EUR).<br />
<strong>FCP</strong> <strong>OP</strong> <strong>MEDICAL</strong> <strong>BioHealth</strong>-<strong>Trends</strong> is available in both a<br />
currency hedged and a non-currency hedged unit class. The<br />
currency hedged Unit Class EUR H rose by 13.3 %* over the<br />
reporting period.<br />
A key factor that distinguishes the investment strategy used<br />
by <strong>FCP</strong> <strong>OP</strong> <strong>MEDICAL</strong> <strong>BioHealth</strong>-<strong>Trends</strong> is its stock picking<br />
method, which does not depend on any indices. The Fund's<br />
investment strategy remained unchanged during the reporting<br />
period in terms of its primary focus on young companies<br />
with innovative products whose future development should<br />
bring corresponding increases in va<strong>lu</strong>e.<br />
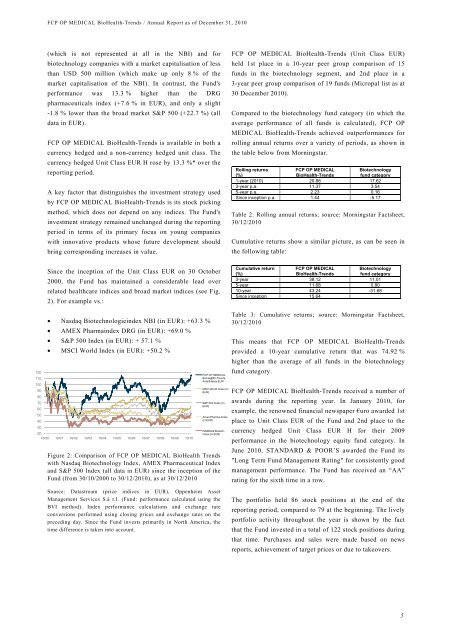
Since the inception of the Unit Class EUR on 30 October<br />
2000, the Fund has maintained a considerable lead over<br />
related healthcare indices and broad market indices (see Fig.<br />
2). For example vs.:<br />
• Nasdaq Biotechnologieindex NBI (in EUR): +63.3 %<br />
• AMEX Pharmaindex DRG (in EUR): +69.0 %<br />
• S&P 500 Index (in EUR): + 57.1 %<br />
• MSCI World Index (in EUR): +50.2 %<br />
20<br />
10/00 10/01 10/02 10/03 10/04 10/05 10/06 10/07 10/08 10/09 10/10<br />
<strong>FCP</strong> <strong>OP</strong> <strong>MEDICAL</strong><br />
BioHe@lth-<strong>Trends</strong><br />
Anteilklasse EUR<br />
MSCI World Index (in<br />
EUR)<br />
S&P 500 Index (in<br />
EUR)<br />
Amex Pharma-Index<br />
(in EUR)<br />
NASDAQ Biotech-<br />
Index (in EUR)<br />
Figure 2: Comparison of <strong>FCP</strong> <strong>OP</strong> <strong>MEDICAL</strong> <strong>BioHealth</strong> <strong>Trends</strong><br />
with Nasdaq Biotechnology Index, AMEX Pharmaceutical Index<br />
and S&P 500 Index (all data in EUR) since the inception of the<br />
Fund (from 30/10/2000 to 30/12/2010), as at 30/12/2010<br />
Source: Datastream (price indices in EUR), Oppenheim Asset<br />
Management Services S.à r.l. (Fund: performance calculated using the<br />
BVI method). Index performance calculations and exchange rate<br />
conversions performed using closing prices and exchange rates on the<br />
preceding day. Since the Fund invests primarily in North America, the<br />
time difference is taken into account.<br />
<strong>FCP</strong> <strong>OP</strong> <strong>MEDICAL</strong> <strong>BioHealth</strong>-<strong>Trends</strong> (Unit Class EUR)<br />
held 1st place in a 10-year peer group comparison of 15<br />
funds in the biotechnology segment, and 2nd place in a<br />
3-year peer group comparison of 19 funds (Micropal list as at<br />
30 December 2010).<br />
Compared to the biotechnology fund category (in which the<br />
average performance of all funds is calculated), <strong>FCP</strong> <strong>OP</strong><br />
<strong>MEDICAL</strong> <strong>BioHealth</strong>-<strong>Trends</strong> achieved outperformances for<br />
rolling annual returns over a variety of periods, as shown in<br />
the table below from Morningstar.<br />
Rolling returns<br />
<strong>FCP</strong> <strong>OP</strong> <strong>MEDICAL</strong><br />
Biotechnology<br />
(%)<br />
<strong>BioHealth</strong>-<strong>Trends</strong><br />
fund category<br />
1-year (2010) 20.88 17.62<br />
3-year p.a. 11.37 3.54<br />
5-year p.a. 2.23 0.16<br />
Since inception p.a. 1.44 -5.17<br />
Table 2: Rolling annual returns; source: Morningstar Factsheet,<br />
30/12/2010<br />
Cumulative returns show a similar picture, as can be seen in<br />
the following table:<br />
Cumulative return <strong>FCP</strong> <strong>OP</strong> <strong>MEDICAL</strong><br />
Biotechnology<br />
(%)<br />
<strong>BioHealth</strong>-<strong>Trends</strong><br />
fund category<br />
3-year 38.12 11.01<br />
5-year 11.68 0.80<br />
10-year 43.24 -31.68<br />
Since inception 15.64<br />
Table 3: Cumulative returns; source: Morningstar Factsheet,<br />
30/12/2010<br />
This means that <strong>FCP</strong> <strong>OP</strong> <strong>MEDICAL</strong> <strong>BioHealth</strong>-<strong>Trends</strong><br />
provided a 10-year cumulative return that was 74.92 %<br />
higher than the average of all funds in the biotechnology<br />
fund category.<br />
<strong>FCP</strong> <strong>OP</strong> <strong>MEDICAL</strong> <strong>BioHealth</strong>-<strong>Trends</strong> received a number of<br />
awards during the reporting year. In January 2010, for<br />
example, the renowned financial newspaper €uro awarded 1st<br />
place to Unit Class EUR of the Fund and 2nd place to the<br />
currency hedged Unit Class EUR H for their 2009<br />
performance in the biotechnology equity fund category. In<br />
June 2010, STANDARD & POOR’S awarded the Fund its<br />
"Long Term Fund Management Rating" for consistently good<br />
management performance. The Fund has received an “AA”<br />
rating for the sixth time in a row.<br />
The portfolio held 86 stock positions at the end of the<br />
reporting period, compared to 79 at the beginning. The lively<br />
portfolio activity throughout the year is shown by the fact<br />
that the Fund invested in a total of 122 stock positions during<br />
that time. Purchases and sales were made based on news<br />
reports, achievement of target prices or due to takeovers.<br />
5