FCP OP MEDICAL BioHealth-Trends - medical.lu
FCP OP MEDICAL BioHealth-Trends - medical.lu
FCP OP MEDICAL BioHealth-Trends - medical.lu

Create successful ePaper yourself
Turn your PDF publications into a flip-book with our unique Google optimized e-Paper software.
<strong>FCP</strong> <strong>OP</strong> <strong>MEDICAL</strong><br />
Sub-fund: <strong>FCP</strong> <strong>OP</strong> <strong>MEDICAL</strong> <strong>BioHealth</strong>-<strong>Trends</strong><br />
A M U T U A L I N V E S T M E N T F U N D O R G A N I Z E D U N D E R T H E L A W S O F T H E G R A N D - D U C H Y O F L U X E M B O U R G<br />
A N N U A L R E P O R T A S O F D E C E M B E R 3 1 , 2 0 1 0<br />
____<br />
FUND ADMINISTRATION:<br />
<strong>OP</strong>PENHEIM ASSET MANAGEMENT SERVICES S.À R.L.<br />
FUND DISTRIBUTION:<br />
<strong>OP</strong>PENHEIM FONDS TRUST GMBH<br />
____
<strong>FCP</strong> <strong>OP</strong> <strong>MEDICAL</strong><br />
Sub-fund: <strong>FCP</strong> <strong>OP</strong> <strong>MEDICAL</strong> <strong>BioHealth</strong>-<strong>Trends</strong><br />
A N N U A L R E P O R T A S O F D E C E M B E R 3 1 , 2 0 1 0<br />
Fundsreport 3<br />
The key facts, At-a-glance, Statement of Operations, Changes in Net Assets,<br />
Classification of Investments a.o. 9<br />
Statement of Assets and Liabilities 13<br />
Notes to the Annual Report 17<br />
Report of the Réviseur d’Entreprises agréé 19<br />
Tax information for German Investors 20<br />
Partners 24<br />
1
Distribution of the fund’s units has been announced in the<br />
Federal Republic of Germany in accordance with Section 132<br />
InvG of the Bundesanstalt für Finanzdienstleistungsaufsicht,<br />
Frankfurt. Distribution of the fund’s units has been<br />
announced in Switzerland in accordance to art. 45 AFG of<br />
the Eidgenössische Bankenkommission, Bern and in the<br />
Republic of Austria in accordance with Section 36 InvFG of<br />
the Finanzmarktaufsicht, Vienna.<br />
This Annual Report does not constitute an offer or an<br />
invitation to purchase units of the Fund. Statements on future<br />
performances can not be made on basis of this Annual<br />
Report. This Annual Report should be read exc<strong>lu</strong>sively in<br />
conjunction with the most recent version of the Prospectuses,<br />
the Fund’s Management Regulations and the last Annual<br />
Report. If the cut-off day of the Annual Report exceeds more<br />
than eight months a more recent Semi-Annual Report will be<br />
provided in addition to the Annual Report.<br />
The Prospectuses are available free of charge at the<br />
Management Company, at the Custodian Bank, at the<br />
representative in Switzerland and at the paying and<br />
distribution agents mentioned in this report.<br />
A statement of the changes to the schedule of investments<br />
in the period under review is available free of charge<br />
from the head office of the fund administrator, the swiss<br />
representative, the paying agents and the distributors.<br />
The name of the sub-fund <strong>FCP</strong> <strong>OP</strong> <strong>MEDICAL</strong> BioHe@lth-<br />
<strong>Trends</strong> changed with effect 15 November, 2010 to <strong>FCP</strong> <strong>OP</strong><br />
<strong>MEDICAL</strong> <strong>BioHealth</strong>-<strong>Trends</strong>.<br />
The original report is in German language. In case of any<br />
doubt on translation the original document shall prevail.
<strong>FCP</strong> <strong>OP</strong> <strong>MEDICAL</strong> <strong>BioHealth</strong>-<strong>Trends</strong> / Annual Report as of December 31, 2010<br />
Fundsreport<br />
<strong>FCP</strong> <strong>OP</strong> <strong>MEDICAL</strong> <strong>BioHealth</strong>-<strong>Trends</strong> is a healthcare fund<br />
for global investment that focuses on mid and small caps. Its<br />
objective is to outperform the indices over the long term by<br />
systematically concentrating on future high-growth markets<br />
in the healthcare industry. Given that product innovations in<br />
the pharmaceuticals industry and <strong>medical</strong> technology are<br />
among the most important growth drivers in the healthcare<br />
sector, the Fund primarily invests in young companies with<br />
business models built on innovation. The Fund especially<br />
targets companies with products that are soon to be released,<br />
new on the market or starting to be profitable. The Fund<br />
contains only a small proportion of companies with products<br />
in the relatively early stages of development.<br />
The investment focus is primarily on biotechnology firms<br />
that develop new drugs for illness currently lacking treatment<br />
or adequate treatment. Emerging pharmaceutical companies<br />
specialising in innovative preparations for specialty therapy<br />
areas represent another investment segment. In addition to<br />
the drug sector, the Fund also invests in <strong>medical</strong> technology,<br />
which offers many innovative product developments to<br />
improve diagnosis and therapy for a variety of disorders.<br />
Since small and mid cap stocks in the healthcare sector often<br />
display increased volatility (e.g. due to dependence on<br />
clinical results), the Fund controls company-specific risk by<br />
broadly spreading its investments over approximately 80<br />
positions.<br />
The Fund's investment style is oriented toward pure stock<br />
picking, without being tied to a benchmark. In this way, the<br />
Fund allows long-term investors to tap into the future<br />
potential of dynamic growth segments in the healthcare<br />
sector.<br />
Founded on 30 October 2000, <strong>FCP</strong> <strong>OP</strong> <strong>MEDICAL</strong><br />
<strong>BioHealth</strong>-<strong>Trends</strong> has now been on the market for more than<br />
ten years. Over this period, the Fund has outperformed both<br />
related healthcare and broader market indices (also see Fig.<br />
2, p.5). In addition, <strong>FCP</strong> <strong>OP</strong> <strong>MEDICAL</strong> <strong>BioHealth</strong>-<strong>Trends</strong><br />
recorded the top performance of +43.24 % in a 10-year<br />
comparison with other biotechnology funds, representing a<br />
lead of 53.8 % over the second place fund (Micropal peer<br />
group comparison of 15 biotechnology funds approved for<br />
distribution in Germany as at 30 December 2010, data in<br />
euros).<br />
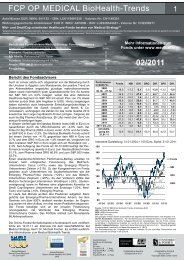
Investment strategy during the reporting period<br />
General conditions and sector-specific events<br />
The economic recovery continued in most of the major<br />
industrialised countries in 2010, with support from expansive<br />
monetary and tax measures in the USA in particular. The<br />
global economy therefore offered a favourable environment<br />
for the equity markets, which were only temporarily<br />
impacted by the euro debt crisis in the second quarter. As a<br />
result, the broad market indices recorded increases, such as<br />
the 13 % increase in the S&P 500 and the 11 % increase in<br />
the Dow Jones Industrial (all data in US dollars).<br />
Since healthcare is a defensive sector, it remained<br />
significantly behind the broad market in this environment.<br />
This was also due to a number of sector-specific events, such<br />
as continuing revenue losses due to patent expirations in the<br />
pharmaceutical sector at the same time that research<br />
efficiency is declining, additional costs due to healthcare<br />
reforms, and price pressure from economising measures in<br />
the public budgets of many EU countries. Given these<br />
circumstances, the S&P 500 Healthcare Index HCX only<br />
achieved a gain of +1 %. This was the worst performance of<br />
all 10 sector sub-indices of the S&P 500. The main<br />
contributing factors were the underperformances in the Big<br />
Pharma (-3 %) and <strong>medical</strong> technology (-4 %) sub-segments.<br />
However, even the large cap biotechnology companies only<br />
achieved an increase of +1.9 % (relative to the S&P 500<br />
Healthcare sub-sectors). Only the highly diversified Nasdaq<br />
Biotechnology Index NBI (comprised of 130 securities)<br />
achieved performance comparable to the broad market,<br />
recording an increase of 15 %. Close to 8 % of this<br />
performance occurred in December, with a major<br />
contribution attributable to Intermune’s 145 % increase in<br />
va<strong>lu</strong>e due to an EU approval recommendation (all data in US<br />
dollars).<br />
In view of the sector-specific challenges, the largest<br />
companies in the sector, and Big Pharma in particular, find<br />
themselves in a comprehensive process of transformation<br />
(inc<strong>lu</strong>ding cost reductions, biotechnology integration and<br />
diversification), of which the success is still impossible to<br />
predict. The resulting scepticism of many investors led in the<br />
end to significant underperformance by the large drug<br />
manufacturers (Amex Pharmaceutical Index DRG in USD:<br />
-1 % in 2010). As a result, the va<strong>lu</strong>ations of Big Pharma<br />
companies are at historically low levels, with an average<br />
price-earnings ratio (based on expected earnings for 2011) of<br />
10.2 for US pharmaceutical companies and 11.0 for the EU<br />
(Jeffries, 11 January 2011).<br />
3
<strong>FCP</strong> <strong>OP</strong> <strong>MEDICAL</strong> <strong>BioHealth</strong>-<strong>Trends</strong> / Annual Report as of December 31, 2010<br />
At the same time, the va<strong>lu</strong>ations of large cap biotechnology<br />
companies increasingly approached those of the large cap<br />
pharmaceutical companies. Mature product portfolios also<br />
lead to low growth rates for these companies, causing the<br />
price-earnings ratio (for the next 12 months) to decline from<br />
19 in 2006 to a current va<strong>lu</strong>e of approximately 13, which is<br />
also a historically low va<strong>lu</strong>e. Part of this is due to the<br />
uncertainty surrounding the expected competition by<br />
biosimilars, as high sales antibody products such as Rituxan<br />
and Enbrel will lose their patents in the USA or Europe<br />
starting in 2012/13 (Lazard, 6 January 2011). MorganStanley<br />
(17 June 2010) estimates the overall sales vo<strong>lu</strong>me of<br />
biotechnology products with expired patent protection over<br />
the next five years (until 2015/16) to be approximately USD<br />
62 billion.<br />
The negative impression about large cap biotechnology<br />
companies is also reflected in the breakdown of performance<br />
according to market capitalisation for 2010. The performance<br />
of 5.1 % recorded by high cap biotechnology companies<br />
(> USD 2 billion) lagged significantly behind mid cap<br />
companies. Companies in the USD 1 to 2 billion segment<br />
rose by 28.3 %, and those in the USD 0.5 to 1 billion<br />
segment by 9.0 %. The performance of small cap shares,<br />
however, was surprisingly weaker. Growth was 5.7 % in the<br />
segment from USD 200 to 500 million and companies with a<br />
capitalisation of less than USD 200 million even ended the<br />
year with a loss of -10.7 % (BIOCENTURY of 3 January<br />
2011, see Table 1). This weakness was due in part to the<br />
difficult funding conditions for small companies with<br />
products in the early stages of clinical development.<br />
4<br />
Market capitalisation Performance in %<br />
> USD 2,000m +5.1<br />
USD 1,000-1,999m +28.3<br />
USD 500-999m +9.0<br />
USD 200-499m +5.7<br />
< USD 200m -10.7<br />
Table 1: 2010 performances of biotechnology securities<br />
according to market capitalisation (all data in USD)<br />
In general, however, the funding situation in the<br />
biotechnology sector showed improvement. While USD 24.3<br />
billion was raised by a variety of funding measures in 2009,<br />
funding in the biotechnology sector reached a vo<strong>lu</strong>me of<br />
USD 36.2 billion in 2010 (Biocentury, 3 January 2011).<br />
The <strong>medical</strong> technology sector fell by -4 % in 2010, making<br />
it the healthcare segment with the poorest performance. The<br />
leading <strong>medical</strong> technology companies are also feeling the<br />
disadvantage of having a mature product portfolio with a<br />
lack of product innovation. The resulting competitive<br />
pressures lead to more difficult price negotiations that,<br />
combined with tight hospital budgets, resulted in price<br />
reductions. The affected products inc<strong>lu</strong>de high margin<br />
implants, such as defibrillators, stents, orthopaedic implants<br />
and dental implants. The <strong>medical</strong> technology sector was also<br />
adversely affected by the reduced demand for <strong>medical</strong> and<br />
hospital services due to high unemployment and increased<br />
health insurance co-payments and excesses. The <strong>medical</strong><br />
technology sector has now lost the average 15 per cent<br />
premium over the S&P 500 that it enjoyed over the last 10<br />
years and is currently trading at an 8 per cent discount<br />
(Morgan Stanley, 3 January 2011).<br />
The structural change that the large caps (which, after all,<br />
make up approximately 75 % of the market capitalisation,<br />
Goldmann Sachs, 14 December 2010) are undergoing is a<br />
burden on the healthcare sector. After two years of<br />
healthcare sector underperformance in comparison with the<br />
S&P 500, this sub-segment now has a price-earnings ratio of<br />
11 (for the next 12 months), which is a 16 % va<strong>lu</strong>ation<br />
discount relative to the S&P 500 (price-earnings ratio of 13<br />
for the next 12 months) (Leerink Swann, 5 January 2011).<br />
The industry transformation process mentioned above also<br />
led to lively M&A activity in part aimed at rejuvenating<br />
existing product portfolios and pipelines by acquiring smaller<br />
companies with innovative products.<br />
Fund strategy and investment performance<br />
Its strategic focus on small and mid cap securities clearly<br />
distinguishes <strong>FCP</strong> <strong>OP</strong> <strong>MEDICAL</strong> <strong>BioHealth</strong>-<strong>Trends</strong> from<br />
most other funds in the healthcare and biotechnology sectors,<br />
which primarily focus on large cap stocks.<br />
140<br />
135<br />
130<br />
125<br />
120<br />
115<br />
110<br />
105<br />
100<br />
95<br />
90<br />
01/10 02/10 03/10 04/10 05/10 06/10 07/10 08/10 09/10 10/10 11/10 12/10<br />
<strong>FCP</strong> <strong>OP</strong> Medical Biohe@lth-<strong>Trends</strong> EUR Nasdaq Biotechnology Index EUR Amex Pharmaceuticals Index EUR S&P 500 EUR<br />
Figure 1: Comparison of <strong>FCP</strong> <strong>OP</strong> <strong>MEDICAL</strong> <strong>BioHealth</strong> <strong>Trends</strong><br />
with Nasdaq Biotechnology Index, AMEX Pharmaceutical Index<br />
and S&P 500 Index (all data in EUR) from 1/1/2010 to<br />
30/12/2010, as at 30/12/2010<br />
Source: Datastream (price indices in EUR), Oppenheim Asset Management Services<br />
S.à r.l. (Fund: performance calculated using the BVI method). Index performance<br />
calculations and exchange rate conversions performed using closing prices and<br />
exchange rates on the preceding day. Since the Fund invests primarily in North<br />
America, the time difference is taken into account.<br />
The Fund’s Unit Class EUR recorded an increase in va<strong>lu</strong>e of<br />
20.9 %* over the reporting period (see Fig. 1), which<br />
represented an underperformance of -5.8 % compared to the<br />
Nasdaq Biotechnology Index (NBI in EUR), which rose<br />
26.7 %. The underperformance of the Fund can be explained<br />
by the difficult situation in the <strong>medical</strong> technology segment
120<br />
110<br />
100<br />
90<br />
80<br />
70<br />
60<br />
50<br />
40<br />
30<br />
<strong>FCP</strong> <strong>OP</strong> <strong>MEDICAL</strong> <strong>BioHealth</strong>-<strong>Trends</strong> / Annual Report as of December 31, 2010<br />
(which is not represented at all in the NBI) and for<br />
biotechnology companies with a market capitalisation of less<br />
than USD 500 million (which make up only 8 % of the<br />
market capitalisation of the NBI). In contrast, the Fund's<br />
performance was 13.3 % higher than the DRG<br />
pharmaceuticals index (+7.6 % in EUR), and only a slight<br />
-1.8 % lower than the broad market S&P 500 (+22.7 %) (all<br />
data in EUR).<br />
<strong>FCP</strong> <strong>OP</strong> <strong>MEDICAL</strong> <strong>BioHealth</strong>-<strong>Trends</strong> is available in both a<br />
currency hedged and a non-currency hedged unit class. The<br />
currency hedged Unit Class EUR H rose by 13.3 %* over the<br />
reporting period.<br />
A key factor that distinguishes the investment strategy used<br />
by <strong>FCP</strong> <strong>OP</strong> <strong>MEDICAL</strong> <strong>BioHealth</strong>-<strong>Trends</strong> is its stock picking<br />
method, which does not depend on any indices. The Fund's<br />
investment strategy remained unchanged during the reporting<br />
period in terms of its primary focus on young companies<br />
with innovative products whose future development should<br />
bring corresponding increases in va<strong>lu</strong>e.<br />
Since the inception of the Unit Class EUR on 30 October<br />
2000, the Fund has maintained a considerable lead over<br />
related healthcare indices and broad market indices (see Fig.<br />
2). For example vs.:<br />
• Nasdaq Biotechnologieindex NBI (in EUR): +63.3 %<br />
• AMEX Pharmaindex DRG (in EUR): +69.0 %<br />
• S&P 500 Index (in EUR): + 57.1 %<br />
• MSCI World Index (in EUR): +50.2 %<br />
20<br />
10/00 10/01 10/02 10/03 10/04 10/05 10/06 10/07 10/08 10/09 10/10<br />
<strong>FCP</strong> <strong>OP</strong> <strong>MEDICAL</strong><br />
BioHe@lth-<strong>Trends</strong><br />
Anteilklasse EUR<br />
MSCI World Index (in<br />
EUR)<br />
S&P 500 Index (in<br />
EUR)<br />
Amex Pharma-Index<br />
(in EUR)<br />
NASDAQ Biotech-<br />
Index (in EUR)<br />
Figure 2: Comparison of <strong>FCP</strong> <strong>OP</strong> <strong>MEDICAL</strong> <strong>BioHealth</strong> <strong>Trends</strong><br />
with Nasdaq Biotechnology Index, AMEX Pharmaceutical Index<br />
and S&P 500 Index (all data in EUR) since the inception of the<br />
Fund (from 30/10/2000 to 30/12/2010), as at 30/12/2010<br />
Source: Datastream (price indices in EUR), Oppenheim Asset<br />
Management Services S.à r.l. (Fund: performance calculated using the<br />
BVI method). Index performance calculations and exchange rate<br />
conversions performed using closing prices and exchange rates on the<br />
preceding day. Since the Fund invests primarily in North America, the<br />
time difference is taken into account.<br />
<strong>FCP</strong> <strong>OP</strong> <strong>MEDICAL</strong> <strong>BioHealth</strong>-<strong>Trends</strong> (Unit Class EUR)<br />
held 1st place in a 10-year peer group comparison of 15<br />
funds in the biotechnology segment, and 2nd place in a<br />
3-year peer group comparison of 19 funds (Micropal list as at<br />
30 December 2010).<br />
Compared to the biotechnology fund category (in which the<br />
average performance of all funds is calculated), <strong>FCP</strong> <strong>OP</strong><br />
<strong>MEDICAL</strong> <strong>BioHealth</strong>-<strong>Trends</strong> achieved outperformances for<br />
rolling annual returns over a variety of periods, as shown in<br />
the table below from Morningstar.<br />
Rolling returns<br />
<strong>FCP</strong> <strong>OP</strong> <strong>MEDICAL</strong><br />
Biotechnology<br />
(%)<br />
<strong>BioHealth</strong>-<strong>Trends</strong><br />
fund category<br />
1-year (2010) 20.88 17.62<br />
3-year p.a. 11.37 3.54<br />
5-year p.a. 2.23 0.16<br />
Since inception p.a. 1.44 -5.17<br />
Table 2: Rolling annual returns; source: Morningstar Factsheet,<br />
30/12/2010<br />
Cumulative returns show a similar picture, as can be seen in<br />
the following table:<br />
Cumulative return <strong>FCP</strong> <strong>OP</strong> <strong>MEDICAL</strong><br />
Biotechnology<br />
(%)<br />
<strong>BioHealth</strong>-<strong>Trends</strong><br />
fund category<br />
3-year 38.12 11.01<br />
5-year 11.68 0.80<br />
10-year 43.24 -31.68<br />
Since inception 15.64<br />
Table 3: Cumulative returns; source: Morningstar Factsheet,<br />
30/12/2010<br />
This means that <strong>FCP</strong> <strong>OP</strong> <strong>MEDICAL</strong> <strong>BioHealth</strong>-<strong>Trends</strong><br />
provided a 10-year cumulative return that was 74.92 %<br />
higher than the average of all funds in the biotechnology<br />
fund category.<br />
<strong>FCP</strong> <strong>OP</strong> <strong>MEDICAL</strong> <strong>BioHealth</strong>-<strong>Trends</strong> received a number of<br />
awards during the reporting year. In January 2010, for<br />
example, the renowned financial newspaper €uro awarded 1st<br />
place to Unit Class EUR of the Fund and 2nd place to the<br />
currency hedged Unit Class EUR H for their 2009<br />
performance in the biotechnology equity fund category. In<br />
June 2010, STANDARD & POOR’S awarded the Fund its<br />
"Long Term Fund Management Rating" for consistently good<br />
management performance. The Fund has received an “AA”<br />
rating for the sixth time in a row.<br />
The portfolio held 86 stock positions at the end of the<br />
reporting period, compared to 79 at the beginning. The lively<br />
portfolio activity throughout the year is shown by the fact<br />
that the Fund invested in a total of 122 stock positions during<br />
that time. Purchases and sales were made based on news<br />
reports, achievement of target prices or due to takeovers.<br />
5
<strong>FCP</strong> <strong>OP</strong> <strong>MEDICAL</strong> <strong>BioHealth</strong>-<strong>Trends</strong> / Annual Report as of December 31, 2010<br />
As at 30 December 2010, the 10 largest positions in the fund<br />
portfolio represented close to 28 % of the assets under<br />
management. The five largest positions were as follows:<br />
6<br />
Company Weighting<br />
in %<br />
Market<br />
capitalisation<br />
in USD m<br />
Segment Remarks<br />
ImmunoGen 4.3 640 Biotechnology Leader in antibody toxin<br />
conjugates<br />
Celera 3.2 508 Biotechnology Biomarkers, for<br />
personalised medicine<br />
among other things<br />
HBM<br />
Bioventures<br />
2.9 463 Biotechnology Investment company<br />
with investments in 35<br />
companies, mostly<br />
privately held<br />
Biomarin 2.8 2,785 Biotechnology Products (orphan<br />
drugs) against rare<br />
hereditary illnesses<br />
Ligand 2.8 175 Biotechnology Broad pipeline, already<br />
a variety of products on<br />
the market through<br />
partners<br />
Table 4: Five largest positions in the portfolio, as at 30/12/2010<br />
The Fund mainly invests in companies that have at least one<br />
product on the market (71.8 % of assets under management) and<br />
are either already profitable (40.8 %) or on the way to<br />
profitability (31.0 %). A further 14.5 % of assets under<br />
management are invested in companies whose products are in<br />
the final stage of clinical development or in the approval<br />
process. Only 10.9 % of assets under management were invested<br />
in companies with products in the early stages of product<br />
development (see Fig. 3). In this latter group, care was also<br />
taken to ensure that companies had sufficient funding for at least<br />
two years or had products or technologies that would be<br />
attractive to a partner.<br />
Companies with<br />
products on the<br />
market<br />
31,0 %<br />
Profitable<br />
companies with<br />
products on the<br />
market<br />
40,8 %<br />
Liquidity and other<br />
2,8 %<br />
Products in the<br />
early clinical phase<br />
10,9 %<br />
Products in Phase<br />
III and in the<br />
approval process<br />
14,5 %<br />
Figure 3: Portfolio structure of <strong>FCP</strong> <strong>OP</strong> <strong>MEDICAL</strong> <strong>BioHealth</strong>-<br />
<strong>Trends</strong> according to product status, in percentage of assets under<br />
management as at 30/12/2010<br />
In accordance with the Fund's primary focus on young<br />
companies and small and mid cap securities, 46.9 % of the<br />
assets under management were invested in companies with a<br />
market capitalisation of less than USD 500 million (23.1 %<br />
in companies below USD 200 million and 23.8 % in<br />
companies between USD 200 and 500 million). 20.4 % of the<br />
assets under management were in companies whose market<br />
capitalisation was between USD 500 million and 1.5 billion,<br />
6.7 % in companies with a market capitalisation of between<br />
USD 1.5 and 5 billion, and 23.2 % in companies with a<br />
market capitalisation greater than USD 5 billion (see Fig. 4).<br />
30<br />
25<br />
20<br />
15<br />
10<br />
5<br />
23,1<br />
0<br />
< USD 200m USD 200-500m USD 500-1,500m USD 1,500 -5,000m > USD 5,000m Liquidity and other<br />
Number 32 26 11 4 13<br />
Figure 4: Portfolio structure of <strong>FCP</strong> <strong>OP</strong> Medical <strong>BioHealth</strong>-<br />
<strong>Trends</strong> according to market capitalization, in percentage of<br />
assets under management (figures under the bars indicate the<br />
number of companies in each segment) as at 30/12/2010<br />
In terms of the different investment segments in the<br />
healthcare sector, the main areas of Fund investment at<br />
period end were innovative drug developers in the<br />
biotechnology segment, with a weighting of 53.3 %, and the<br />
emerging pharmaceuticals sector with 30.2 %. 10.3 % of<br />
assets under management were invested in companies in the<br />
<strong>medical</strong> technology sector, and 3.4 % in the healthcare<br />
services sector.<br />
The regional breakdown of assets under management reflects<br />
the importance of each market and the number of innovative<br />
listed companies in the healthcare sector. A majority of the<br />
investments (67 %) are hence in North America. 29.0 % are<br />
in European countries and 1 % in other regions (see Fig. 5).<br />
Liquidity holdings were 3 %.<br />
29,0%<br />
Fig. 5: Breakdown of assets under management according to<br />
region, as at 30/12/2010<br />
Progress in product development, product partnerships and,<br />
finally, market approval by the examining authorities are key<br />
factors in the performance of portfolio companies.<br />
Companies in the <strong>FCP</strong> <strong>OP</strong> <strong>MEDICAL</strong> <strong>BioHealth</strong>-<strong>Trends</strong><br />
portfolio also reported significant product advances in the<br />
last year. The following companies, for example, received<br />
market approval for their products (in the USA unless<br />
otherwise indicated):<br />
• Biomarin Pharmaceutical Inc. for Zenas (orphan product<br />
for treating Lambert-Eaton-Rooke syndrome, approved<br />
in the EU)<br />
23,8<br />
1,0%<br />
20,4<br />
3,0%<br />
6,7<br />
67,0%<br />
North America Europe Other Liquidity<br />
23,2<br />
2,8
<strong>FCP</strong> <strong>OP</strong> <strong>MEDICAL</strong> <strong>BioHealth</strong>-<strong>Trends</strong> / Annual Report as of December 31, 2010<br />
• Ligand Pharmaceuticals Inc. for Revolade (for treating<br />
idiopathic thrombocytopenic purpura, partnership with<br />
Glaxo, EU approval)<br />
• AtriCure Inc. for AtriClip (closure system for cardiac<br />
atrial appendages)<br />
• BSD Medical Corp. for MicrothermX (for tumour<br />
radiation)<br />
• Prostrakan Group PLC for Fortesta (for treating<br />
hypogonadism, partnership with Endo Pharma)<br />
The following companies are examples of holding that<br />
entered into product partnerships and platform deals:<br />
• Basilea Pharmaceutica AG issued Astellas a license for<br />
Isavuconazole, a drug undergoing approval studies for<br />
the treatment of serious systemic fungal infections. In<br />
addition to an advance payment of CHF 75 million,<br />
Basilea can receive further milestone payments of up to<br />
CHF 478 million and double-digit royalties based on<br />
product sales. The company also retained co-promotion<br />
rights.<br />
• Neurocrine Biosciences Inc. entered into a partnership<br />
with Abbott for an endometriosis product, receiving<br />
advanced payments of USD 75 million, as well as future<br />
performance payments of up to USD 500 million and<br />
royalties on future sales.<br />
The Fund also profited from the ongoing process of<br />
consolidation in the drug and <strong>medical</strong> technology sectors. A<br />
number of portfolio companies were acquired at high price<br />
premiums or received takeover offers during the reporting<br />
period:<br />
Acquired Sub-segment From Takeover premium<br />
Bioform Medical technology Merz Pharma 60%<br />
OSI Pharma Biotechnology Astellas 55%<br />
Javelin Emerging<br />
pharmaceuticals<br />
Hospira 61%<br />
ATS Medical Medical technology Medtronic 54%<br />
Zymogenetics Biotechnology Bristol Myers<br />
Squibb<br />
84%<br />
Crucell Biotechnology Johnson &<br />
Johnson<br />
58%<br />
Cypress Emerging<br />
Financial<br />
160%<br />
pharmaceuticals investors<br />
Genzyme Biotechnology Sanofi 40%<br />
Table 5: Portfolio companies acquired in 2010, the takeover<br />
premium is based on the share price before the takeover<br />
announcement<br />
The importance that stock picking has for the investment<br />
performance of <strong>FCP</strong> <strong>OP</strong> <strong>MEDICAL</strong> <strong>BioHealth</strong>-<strong>Trends</strong> is<br />
clearly demonstrated by the fact that selected investments are<br />
able to achieve price gains that far exceed the average. For<br />
example, the companies listed below achieved the largest<br />
price gains in the Fund during the reporting period.<br />
Above-average price losses were mainly the result of<br />
development setbacks (e.g. Ipsen, Curis and Neuroseach),<br />
denial of approval (e.g. Xenoport), disappointing sales or<br />
earnings (e.g. Biodelivery, Dyax, Auxilium), or the end of a<br />
partnership (e.g. Response Bio<strong>medical</strong>).<br />
Company Sub-sector Reasons Price<br />
gains<br />
(in LC)<br />
Amarin Emerging<br />
pharmaceuticals<br />
Successful completion of<br />
an approval study for<br />
lipid reducer<br />
Approval for tumour<br />
radiation device<br />
487%<br />
BSD Medical Medical<br />
technology<br />
259%<br />
Neurocrine<br />
Biotechnology Successful completion of 233%<br />
Bioscience<br />
Phase II study of<br />
Elagolix and partnership<br />
with Abbott<br />
Swedish Orphan Biotechnology Merger with Swedish 149%<br />
Biovitrum<br />
Orphan and advances<br />
for haemophilia products<br />
Cypress Emerging Acquired by financial 119%<br />
pharmaceuticals investors<br />
Staar Surgical Medical<br />
Improved financial 107%<br />
technologies structure and progress in<br />
approval of Visian TICL<br />
YM Biosciences Biotechnology Advances in<br />
development of JAK<br />
inhibitors<br />
88%<br />
OSI<br />
Pharmaceuticals<br />
Biotechnology Acquired by Astellas 85%<br />
Ziopharm Biotechnology Start of approval study<br />
for Zymafos<br />
82%<br />
Atricure Medical<br />
Sales growth and<br />
78%<br />
technology introduction of a new<br />
product<br />
Table 6: Companies with above-average price gains (in local<br />
currency, LC) during the reporting period<br />
In the case of pre-market investments, the Berlin<br />
biotechnology company Noxxon now has a second<br />
proprietary Spiegelmer product in clinical development,<br />
NOX-A12 (for stem cell mobilisation), to follow NOX-E36<br />
(for inflammatory kidney diseases). The start of clinical<br />
development for another preparation (NOX-H94 to mobilise<br />
iron metabolism for anaemia) is scheduled for the beginning<br />
of 2011. Based on these product advances, Noxxon was able<br />
to successfully raise EUR 35 million in funding in May (new<br />
lead investor NGN Capital). <strong>FCP</strong> <strong>OP</strong> <strong>MEDICAL</strong> <strong>BioHealth</strong>-<br />
<strong>Trends</strong> participated in this funding.<br />
The Fund also participated in the private funding for six<br />
other companies, namely YM Biosciences, Neurocrine<br />
Biosciences, Dyax and Pharming, Cerus and WorldHeart. It<br />
was hence able to purchase shares at a discount from the<br />
current market price, together with warrants in some cases.<br />
Change in fund units and assets under management<br />
The Fund had EUR 101.6 million in assets under<br />
management at the end of the reporting period (beginning of<br />
period: EUR 78.5 million). This growth was due to price<br />
increases as well as net inflows of EUR 6.8 million. The<br />
number of Fund units rose by 8.3 % from 667,697 to<br />
722,926.<br />
Outlook<br />
Forecasts for the global healthcare market assume that it will<br />
grow 1.25 to 1.5 times as fast as gross domestic product over<br />
the next 10 years. In abso<strong>lu</strong>te terms, the leading markets in<br />
7
<strong>FCP</strong> <strong>OP</strong> <strong>MEDICAL</strong> <strong>BioHealth</strong>-<strong>Trends</strong> / Annual Report as of December 31, 2010<br />
the USA, Europe and Japan are expected to grow by USD 1.8<br />
- 2.0 trillion, and the rest of the world (in particular the<br />
emerging markets) by USD 1.7 - 2.2 trillion (Morgan<br />
Stanley, 7 January 2010, sources IMF and WHO). With<br />
respect to drug expenditures, IMS Health (21 April 2010)<br />
predicts annual growth rates of approximately 5 %, which<br />
corresponds to an increase in global drug sales from USD<br />
839 billion in 2009 to USD 1.1 trillion in 2014. In the<br />
industrialised countries, this is primarily based on expected<br />
product innovations and the increasing age of the population.<br />
The strong growth in emerging market demand for healthcare<br />
services is correlated with the above-average increase in<br />
prosperity there.<br />
In contrast to these growth forecasts, current va<strong>lu</strong>ations of<br />
pharmaceutical, biotechnology and <strong>medical</strong> technology<br />
companies are at historically low levels, mainly due to a<br />
focus on generally weak growth resulting from structural<br />
factors. This weak growth is primarily the result of extensive<br />
drug patent expirations (it is estimated that approximately<br />
USD 180 billion in annual sales will become patent-free<br />
between 2009 and 2016, Morgan Stanley, 17 June 2010), as<br />
well as government healthcare reforms and economising<br />
measures in public budgets that could negatively affect<br />
healthcare expenditures in the industrialised countries. On<br />
the other hand, US healthcare reform could, by itself, trigger<br />
a significant growth spurt starting in 2014 by enrolling more<br />
than 32 million Americans in health insurance plans.<br />
New drugs in both the pharmaceutical and biotechnology<br />
sectors will once again make key contributions to this<br />
growth. These inc<strong>lu</strong>de, for example, a second generation of<br />
antibodies with improved characteristics, new cancer<br />
medications and products for CNS illnesses, such as multiple<br />
sclerosis and Alzheimer’s disease. Further advances can also<br />
be expected in terms of medications for auto-immune<br />
illnesses such as rheumatism, antibiotics for multiresistant<br />
germs and preparations for stroke, cardiac dysrhythmias and<br />
diabetes. In addition, companies have also specialised in new<br />
vaccine development, so-called "orphan" products for rare<br />
hereditary illnesses (e.g. Gaucher’s disease) and targeted<br />
therapies for personalised medicine based on genetic<br />
profiles.<br />
The prospects for the <strong>medical</strong> technology sector are also<br />
varied. Due to a mature product portfolio, intensive price<br />
competition is having an adverse effect on the sales growth<br />
of many products. The competitive situation is, however,<br />
having a positive effect on purchases of innovative <strong>medical</strong><br />
technology capital goods for diagnosis and therapy in the<br />
hospital sector. In addition, a strengthening of the economic<br />
upturn could be expected to overcome the recessionary<br />
weakness in self-pay products (aesthetic products, dental<br />
implants, hearing aids) and co-payments by patients should<br />
8<br />
eliminate the backlog of surgical interventions built up in<br />
previous years. Product innovations, such as molecular or<br />
gene-based testing systems, innovative minimally invasive<br />
procedures for replacing heart valves, robot-controlled<br />
surgical technologies, innovative radiation procedures for<br />
cancer therapy, and imaging procedures are also attractive<br />
growth segments.<br />
The process of transformation already begun by large cap<br />
companies will continue. As a result, M&A activities can<br />
also be expected to continue in the future, which means that<br />
small and mid cap companies with innovative and well<br />
differentiated products can be expected to be attractive<br />
licensing partners and takeover candidates. Continued<br />
economic recovery should also improve the funding<br />
conditions for small cap companies with market<br />
capitalisations of less than USD 500 million, so that they too<br />
can pursue product development in financial security.<br />
Summary<br />
<strong>FCP</strong> <strong>OP</strong> <strong>MEDICAL</strong> <strong>BioHealth</strong>-<strong>Trends</strong>' focus on small and<br />
mid cap companies developing innovative products in the<br />
healthcare sector (biotechnology, <strong>medical</strong> technology,<br />
emerging pharmaceuticals, etc.) is designed to offer long-<br />
term investors potential price gains that will continue to<br />
exceed average market growth rates. The small and mid cap<br />
segment still continues to offer favourable conditions for<br />
positive price performance, even after the good performance<br />
achieved by the Fund in the last two years.<br />
*) calculated according to BVI Bundesverband Investment<br />
und Asset Management e.V.<br />
The statements about the capital market environment are<br />
consistent with the state of information at the time of the<br />
reporting. The investment advisor reserves the right to<br />
modify his assessment.
<strong>FCP</strong> <strong>OP</strong> <strong>MEDICAL</strong> <strong>BioHealth</strong>-<strong>Trends</strong> / Annual Report as of December 31, 2010<br />
THE KEY FACTS<br />
Investment policy Shares in biotechnology, <strong>medical</strong><br />
German Security-code<br />
technology, health industry and pharmacy<br />
Unit Class EUR 941.135<br />
Unit Class EUR H A0F69B<br />
Unit Class I A0MNRQ<br />
Unit Class I H A0MQG5<br />
ISIN-Code<br />
Unit Class EUR LU0119891520<br />
Unit Class EUR H LU0228344361<br />
Unit Class I LU0294851513<br />
Unit Class I H LU0295354772<br />
Swiss Security-code<br />
Unit Class EUR 1.148.391<br />
Unit Class EUR H 2.256.911<br />
Unit Class I 3.032.638<br />
Unit Class I H 3.041.692<br />
Fund currency EUR<br />
Date of inception<br />
Unit Class EUR 30.10.2000<br />
Unit Class EUR H 01.10.2005<br />
Unit Class I 02.05.2007<br />
Unit Class I H 02.05.2007<br />
Financial year 01.01. - 31.12.<br />
Reporting period 01.01.2010 - 31.12.2010<br />
First offering price per unit<br />
Unit Class EUR 126,00 EUR<br />
Unit Class EUR H 124,02 EUR<br />
Unit Class I 129,00 EUR<br />
Unit Class I H 133,72 EUR<br />
(each incl. offering premium)<br />
First bid price per unit<br />
Unit Class EUR 120,00 EUR<br />
Unit Class EUR H 118,11 EUR<br />
Unit Class I 122,86 EUR<br />
Unit Class I H 127,35 EUR<br />
Subscription fee up to 5,00 %<br />
Management fee p.a. up to 1,90 %<br />
p<strong>lu</strong>s performance bonus<br />
Custodian bank fee p.a. up to 0,15 %<br />
Dividends none (reinvested)<br />
AT-A-GLANCE 31.12.2010<br />
Total Net Assets (EUR millions) 101,65<br />
Units in circulation Class (EUR) - (units) 370.450<br />
Bid price Class (EUR) - (EUR per unit) 138,77<br />
Offering price Class (EUR) - (EUR per unit) 145,71<br />
Units in circulation Class (EUR H) - (units) 101.580<br />
Bid price Class (EUR H) - (EUR per unit) 141,07<br />
Offering price Class (EUR H) - (EUR per unit) 148,12<br />
Units in circulation Class (I) - (units) 209.358<br />
Bid price Class (I) - (EUR per unit) 141,65<br />
Offering price Class (I) - (EUR per unit) 148,73<br />
Units in circulation Class (I H) - (units) 41.538<br />
Bid price Class (I H) - (EUR per unit) 150,60<br />
Offering price Class (I H) - (EUR per unit) 158,13<br />
DEVEL<strong>OP</strong>MENT OF THE TOTAL NET ASSETS<br />
OVER THE LAST 3 YEARS<br />
VALUES AT FINANCIAL YEAR-END<br />
Financial year Total Net Assets<br />
01.10.2006 - 31.12.2007<br />
(in EUR)<br />
01.01.2008 - 31.12.2008 51.191.562,56<br />
01.01.2009 - 31.12.2009 78.501.097,30<br />
01.01.2010 - 31.12.2010<br />
DEVEL<strong>OP</strong>MENT OF THE NET ASSET VALUE OVER<br />
THE LAST 3 YEARS<br />
VALUES AT FINANCIAL YEAR-END<br />
Financial Year<br />
110.208.840,60<br />
101.647.221,24<br />
Net Asset Va<strong>lu</strong>e per Unit (in EUR)<br />
EUR EUR H I I H<br />
01.10.2006 - 31.12.2007 100,47 111,50 100,33 111,54<br />
01.01.2008 - 31.12.2008 68,76 75,17 69,02 78,79<br />
01.01.2009 - 31.12.2009 114,80 124,56 115,86 131,57<br />
01.01.2010 - 31.12.2010 138,77 141,07 141,65 150,60<br />
9
<strong>FCP</strong> <strong>OP</strong> <strong>MEDICAL</strong> <strong>BioHealth</strong>-<strong>Trends</strong> / Annual Report as of December 31, 2010<br />
DEVEL<strong>OP</strong>MENT OF THE NET ASSET VALUE (IN EUR)<br />
UNIT CLASS EUR<br />
Highest net asset va<strong>lu</strong>e per unit<br />
in the reporting period (30.12.2010) 138,77<br />
Lowest net asset va<strong>lu</strong>e per unit<br />
in the reporting period (11.02.2010) 114,41<br />
Performance in the period under review *) 20,88 %<br />
Performance since commencement *) 15,64 %<br />
Performance over the last 3 years<br />
DEVEL<strong>OP</strong>MENT OF THE NET ASSET VALUE (IN EUR)<br />
UNIT CLASS EUR H<br />
Highest net asset va<strong>lu</strong>e per unit<br />
in the reporting period (30.12.2010) 141,07<br />
Lowest net asset va<strong>lu</strong>e per unit<br />
in the reporting period (07.07.2010) 116,32<br />
Performance in the period under review *) 13,25 %<br />
Performance since commencement *) 19,44 %<br />
Performance over the last 3 years<br />
*) calculated according to BVI Bundesverband Investment und Asset Management e.V.<br />
10<br />
80%<br />
60%<br />
40%<br />
20%<br />
0%<br />
-20%<br />
-40%<br />
-60%<br />
80%<br />
60%<br />
40%<br />
20%<br />
0%<br />
-20%<br />
-40%<br />
-60%<br />
-31,56%<br />
66,96%<br />
20,88%<br />
01.01.08 - 31.12.08 01.01.09 - 31.12.09 01.01.10 - 31.12.10<br />
Performance*) of the financial year in % (left scale)<br />
Accumulated performance on month-end basis, indicated on 100 per<br />
01.01.08 (right scale)<br />
-32,58%<br />
65,70%<br />
13,25%<br />
01.01.08 - 31.12.08 01.01.09 - 31.12.09 01.01.10 - 31.12.10<br />
Performance*) of the financial year in % (left scale)<br />
Accumulated performance on month-end basis, indicated on 100 per<br />
01.01.08 (right scale)<br />
180<br />
160<br />
140<br />
120<br />
100<br />
80<br />
60<br />
40<br />
180<br />
160<br />
140<br />
120<br />
100<br />
80<br />
60<br />
40<br />
DEVEL<strong>OP</strong>MENT OF THE NET ASSET VALUE (IN EUR)<br />
UNIT CLASS I<br />
Highest net asset va<strong>lu</strong>e per unit<br />
in the reporting period (30.12.2010) 141,65<br />
Lowest net asset va<strong>lu</strong>e per unit<br />
in the reporting period (11.02.2010) 115,54<br />
Performance in the period under review *) 22,26 %<br />
Performance since commencement *) 15,29 %<br />
Performance over the last 3 years<br />
80%<br />
60%<br />
40%<br />
20%<br />
0%<br />
-20%<br />
-40%<br />
-60%<br />
-31,21%<br />
DEVEL<strong>OP</strong>MENT OF THE NET ASSET VALUE (IN EUR)<br />
UNIT CLASS I H<br />
Highest net asset va<strong>lu</strong>e per unit<br />
in the reporting period (30.12.2010) 150,60<br />
Lowest net asset va<strong>lu</strong>e per unit<br />
67,86%<br />
in the reporting period (07.07.2010) 123,17<br />
Performance in the period under review *) 14,46 %<br />
Performance since commencement *) 18,26 %<br />
Performance over the last 3 years<br />
80%<br />
60%<br />
40%<br />
20%<br />
0%<br />
-20%<br />
-40%<br />
-60%<br />
22,26%<br />
01.01.08 - 31.12.08 01.01.09 - 31.12.09 01.01.10 - 31.12.10<br />
Performance*) of the financial year in % (left scale)<br />
Accumulated performance on month-end basis, indicated on 100 per<br />
01.01.08 (right scale)<br />
-29,36%<br />
66,99%<br />
14,46%<br />
01.01.08 - 31.12.08 01.01.09 - 31.12.09 01.01.10 - 31.12.10<br />
Performance*) of the financial year in % (left scale)<br />
Accumulated performance on month-end basis, indicated on 100 per<br />
01.01.08 (right scale)<br />
Past performance is no indication of current or future performance. The performance<br />
data do not take account of commissions and costs on the issue and redemptions of units.<br />
180<br />
160<br />
140<br />
120<br />
100<br />
80<br />
60<br />
40<br />
180<br />
160<br />
140<br />
120<br />
100<br />
80<br />
60<br />
40
<strong>FCP</strong> <strong>OP</strong> <strong>MEDICAL</strong> <strong>BioHealth</strong>-<strong>Trends</strong> / Annual Report as of December 31, 2010<br />
STATEMENT OF CHANGES IN THE NUMBER OF UNITS<br />
OUTSTANDING FROM 01.01.2010 TO 31.12.2010<br />
UNIT CLASS EUR<br />
Number of units outstanding at the beginning<br />
of the reporting period 424.075<br />
Number of units issued 185.415<br />
Number of units redeemed -239.040<br />
Number of units outstanding at the end<br />
of the reporting period 370.450<br />
STATEMENT OF CHANGES IN THE NUMBER OF UNITS<br />
OUTSTANDING FROM 01.01.2010 TO 31.12.2010<br />
UNIT CLASS EUR H<br />
Number of units outstanding at the beginning<br />
of the reporting period 94.959<br />
Number of units issued 19.334<br />
Number of units redeemed -12.713<br />
Number of units outstanding at the end<br />
of the reporting period 101.580<br />
STATEMENT OF CHANGES IN THE NUMBER OF UNITS<br />
OUTSTANDING FROM 01.01.2010 TO 31.12.2010<br />
UNIT CLASS I<br />
Number of units outstanding at the beginning<br />
of the reporting period 99.840<br />
Number of units issued 117.499<br />
Number of units redeemed -7.981<br />
Number of units outstanding at the end<br />
of the reporting period 209.358<br />
STATEMENT OF CHANGES IN THE NUMBER OF UNITS<br />
OUTSTANDING FROM 01.01.2010 TO 31.12.2010<br />
UNIT CLASS I H<br />
Number of units outstanding at the beginning<br />
of the reporting period 48.823<br />
Number of units issued 9.045<br />
Number of units redeemed -16.330<br />
Number of units outstanding at the end<br />
of the reporting period 41.538<br />
GEOGRAPHIC CLASSIFICATION<br />
OF INVESTMENTS<br />
% of fund's<br />
assets<br />
USA 59,05<br />
Switzerland 9,54<br />
United Kingdom 7,52<br />
France 4,58<br />
Germany 3,03<br />
Sweden 2,47<br />
Denmark 2,36<br />
Israel 2,29<br />
Canada 2,28<br />
Belgium 1,61<br />
Cayman Islands 0,75<br />
Austria 0,60<br />
Norway 0,59<br />
Australia 0,34<br />
Greece 0,17<br />
CURRENCY CLASSIFICATION<br />
OF INVESTMENTS<br />
97,18<br />
% of fund's<br />
assets<br />
USD 66,26<br />
CHF 9,54<br />
EUR 8,80<br />
GBP 6,47<br />
SEK 2,47<br />
DKK 2,36<br />
NOK 0,59<br />
CAD 0,35<br />
AUD 0,34<br />
ECONOMIC CLASSIFICATION<br />
OF INVESTMENTS<br />
97,18<br />
% of fund's<br />
assets<br />
Bio-Tech 53,34<br />
Emerging Pharma 30,19<br />
Med-Tech 10,26<br />
Healthcare-Services 3,39<br />
97,18<br />
11
<strong>FCP</strong> <strong>OP</strong> <strong>MEDICAL</strong> <strong>BioHealth</strong>-<strong>Trends</strong> / Annual Report as of December 31, 2010<br />
CHANGES IN NET ASSETS (IN EUR)<br />
FOR THE PERIOD FROM 01.01.2010 TO 31.12.2010<br />
Net assets at the beginning<br />
of the reporting period 78.501.097,30<br />
Subscriptions (EUR)<br />
Subscriptions (EUR H)<br />
Subscriptions (I)<br />
Subscriptions (I H)<br />
Redemptions (EUR)<br />
Redemptions (EUR H)<br />
Redemptions (I)<br />
Redemptions (I H)<br />
Total proceeds from unit transactions 6.777.390,94<br />
Income equalisation -52.735,58<br />
Net investment income/expense -3.155.761,73<br />
Realized gain/loss<br />
on investments 12.044.082,94<br />
on options -98.623,05<br />
on foreign exchange transactions -48.254,22<br />
on foreign forward exchange transactions -1.045.453,48<br />
Net change in unrealized<br />
appreciation/depreciation<br />
on investments 8.754.387,63<br />
on foreign exchange transactions 51.757,16<br />
on foreign forward exchange transactions -80.666,67<br />
Result of operations 16.421.468,58<br />
Total net assets at the end<br />
of the reporting period<br />
12<br />
23.084.848,13<br />
2.458.449,65<br />
14.935.229,02<br />
1.224.324,32<br />
-30.087.538,86<br />
-1.654.915,34<br />
-1.036.360,17<br />
-2.146.645,81<br />
101.647.221,24<br />
STATEMENT OF <strong>OP</strong>ERATIONS (IN EUR)<br />
FOR THE PERIOD FROM 01.01.2010 TO 31.12.2010<br />
(INCL. INCOME EQUALISATION)<br />
Income<br />
Interest on bonds 6.952,90<br />
Dividends 445.635,41<br />
Interest on bank deposits 6.689,97<br />
Income equalisation -9.669,10<br />
Total income 449.609,18<br />
Expenses<br />
Management fee -1.463.649,55<br />
Performance bonus -1.800.695,33<br />
Custodian bank fee -145.024,50<br />
Taxe d'Abonnement -36.855,88<br />
Audit fee -11.000,00<br />
Other expenses -210.550,33<br />
Expense equalisation 62.404,68<br />
Total expenses -3.605.370,91<br />
Net investment income/expense -3.155.761,73<br />
Realized gain/loss 10.851.752,19<br />
Net change in unrealized<br />
appreciation/depreciation 8.725.478,12<br />
Result of operations 16.421.468,58
<strong>FCP</strong> <strong>OP</strong> <strong>MEDICAL</strong> <strong>BioHealth</strong>-<strong>Trends</strong> / Annual Report as of December 31, 2010<br />
STATEMENT OF ASSETS AND LIABILITIES AS OF 31.12.2010<br />
Shares<br />
Number Price Market Va<strong>lu</strong>e %*) of<br />
Currency of Securities description in (EUR) Net Assets<br />
Shares Currency 31.12.2010<br />
AUD 1.005.865 ChemGenex Pharmaceuticals Ltd. 0,4450 345.431,33 0,34<br />
CAD 1.809.883 Adherex Technologies Inc. 0,0550 75.935,32 0,07<br />
CAD 118.500 Protox Therapeutics Inc. 0,7200 65.085,08 0,06<br />
CAD 837.017 Response Bio<strong>medical</strong> Corp. 0,3400 217.091,99 0,21<br />
CHF 139.160 Addex Pharmaceuticals Ltd. NA 9,8100 1.094.667,31 1,08<br />
CHF 38.483 Basilea Pharmaceutica AG NA 65,1000 2.008.855,19 1,98<br />
CHF 88.443 HBM BioVentures AG NA 42,0000 2.978.595,16 2,93<br />
CHF 23.000 Lonza Group AG NA 77,2500 1.424.705,32 1,40<br />
CHF 48.500 Novartis AG NA 56,3000 2.189.519,70 2,15<br />
DKK 32.294 Alk-Abello A/S -B- 322,5000 1.397.417,80 1,37<br />
DKK 23.827 Bavarian Nordic A/S 246,0000 786.464,61 0,77<br />
DKK 466.928 Topotarget A/S 3,3600 210.505,72 0,21<br />
EUR 310.676 Alapis S.A. 0,5400 167.765,04 0,17<br />
EUR 26.100 Eurofins Scientific S.A. 54,1700 1.413.837,00 1,39<br />
EUR 52.000 Intercell AG 11,7400 610.480,00 0,60<br />
EUR 124.762 Marseille-Kliniken AG 2,5500 318.143,10 0,31<br />
EUR 46.000 Rhoen-Klinikum AG 16,3000 749.800,00 0,74<br />
EUR 41.300 Sanofi-Aventis 49,1500 2.029.895,00 2,00<br />
EUR 62.500 UCB S.A. 26,1800 1.636.250,00 1,61<br />
GBP 964.283 BTG PLC 2,3300 2.636.755,14 2,59<br />
GBP 147.600 GlaxoSmithkline PLC 12,6600 2.192.953,55 2,16<br />
GBP 630.115 Prostrakan Group PLC 0,8925 659.990,09 0,65<br />
GBP 737.729 Vectura Group PLC 0,6900 597.386,38 0,59<br />
GBP 1.071.729 Vernalis PLC 0,3875 487.378,16 0,48<br />
NOK 117.270 Clavis Pharma ASA 40,2000 603.092,58 0,59<br />
SEK 2.175.026 Karo Bio A.B. 1,9300 467.737,11 0,46<br />
SEK 439.606 Swedish Orphan Biovitrum AB 41,8000 2.047.481,39 2,01<br />
USD 342.547 Achillion Pharmaceuticals Inc. 4,0000 1.043.953,09 1,03<br />
USD 496.352 Adolor Corp. 1,2500 472.716,34 0,47<br />
USD 164.680 Amarin Corp. PLC ADR 8,5000 1.066.499,38 1,05<br />
USD 51.400 Amgen Inc. 55,8700 2.187.976,30 2,15<br />
USD 150.000 Amylin Pharmaceuticals Inc. 14,8300 1.694.857,67 1,67<br />
USD 235.554 Arqule Inc. 6,0700 1.089.381,51 1,07<br />
USD 292.198 Array BioPharma Inc. 3,0100 670.107,62 0,66<br />
USD 117.999 AtriCure Inc. 10,2700 923.314,37 0,91<br />
USD 68.000 Auxilium Pharmaceuticals Inc. 21,1400 1.095.253,68 1,08<br />
USD 271.896 AVI Biopharma Inc. 2,1200 439.176,91 0,43<br />
USD 56.100 Baxter Intl. Inc. 50,9100 2.176.039,54 2,14<br />
USD 700.368 BioDelivery Sciences Intl. Inc. 3,2100 1.712.900,56 1,69<br />
USD 139.100 Biomarin Pharmaceutical Inc. 27,2600 2.889.041,66 2,84<br />
USD 401.903 BioScrip Inc. 5,2900 1.619.860,98 1,59<br />
USD 33.068 BioSpecifics Technologies Corp. 25,2901 637.175,84 0,63<br />
13
<strong>FCP</strong> <strong>OP</strong> <strong>MEDICAL</strong> <strong>BioHealth</strong>-<strong>Trends</strong> / Annual Report as of December 31, 2010<br />
STATEMENT OF ASSETS AND LIABILITIES AS OF 31.12.2010<br />
USD 50.000 Biostar Pharmaceuticals Inc. 2,7000 102.857,18 0,10<br />
USD 171.607 BSD Medical Corp. 4,7300 618.439,13 0,61<br />
USD 164.872 Cardiome Pharma Corp. 6,0000 753.700,81 0,74<br />
USD 677.744 Celera Corp. 6,3000 3.253.172,22 3,20<br />
USD 143.930 Celsion Corp. 2,1000 230.288,07 0,23<br />
USD 803.928 Cerus Corp. 2,5500 1.561.917,75 1,54<br />
USD 135.200 Concord Medical Services Holdings Ltd. ADR 7,4000 762.270,71 0,75<br />
USD 267.348 Cytokinetics Inc. 2,0875 425.210,76 0,42<br />
USD 71.500 Durect Corp. 3,5700 194.480,06 0,19<br />
USD 674.680 Dyax Corp. 2,0800 1.069.207,50 1,05<br />
USD 138.748 Endologix Inc. 7,3400 775.931,91 0,76<br />
USD 134.502 Escalon Medical Corp. 1,3000 133.221,07 0,13<br />
USD 227.734 Flamel Technologies S.A. ADR 6,9200 1.200.700,78 1,18<br />
USD 86.608 Furiex Pharmaceuticals Inc. 14,1000 930.417,66 0,92<br />
USD 45.300 Genzyme Corp. 71,1300 2.455.001,91 2,42<br />
USD 52.000 Gilead Sciences Inc. 36,4000 1.442.133,78 1,42<br />
USD 20.000 Hospira Inc. 55,5000 845.714,55 0,83<br />
USD 600.715 Immunogen Inc. 9,5000 4.348.033,74 4,28<br />
USD 1.011.300 Insmed Inc. 0,6311 486.271,72 0,48<br />
USD 417.102 Ligand Pharmaceuticals Inc. 8,9100 2.831.527,60 2,79<br />
USD 687.461 Ligand Pharmaceuticals Inc. Metabasis General CVR 0,0150 7.856,70 0,01<br />
USD 687.461 Ligand Pharmaceuticals Inc. Metabasis G<strong>lu</strong>cagon CVR 0,0180 9.428,04 0,01<br />
USD 687.461 Ligand Pharmaceuticals Inc. Metabasis Roche CVR 0,0215 11.261,27 0,01<br />
USD 687.461 Ligand Pharmaceuticals Inc. Metabasis TR Beta CVR 0,0220 11.523,16 0,01<br />
USD 101.267 Maxygen Inc. 3,9800 307.080,22 0,30<br />
USD 85.269 MediciNova Inc. 4,8600 315.739,02 0,31<br />
USD 147.000 Mylan Inc. 21,2000 2.374.400,74 2,34<br />
USD 118.814 Myrexis Inc. 4,2100 381.110,17 0,37<br />
USD 232.392 Neurocrine Biosciences Inc. 7,8100 1.382.843,49 1,36<br />
USD 529.503 NovaDel Pharma Inc. 0,1900 76.651,89 0,08<br />
USD 61.983 Omnicell Inc. 14,6900 693.737,57 0,68<br />
USD 325.590 Orthovita Inc. 2,0500 508.540,73 0,50<br />
USD 152.300 Pfizer Inc. 17,6000 2.042.271,11 2,01<br />
USD 173.700 Progenics Pharmaceuticals Inc. 5,4000 714.651,65 0,70<br />
USD 103.400 QLT Inc. 7,1600 564.071,80 0,55<br />
USD 171.000 Safeguard Scientifics Inc. 16,9600 2.209.646,40 2,17<br />
USD 123.487 Spectranetics Corp. 5,0900 478.894,50 0,47<br />
USD 393.766 Spectrum Pharmaceuticals Inc. 7,0200 2.106.086,21 2,07<br />
USD 335.007 Staar Surgical Co. 6,2300 1.590.167,06 1,56<br />
USD 132.109 Sucampo Pharmaceuticals Inc. 3,7700 379.467,49 0,37<br />
USD 1.314.803 Sunesis Pharmaceuticals Inc. 0,5350 535.938,92 0,53<br />
USD 45.818 Syneron Medical Ltd. 10,4300 364.100,49 0,36<br />
USD 521.735 Talon Therapeutics Inc. 0,4600 182.855,75 0,18<br />
14<br />
Number Price Market Va<strong>lu</strong>e %*) of<br />
Currency of Securities description in (EUR) Net Assets<br />
Shares Currency 31.12.2010
<strong>FCP</strong> <strong>OP</strong> <strong>MEDICAL</strong> <strong>BioHealth</strong>-<strong>Trends</strong> / Annual Report as of December 31, 2010<br />
STATEMENT OF ASSETS AND LIABILITIES AS OF 31.12.2010<br />
USD 49.500 Teva Pharmaceutical Industries Ltd. ADR 52,0400 1.962.652,04 1,93<br />
USD 274.900 Titan Pharmaceuticals Inc. 1,2400 259.715,13 0,26<br />
USD 147.000 Vanda Pharmaceuticals Inc. 9,3500 1.047.200,33 1,03<br />
USD 54.719 World Heart Corp. 2,3000 95.888,56 0,09<br />
USD 314.167 YM Biosciences Inc. 2,2500 538.572,17 0,53<br />
USD 287.468 ZI<strong>OP</strong>HARM Oncology Inc. 4,7500 1.040.360,71 1,02<br />
Total Shares 95.744.686,75 94,19<br />
Non-listed securities<br />
Number Price Market Va<strong>lu</strong>e %*) of<br />
Currency of Securities description in (EUR) Net Assets<br />
Shares Currency 31.12.2010<br />
EUR 83.352 BioM AG - Private Placement 1,5000 125.028,00 0,12<br />
EUR 716 Eurofins Scientific S.A. 14,2800 10.224,48 0,01<br />
WTS Call 29.06.17 Eurofins Scientific EUR 40,00<br />
EUR 4.764 NOXXON Pharma AG - Private Placement 330,2600 1.573.358,64 1,55<br />
EUR 950 NOXXON Pharma AG - Private Placement -B- 330,2600 313.747,00 0,31<br />
USD 105.264 Cerus Corp. 0,0000 0,00 0,00<br />
WTS Call 16.11.15 USD 3,20 - Registered<br />
USD 68.494 EpiCept Corp. 0,0000 0,00 0,00<br />
WTS Call 22.06.12 USD 4,41 - Restricted<br />
USD 300.000 Indevus-Nebido CSR 0,0000 0,00 0,00<br />
USD 300.000 Indevus-Octreotide Endo CSR 0,4900 112.000,04 0,11<br />
USD 461.391 Indevus-Octreotide Valera CSR 0,7400 260.136,72 0,26<br />
USD 461.391 Indevus-Stent CSR 0,0000 0,00 0,00<br />
USD 433.177 Innovive Pharmaceuticals Inc. 0,0000 0,00 0,00<br />
Escrow (American Stock Transfer)<br />
USD 67.000 Innovive Pharmaceuticals Inc. Escrow (DTC) 0,0000 0,00 0,00<br />
USD 128.205 Innovive Pharmaceuticals Inc. 0,0000 0,00 0,00<br />
WTS Call 24.04.12 USD 3,75 - Restricted<br />
USD 227.600 Ligand Pharmaceuticals Inc. CVR (Pharmacopeia) 0,0000 0,00 0,00<br />
USD 1.921.413 Neurogen Corp. CVR H3 0,0000 0,00 0,00<br />
USD 1.921.413 Neurogen Corp. CVR Merck 0,0000 0,00 0,00<br />
USD 49.655 NovaDel Pharma Inc. 0,0000 0,00 0,00<br />
WTS Call 19.04.11 USD 1,60 - Restricted<br />
USD 500.000 Tikvah Therapeutics Inc. 07-09 Conv. 0,0000 0,00 0,00<br />
USD 351.220 World Heart Corp. - Restricted 1,8860 504.686,57 0,50<br />
USD 351.220 World Heart Corp. 0,0000 0,00 0,00<br />
WTS Call 19.10.15 USD 2,31 - Restricted<br />
USD 208.334 YM Biosciences Inc. 0,6500 103.174,97 0,10<br />
WTS Call 10.03.15 USD 1,60 - Registered<br />
USD 51.836 ZI<strong>OP</strong>HARM Oncology Inc. 0,0000 0,00 0,00<br />
WTS Call 03.05.11 USD 5,56 - Restricted<br />
USD 80.500 ZI<strong>OP</strong>HARM Oncology Inc. 0,4925 30.206,68 0,03<br />
WTS Call 09.12.14 USD 4,02 - Restricted<br />
15
<strong>FCP</strong> <strong>OP</strong> <strong>MEDICAL</strong> <strong>BioHealth</strong>-<strong>Trends</strong> / Annual Report as of December 31, 2010<br />
STATEMENT OF ASSETS AND LIABILITIES AS OF 31.12.2010<br />
USD 38.278 ZI<strong>OP</strong>HARM Oncology Inc. 0,0000 0,00 0,00<br />
16<br />
WTS Call 23.02.12 USD 5,75 - Restricted<br />
Total Non-listed Securities 3.032.563,10 2,98<br />
Total Investment Portfolio 98.777.249,85 97,18<br />
Bank Deposits 3.333.312,46 3,28<br />
Other Assets<br />
Interests receivable 76.190,50 0,07<br />
Dividends receivable 34.778,34 0,03<br />
Receivables from subscriptions 46.811,78 0,05<br />
Total Other Assets 157.780,62 0,16<br />
Liabilities<br />
Number Price Market Va<strong>lu</strong>e %*) of<br />
Currency of Securities description in (EUR) Net Assets<br />
Shares Currency 31.12.2010<br />
Taxe d'Abonnement -9.035,00 -0,01<br />
Liabilities from purchase of investments -27.147,36 -0,03<br />
Liabilities from redemptions -14.474,69 -0,01<br />
Liabilities from foreign forward exchange transactions -554.464,64 -0,55<br />
Other liabilities -16.000,00 -0,02<br />
Total Liabilities -621.121,69 -0,61<br />
Total Net Assets 101.647.221,24 100,00<br />
Net asset va<strong>lu</strong>e Unit Class EUR 138,77<br />
Number of units outstanding Unit Class EUR 370.450<br />
Net asset va<strong>lu</strong>e Unit Class EUR H 141,07<br />
Number of units outstanding Unit Class EUR H 101.580<br />
Net asset va<strong>lu</strong>e Unit Class I 141,65<br />
Number of units outstanding Unit Class I 209.358<br />
Net asset va<strong>lu</strong>e Unit Class I H 150,60<br />
Number of units outstanding Unit Class I H 41.538<br />
*) The rounding down of the percentage in the calculation can result in marginal rounding differences.
<strong>FCP</strong> <strong>OP</strong> <strong>MEDICAL</strong> <strong>BioHealth</strong>-<strong>Trends</strong> / Annual Report as of December 31, 2010<br />
Notes to the Annual Report<br />
The Management Company may assign other companies of<br />
the Oppenheim group with the management of the funds or<br />
with duties of the central administration in accordance with<br />
Luxembourg regulations and under its own responsibility<br />
and its own costs.<br />
The financial statements have been prepared in accordance<br />
with Luxembourg regulations relating to investment funds.<br />
The market va<strong>lu</strong>e of the securities corresponds to the most<br />
recent market or fair va<strong>lu</strong>e available. Non-listed securities<br />
are va<strong>lu</strong>ed at their acquisition costs or fair market va<strong>lu</strong>e.<br />
The cost of securities is the weighted average cost of all the<br />
purchases of these securities. For securities that are priced in<br />
a currency other than the Fund’s currency, the average cost<br />
is calculated with the exchange rate of the purchase date.<br />
The net realized profit and loss on sales of securities is<br />
determined on the basis of the average cost of securities<br />
sold.<br />
Unrealized profits and losses resulting from the va<strong>lu</strong>ation of<br />
securities are taken into account in the result.<br />
All liquid assets are va<strong>lu</strong>ed at their nominal va<strong>lu</strong>e.<br />
The Fund maintains its books and records in EUR.<br />
All assets and liabilities not expressed in EUR are converted<br />
into EUR at the exchange rates prevailing as of December<br />
29, 2010.<br />
Australian Dollar AUD 1,295800 = EUR 1<br />
Canadian Dollar CAD 1,310901 = EUR 1<br />
Swiss Franc CHF 1,247100 = EUR 1<br />
Danish Krone DKK 7,452900 = EUR 1<br />
British Pound GBP 0,852100 = EUR 1<br />
Norwegian Krone NOK 7,816800 = EUR 1<br />
Swedish Krona SEK 8,974700 = EUR 1<br />
US-Dollar USD 1,312501 = EUR 1<br />
Outstanding foreign forward exchange contracts are va<strong>lu</strong>ed<br />
at the foreign forward exchange rate for the remaining<br />
period of the transaction. The unrealized profits and losses<br />
are taken into account in the financial statements.<br />
Foreign Unrealized<br />
Maturity Forward Profit/Loss<br />
Sale Date Purchase Exchange Rate (EUR)<br />
EUR 441.338,73 14.02.11 USD 600.000,00 1,312460 15.817,59<br />
USD 18.970.000,00 14.02.11 EUR 13.883.474,72 0,761927 -570.282,23<br />
-554.464,64<br />
As with the payment for the custodian bank (up to 0,15 %<br />
p.a.), the renumeration of the management company (up to<br />
1,90 % p.a.) is computed on the basis of the daily Net Asset<br />
Va<strong>lu</strong>e calculation. These are calculated and paid at the end<br />
of each month. During the reporting period the management<br />
company received a management fee amounting to EUR<br />
1.463.649,55 and the custodian bank received a custodian<br />
bank fee amounting to EUR 145.024,50.<br />
A trailer fee will be paid to the distributor for the<br />
distribution of the investment fund and to the asset manager<br />
to be taken out of the management fee.<br />
Institutional unitholders who are holding fund units for third<br />
parties receive reimbursement out of the management fee.<br />
The investment advisor receives a performance bonus.<br />
Where it is payable, the performance bonus is equivalent to<br />
15 % (for Unit Class EUR and EUR H) and 10 % (for Unit<br />
Class I and I H) of the excess increase in va<strong>lu</strong>e relative to<br />
the net asset va<strong>lu</strong>e per unit and half year. The term „excess<br />
increase in va<strong>lu</strong>e“ refers to the appreciation per half year<br />
which exceeds 2,5 % – adjusted by earlier dividends paid<br />
and broken financial years. The performance bonus is<br />
calculated on each day of calculation and deferred<br />
accordingly; it is only paid if the net asset va<strong>lu</strong>e per unit as<br />
at the half year-end – compared with the high at the end of<br />
the previous half year – records a new high („high water<br />
mark“), and only then on the new excess increase in va<strong>lu</strong>e<br />
that is above the stated high of the net asset va<strong>lu</strong>e per unit at<br />
the end of a previous half year. The net asset va<strong>lu</strong>e per unit<br />
is adjusted by dividends paid.<br />
17
<strong>FCP</strong> <strong>OP</strong> <strong>MEDICAL</strong> <strong>BioHealth</strong>-<strong>Trends</strong> / Annual Report as of December 31, 2010<br />
The Total Expense Ratio (TER) indicates the costs on the<br />
Fund’s total assets for the period from January 1, 2010 to<br />
December 31, 2010. With the exception of the transaction<br />
costs and the performance bonus, all costs of the fund are<br />
shown in relation to the average total fund assets.<br />
In accordance with the Swiss Funds Association (SFA)<br />
method the following TER-va<strong>lu</strong>es arise:<br />
TER incl. performance bonus TER (in %)<br />
Unit Class EUR 4,05<br />
Unit Class EUR H 4,40<br />
Unit Class I 3,67<br />
Unit Class I H 3,09<br />
TER excl. performance bonus TER (in %)<br />
Unit Class EUR 2,13<br />
Unit Class EUR H 2,15<br />
Unit Class I 1,73<br />
Unit Class I H 1,59<br />
In accordance with the Swiss Funds Association (SFA) the<br />
Portfolio Turnover Rate (PTR) for the period from<br />
January 1, 2010 to December 31, 2010 amounts to 1,24.<br />
Under Luxembourg legislation and regulations, the Fund is<br />
subject to an annual subscription tax („Taxe<br />
d’Abonnement“) of 0,05 % p.a. for Unit Class EUR and<br />
EUR H and of 0,01 % for Unit Class I and I H on its net<br />
assets, payable quarterly and computed on the basis of the<br />
net assets of the Fund at the end of each quarter.<br />
An income adjustment is made in the taxable income; it<br />
inc<strong>lu</strong>des net income accrued during the accounting period<br />
which the buyer of the unit pays in the issue price and which<br />
the seller of the unit receives by way of reimbursement in<br />
the bid price.<br />
The name of the sub-fund <strong>FCP</strong> <strong>OP</strong> <strong>MEDICAL</strong> BioHe@lth-<br />
<strong>Trends</strong> changed with effect 15 November, 2010 to <strong>FCP</strong> <strong>OP</strong><br />
<strong>MEDICAL</strong> <strong>BioHealth</strong>-<strong>Trends</strong>.<br />
Due to the fact that <strong>FCP</strong> <strong>OP</strong> <strong>MEDICAL</strong> only consists of one<br />
sub-fund, the <strong>FCP</strong> <strong>OP</strong> <strong>MEDICAL</strong> <strong>BioHealth</strong>-<strong>Trends</strong>, as of<br />
December 31, 2010, the composition of the Total Net Assets,<br />
the Changes in Net Assets and the Statement of Operations<br />
of the <strong>FCP</strong> <strong>OP</strong> <strong>MEDICAL</strong> <strong>BioHealth</strong>-<strong>Trends</strong> corresponds at<br />
the same time to the consolidated statements of<br />
<strong>FCP</strong> <strong>OP</strong> <strong>MEDICAL</strong>.<br />
18
<strong>FCP</strong> <strong>OP</strong> <strong>MEDICAL</strong> <strong>BioHealth</strong>-<strong>Trends</strong> / Annual Report as of December 31, 2010<br />
Report of the Réviseur d’Entreprises agréé<br />
Report on the financial statements<br />
Following our appointment by the Board of Directors of the<br />
Management Company, we have audited the accompanying<br />
financial statements of <strong>FCP</strong> <strong>OP</strong> <strong>MEDICAL</strong> and each of its<br />
sub-funds, which comprise the statement of net assets and<br />
the statement of investments and other net assets as at<br />
December 31, 2010 and the statement of operations and the<br />
statement of changes in net assets for the year then ended,<br />
and a summary of significant accounting policies and other<br />
explanatory information.<br />
Board of Directors of the Management Company<br />
responsibility for the financial statements<br />
The Board of Directors of the Management Company is<br />
responsible for the preparation and fair presentation of these<br />
financial statements in accordance with Luxembourg legal<br />
and regulatory requirements relating to the preparation of the<br />
financial statements, and for such internal control as the<br />
Board of Directors of the Management Company determines<br />
is necessary to enable the preparation of financial statements<br />
that are free from material misstatement, whether due to<br />
fraud or error.<br />
Responsibility of the Réviseur d’Entreprises agréé<br />
Our responsibility is to express an opinion on these financial<br />
statements based on our audit. We conducted our audit in<br />
accordance with International Standards on Auditing as<br />
adopted for Luxembourg by the Commission de Surveillance<br />
du Secteur Financier. Those standards require that we<br />
comply with ethical requirements and plan and perform the<br />
audit to obtain reasonable assurance about whether the<br />
financial statements are free from material misstatement.<br />
An audit involves performing procedures to obtain audit<br />
evidence about the amounts and disclosures in the financial<br />
statements. The procedures selected depend on the<br />
judgement of the Réviseur d’Entreprises agréé, inc<strong>lu</strong>ding the<br />
assessment of the risks of material misstatement of the<br />
financial statements, whether due to fraud or error. In<br />
making those risk assessments, the Réviseur d’Entreprises<br />
agréé considers internal control relevant to the entity’s<br />
preparation and fair presentation of the financial statements<br />
in order to design audit procedures that are appropriate in<br />
the circumstances, but not for the purpose of expressing an<br />
opinion on the effectiveness of the entity’s internal control.<br />
An audit also inc<strong>lu</strong>des eva<strong>lu</strong>ating the appropriateness of<br />
accounting policies used and the reasonableness of<br />
accounting estimates made by the Board of Directors of the<br />
Management Company, as well as eva<strong>lu</strong>ating the overall<br />
presentation of the financial statements.<br />
We believe that the audit evidence we have obtained is<br />
sufficient and appropriate to provide a basis for our audit<br />
opinion.<br />
Opinion<br />
In our opinion, the financial statements give a true and fair<br />
view of the financial position of <strong>FCP</strong> <strong>OP</strong> <strong>MEDICAL</strong> and<br />
each of its sub-funds as of December 31, 2010, and of the<br />
results of its operations and changes in its net assets for the<br />
year then ended in accordance with Luxembourg legal and<br />
regulatory requirements relating to the preparation of the<br />
financial statements.<br />
Other matter<br />
Supplementary information inc<strong>lu</strong>ded in the annual report has<br />
been reviewed in the context of our mandate but has not<br />
been subject to specific audit procedures carried out in<br />
accordance with the standards described above.<br />
Consequently, we express no opinion on such information.<br />
However, we have no observation to make concerning such<br />
information in the context of the financial statements taken<br />
as a whole.<br />
Luxembourg, March 29, 2011<br />
KPMG Audit S.à r.l.<br />
Cabinet de révision agréé<br />
Petra Schreiner<br />
19
<strong>FCP</strong> <strong>OP</strong> <strong>MEDICAL</strong> <strong>BioHealth</strong>-<strong>Trends</strong> / Annual Report as of December 31, 2010<br />
Tax information for German investors for the financial year ended as of 31.12.2010 in EUR per unit<br />
<strong>FCP</strong> <strong>OP</strong> <strong>MEDICAL</strong> BioHe@lth-<strong>Trends</strong> (EUR) for private for corporate for corporate investors<br />
LU0119891520 investors investors according according to Corporate<br />
InvTA section 5 art. 1 to Income Tax Act Income Tax Act<br />
No. 1 a) the amount of the distribution 0,0000 0,0000 0,0000<br />
20<br />
components inc<strong>lu</strong>ded in the amount of the distribution<br />
the deemed distributed income from previous years<br />
separated to specific financial years 0,0000 0,0000 0,0000<br />
the amount of substance distribution 0,0000 0,0000 0,0000<br />
No. 1 b) the amount of distributed income 0,0000 0,0000 0,0000<br />
No. 1 b) the amount of deemed distribution 0,0000 0,0000 0,0000<br />
therefrom non-deductible income-related expenses 0,0000 0,0000 0,0000<br />
as defined in sec. 3 art. 3 sent. 2 no. 2 InvTA<br />
No. 1 c) the following components inc<strong>lu</strong>ded in the distribution / deemed distributed income<br />
bb) tax-exempt capital gains as defined 0,0000 - -<br />
in sec. 2 art. 3 no. 1, sent. 1, InvTA<br />
to apply in the frame of December 31, 2008<br />
cc) income as defined in sec. 3 no. 40, Income TA - 0,0000 -<br />
dd) income as defined in sec. 8b, Corporate Income TA - - 0,0000<br />
ee) capital gains as defined in sec. 3 no. 40, Income TA - 0,0000 -<br />
ff) capital gains as defined in sec. 8b art. 2, - - 0,0000<br />
Corporate Income TA<br />
gg) income as defined in sec. 2 art. 3 no.1, sent. 2, InvTA 0,0000 0,0000 0,0000<br />
hh) tax-exempt capital gains as defined in 0,0000 0,0000 0,0000<br />
sec. 2 art. 3 no. 2, InvTA<br />
ii) income as defined in sec. 4 art. 1, InvTA 0,0000 0,0000 0,0000<br />
jj) income as defined in sec. 4 art. 2, InvTA (dividends) 0,0000 0,0000 0,0000<br />
jj) income as defined in sec. 4 art. 2, InvTA (interest) 0,0000 0,0000 0,0000<br />
kk) income as defined in sec. 4 art. 2 InvTA (dividends) 0,0000 0,0000 0,0000<br />
kk) income as defined in sec. 4 art. 2 InvTA (interest) 0,0000 0,0000 0,0000<br />
ll) income as defined in sec. 2 art. 2a InvTA - 0,0000 0,0000<br />
(Barrier Regulation)<br />
No. 1 d) the amount of the distributed income, which gives rise to a credit or refund of German withholding tax<br />
as defined in sec. 7 art. 1 to 3 InvTA 0,0000 0,0000 0,0000<br />
No. 1 e) the amount of the German withholding tax, which may credited or refunded<br />
as defined in sec. 7 art. 1 to 3 InvTA 0,0000 0,0000 0,0000<br />
No. 1 f) the amount of foreign withholding taxes on income, which is inc<strong>lu</strong>ded<br />
in the distributed income and deemed distributed income as defined in sec. 4 art. 2, InvTA and<br />
aa) which may be credited pursuant to sec. 34c art. 1, 0,0000 0,0000 0,0000<br />
Income TA (Withholding Tax dividends)<br />
aa) which may be credited pursuant to sec. 34c art. 1, 0,0000 0,0000 0,0000<br />
Income TA (Withholding Tax interests)<br />
bb) which is deductible pursuant to sec. 34c art. 3, 0,0000 0,0000 0,0000<br />
Income TA (WithholdingTax)<br />
cc) fictitious foreign withholding tax amount (dividends) 0,0000 0,0000 0,0000<br />
cc) fictitious foreign withholding tax amount (interest) 0,0000 0,0000 0,0000<br />
No. 1 g) as defined in sec. 3 art. 3 sent. 1 InvTA 0,0000 0,0000 0,0000<br />
Depreciation deduction<br />
For the purposes disclosing tax information, KPMG Audit S.à r.l.,Cabinet de révision agréé, Luxembourg, have certified, in accordance with sec. 5 art. 1 no. 3 of the<br />
investment tax law, that the disclosure (translated from the certified German version) has been made as set down in sec. 5 art.1 no.1 and 2 of the investment tax law.
<strong>FCP</strong> <strong>OP</strong> <strong>MEDICAL</strong> <strong>BioHealth</strong>-<strong>Trends</strong> / Annual Report as of December 31, 2010<br />
Tax information for German investors for the financial year ended as of 31.12.2010 in EUR per unit<br />
<strong>FCP</strong> <strong>OP</strong> <strong>MEDICAL</strong> BioHe@lth-<strong>Trends</strong> (EUR H) for private for corporate for corporate investors<br />
LU0228344361 investors investors according according to Corporate<br />
InvTA section 5 art. 1 to Income Tax Act Income Tax Act<br />
No. 1 a) the amount of the distribution 0,0000 0,0000 0,0000<br />
components inc<strong>lu</strong>ded in the amount of the distribution<br />
the deemed distributed income from previous years<br />
separated to specific financial years 0,0000 0,0000 0,0000<br />
the amount of substance distribution 0,0000 0,0000 0,0000<br />
No. 1 b) the amount of distributed income 0,0000 0,0000 0,0000<br />
No. 1 b) the amount of deemed distribution 0,0000 0,0000 0,0000<br />
therefrom non-deductible income-related expenses 0,0000 0,0000 0,0000<br />
as defined in sec. 3 art. 3 sent. 2 no. 2 InvTA<br />
No. 1 c) the following components inc<strong>lu</strong>ded in the distribution / deemed distributed income<br />
bb) tax-exempt capital gains as defined 0,0000 - -<br />
in sec. 2 art. 3 no. 1, sent. 1, InvTA<br />
to apply in the frame of December 31, 2008<br />
cc) income as defined in sec. 3 no. 40, Income TA - 0,0000 -<br />
dd) income as defined in sec. 8b, Corporate Income TA - - 0,0000<br />
ee) capital gains as defined in sec. 3 no. 40, Income TA - 0,0000 -<br />
ff) capital gains as defined in sec. 8b art. 2, - - 0,0000<br />
Corporate Income TA<br />
gg) income as defined in sec. 2 art. 3 no.1, sent. 2, InvTA 0,0000 0,0000 0,0000<br />
hh) tax-exempt capital gains as defined in 0,0000 0,0000 0,0000<br />
sec. 2 art. 3 no. 2, InvTA<br />
ii) income as defined in sec. 4 art. 1, InvTA 0,0000 0,0000 0,0000<br />
jj) income as defined in sec. 4 art. 2, InvTA (dividends) 0,0000 0,0000 0,0000<br />
jj) income as defined in sec. 4 art. 2, InvTA (interest) 0,0000 0,0000 0,0000<br />
kk) income as defined in sec. 4 art. 2 InvTA (dividends) 0,0000 0,0000 0,0000<br />
kk) income as defined in sec. 4 art. 2 InvTA (interest) 0,0000 0,0000 0,0000<br />
ll) income as defined in sec. 2 art. 2a InvTA - 0,0000 0,0000<br />
(Barrier Regulation)<br />
No. 1 d) the amount of the distributed income, which gives rise to a credit or refund of German withholding tax<br />
as defined in sec. 7 art. 1 to 3 InvTA 0,0000 0,0000 0,0000<br />
No. 1 e) the amount of the German withholding tax, which may credited or refunded<br />
as defined in sec. 7 art. 1 to 3 InvTA 0,0000 0,0000 0,0000<br />
No. 1 f) the amount of foreign withholding taxes on income, which is inc<strong>lu</strong>ded<br />
in the distributed income and deemed distributed income as defined in sec. 4 art. 2, InvTA and<br />
aa) which may be credited pursuant to sec. 34c art. 1, 0,0000 0,0000 0,0000<br />
Income TA (Withholding Tax dividends)<br />
aa) which may be credited pursuant to sec. 34c art. 1, 0,0000 0,0000 0,0000<br />
Income TA (Withholding Tax interests)<br />
bb) which is deductible pursuant to sec. 34c art. 3, 0,0000 0,0000 0,0000<br />
Income TA (WithholdingTax)<br />
cc) fictitious foreign withholding tax amount (dividends) 0,0000 0,0000 0,0000<br />
cc) fictitious foreign withholding tax amount (interest) 0,0000 0,0000 0,0000<br />
No. 1 g) as defined in sec. 3 art. 3 sent. 1 InvTA 0,0000 0,0000 0,0000<br />
Depreciation deduction<br />
For the purposes disclosing tax information, KPMG Audit S.à r.l.,Cabinet de révision agréé, Luxembourg, have certified, in accordance with sec. 5 art. 1 no. 3 of the<br />
investment tax law, that the disclosure (translated from the certified German version) has been made as set down in sec. 5 art.1 no.1 and 2 of the investment tax law.<br />
21
<strong>FCP</strong> <strong>OP</strong> <strong>MEDICAL</strong> <strong>BioHealth</strong>-<strong>Trends</strong> / Annual Report as of December 31, 2010<br />
Tax information for German investors for the financial year ended as of 31.12.2010 in EUR per unit<br />
<strong>FCP</strong> <strong>OP</strong> <strong>MEDICAL</strong> BioHe@lth-<strong>Trends</strong> (I) for private for corporate for corporate investors<br />
LU0294851513 investors investors according according to Corporate<br />
InvTA section 5 art. 1 to Income Tax Act Income Tax Act<br />
No. 1 a) the amount of the distribution 0,0000 0,0000 0,0000<br />
22<br />
components inc<strong>lu</strong>ded in the amount of the distribution<br />
the deemed distributed income from previous years<br />
separated to specific financial years 0,0000 0,0000 0,0000<br />
the amount of substance distribution 0,0000 0,0000 0,0000<br />
No. 1 b) the amount of distributed income 0,0000 0,0000 0,0000<br />
No. 1 b) the amount of deemed distribution 0,0000 0,0000 0,0000<br />
therefrom non-deductible income-related expenses 0,0000 0,0000 0,0000<br />
as defined in sec. 3 art. 3 sent. 2 no. 2 InvTA<br />
No. 1 c) the following components inc<strong>lu</strong>ded in the distribution / deemed distributed income<br />
bb) tax-exempt capital gains as defined 0,0000 - -<br />
in sec. 2 art. 3 no. 1, sent. 1, InvTA<br />
to apply in the frame of December 31, 2008<br />
cc) income as defined in sec. 3 no. 40, Income TA - 0,0000 -<br />
dd) income as defined in sec. 8b, Corporate Income TA - - 0,0000<br />
ee) capital gains as defined in sec. 3 no. 40, Income TA - 0,0000 -<br />
ff) capital gains as defined in sec. 8b art. 2, - - 0,0000<br />
Corporate Income TA<br />
gg) income as defined in sec. 2 art. 3 no.1, sent. 2, InvTA 0,0000 0,0000 0,0000<br />
hh) tax-exempt capital gains as defined in 0,0000 0,0000 0,0000<br />
sec. 2 art. 3 no. 2, InvTA<br />
ii) income as defined in sec. 4 art. 1, InvTA 0,0000 0,0000 0,0000<br />
jj) income as defined in sec. 4 art. 2, InvTA (dividends) 0,0000 0,0000 0,0000<br />
jj) income as defined in sec. 4 art. 2, InvTA (interest) 0,0000 0,0000 0,0000<br />
kk) income as defined in sec. 4 art. 2 InvTA (dividends) 0,0000 0,0000 0,0000<br />
kk) income as defined in sec. 4 art. 2 InvTA (interest) 0,0000 0,0000 0,0000<br />
ll) income as defined in sec. 2 art. 2a InvTA - 0,0000 0,0000<br />
(Barrier Regulation)<br />
No. 1 d) the amount of the distributed income, which gives rise to a credit or refund of German withholding tax<br />
as defined in sec. 7 art. 1 to 3 InvTA 0,0000 0,0000 0,0000<br />
No. 1 e) the amount of the German withholding tax, which may credited or refunded<br />
as defined in sec. 7 art. 1 to 3 InvTA 0,0000 0,0000 0,0000<br />
No. 1 f) the amount of foreign withholding taxes on income, which is inc<strong>lu</strong>ded<br />
in the distributed income and deemed distributed income as defined in sec. 4 art. 2, InvTA and<br />
aa) which may be credited pursuant to sec. 34c art. 1, 0,0000 0,0000 0,0000<br />
Income TA (Withholding Tax dividends)<br />
aa) which may be credited pursuant to sec. 34c art. 1, 0,0000 0,0000 0,0000<br />
Income TA (Withholding Tax interests)<br />
bb) which is deductible pursuant to sec. 34c art. 3, 0,0000 0,0000 0,0000<br />
Income TA (WithholdingTax)<br />
cc) fictitious foreign withholding tax amount (dividends) 0,0000 0,0000 0,0000<br />
cc) fictitious foreign withholding tax amount (interest) 0,0000 0,0000 0,0000<br />
No. 1 g) as defined in sec. 3 art. 3 sent. 1 InvTA 0,0000 0,0000 0,0000<br />
Depreciation deduction<br />
For the purposes disclosing tax information, KPMG Audit S.à r.l.,Cabinet de révision agréé, Luxembourg, have certified, in accordance with sec. 5 art. 1 no. 3 of the<br />
investment tax law, that the disclosure (translated from the certified German version) has been made as set down in sec. 5 art.1 no.1 and 2 of the investment tax law.
<strong>FCP</strong> <strong>OP</strong> <strong>MEDICAL</strong> <strong>BioHealth</strong>-<strong>Trends</strong> / Annual Report as of December 31, 2010<br />
Tax information for German investors for the financial year ended as of 31.12.2010 in EUR per unit<br />
<strong>FCP</strong> <strong>OP</strong> <strong>MEDICAL</strong> BioHe@lth-<strong>Trends</strong> (I H) for private for corporate for corporate investors<br />
LU0295354772 investors investors according according to Corporate<br />
InvTA section 5 art. 1 to Income Tax Act Income Tax Act<br />
No. 1 a) the amount of the distribution 0,0000 0,0000 0,0000<br />
components inc<strong>lu</strong>ded in the amount of the distribution<br />
the deemed distributed income from previous years<br />
separated to specific financial years 0,0000 0,0000 0,0000<br />
the amount of substance distribution 0,0000 0,0000 0,0000<br />
No. 1 b) the amount of distributed income 0,0000 0,0000 0,0000<br />
No. 1 b) the amount of deemed distribution 0,0000 0,0000 0,0000<br />
therefrom non-deductible income-related expenses 0,0000 0,0000 0,0000<br />
as defined in sec. 3 art. 3 sent. 2 no. 2 InvTA<br />
No. 1 c) the following components inc<strong>lu</strong>ded in the distribution / deemed distributed income<br />
bb) tax-exempt capital gains as defined 0,0000 - -<br />
in sec. 2 art. 3 no. 1, sent. 1, InvTA<br />
to apply in the frame of December 31, 2008<br />
cc) income as defined in sec. 3 no. 40, Income TA - 0,0000 -<br />
dd) income as defined in sec. 8b, Corporate Income TA - - 0,0000<br />
ee) capital gains as defined in sec. 3 no. 40, Income TA - 0,0000 -<br />
ff) capital gains as defined in sec. 8b art. 2, - - 0,0000<br />
Corporate Income TA<br />
gg) income as defined in sec. 2 art. 3 no.1, sent. 2, InvTA 0,0000 0,0000 0,0000<br />
hh) tax-exempt capital gains as defined in 0,0000 0,0000 0,0000<br />
sec. 2 art. 3 no. 2, InvTA<br />
ii) income as defined in sec. 4 art. 1, InvTA 0,0000 0,0000 0,0000<br />
jj) income as defined in sec. 4 art. 2, InvTA (dividends) 0,0000 0,0000 0,0000<br />
jj) income as defined in sec. 4 art. 2, InvTA (interest) 0,0000 0,0000 0,0000<br />
kk) income as defined in sec. 4 art. 2 InvTA (dividends) 0,0000 0,0000 0,0000<br />
kk) income as defined in sec. 4 art. 2 InvTA (interest) 0,0000 0,0000 0,0000<br />
ll) income as defined in sec. 2 art. 2a InvTA - 0,0000 0,0000<br />
(Barrier Regulation)<br />
No. 1 d) the amount of the distributed income, which gives rise to a credit or refund of German withholding tax<br />
as defined in sec. 7 art. 1 to 3 InvTA 0,0000 0,0000 0,0000<br />
No. 1 e) the amount of the German withholding tax, which may credited or refunded<br />
as defined in sec. 7 art. 1 to 3 InvTA 0,0000 0,0000 0,0000<br />
No. 1 f) the amount of foreign withholding taxes on income, which is inc<strong>lu</strong>ded<br />
in the distributed income and deemed distributed income as defined in sec. 4 art. 2, InvTA and<br />
aa) which may be credited pursuant to sec. 34c art. 1, 0,0000 0,0000 0,0000<br />
Income TA (Withholding Tax dividends)<br />
aa) which may be credited pursuant to sec. 34c art. 1, 0,0000 0,0000 0,0000<br />
Income TA (Withholding Tax interests)<br />
bb) which is deductible pursuant to sec. 34c art. 3, 0,0000 0,0000 0,0000<br />
Income TA (WithholdingTax)<br />
cc) fictitious foreign withholding tax amount (dividends) 0,0000 0,0000 0,0000<br />
cc) fictitious foreign withholding tax amount (interest) 0,0000 0,0000 0,0000<br />
No. 1 g) as defined in sec. 3 art. 3 sent. 1 InvTA 0,0000 0,0000 0,0000<br />
Depreciation deduction<br />
For the purposes disclosing tax information, KPMG Audit S.à r.l.,Cabinet de révision agréé, Luxembourg, have certified, in accordance with sec. 5 art. 1 no. 3 of the<br />
investment tax law, that the disclosure (translated from the certified German version) has been made as set down in sec. 5 art.1 no.1 and 2 of the investment tax law.<br />
23
<strong>FCP</strong> <strong>OP</strong> <strong>MEDICAL</strong> <strong>BioHealth</strong>-<strong>Trends</strong> / Annual Report as of December 31, 2010<br />
24<br />
Partners<br />
MANAGEMENT COMPANY AND CENTRAL ADMINISTRATION:<br />
Oppenheim Asset Management Services S.à r.l.<br />
4, rue Jean Monnet, L-2180 Luxembourg<br />
Shareholders’ equity: EUR 2,7 million<br />
(status: January 1, 2011)<br />
BOARD OF DIRECTORS:<br />
Chairman:<br />
Dr. Wolfgang Leoni (since 17.03.2010)<br />
Member of the Board<br />
Sal. Oppenheim jr. & Cie. Komplementär AG, Cologne<br />
Vice chairman:<br />
Detlef Bierbaum<br />
Bankier, Cologne<br />
Jürgen Fiedler (since 01.07.2010)<br />
Member of the Board<br />
Sal. Oppenheim jr. & Cie. Komplementär AG, Cologne<br />
Dr. Jörn Matthias Häuser (since 01.07.2010)<br />
Chief Operating Officer<br />
Sal. Oppenheim jr. & Cie. Komplementär AG, Cologne<br />
Dr. Rupert Hengster (until 17.03.2010)<br />
Spokesman of the Board<br />
Oppenheim Kapitalanlagegesellschaft mbH, Cologne<br />
Alfons Klein (since 17.03.2010)<br />
Member of the Board<br />
Sal. Oppenheim jr. & Cie. Komplementär S.A., Luxembourg<br />
Christopher Freiherr von Oppenheim (until 17.03.2010)<br />
Personally Liable Partner<br />
Sal. Oppenheim jr. & Cie. S.C.A., Luxembourg<br />
Dr. Holger Michael Sepp (until 30.06.2010)<br />
Member of the Board<br />
Oppenheim Kapitalanlagegesellschaft mbH, Cologne<br />
EXECUTIVE BOARD:<br />
Marco Schmitz, Chairman<br />
Andreas Jockel<br />
Dr. Andreas Schmidt-von Rhein<br />
Max von Frantzius (since 01.07.2010)<br />
Anita Zuleger (until 30.04.2010)<br />
CUSTODIAN BANK:<br />
Sal. Oppenheim jr. & Cie. Luxembourg S.A.<br />
4, rue Jean Monnet, L-2180 Luxembourg<br />
Shareholders’ equity: EUR 50 million<br />
(status: January 1, 2011)<br />
AUDITOR:<br />
KPMG Audit S.à r.l.<br />
9, Allée Scheffer, L-2520 Luxembourg<br />
INVESTMENT ADVISOR:<br />
Medical Strategy GmbH<br />
Maria-Eich-Strasse 72, D-82166 Gräfelfing<br />
Further office: Piechlerstrasse 3-5, D-86356 Neusäß<br />
(Financial service institute as defined<br />
by § 1 Abs. 1a KWG [German Banking Act])<br />
http://www.<strong>medical</strong>strategy.de<br />
SCIENTIFIC ADVISORY BOARD:<br />
Prof. Dr. med. Peter Hohenberger<br />
Surgical University Clinic Mannheim,<br />
Div. of Surgical Oncology and Thoracic Surgery<br />
Prof. Dr. Manfred Weber<br />
Head physician of the Medical Clinic I<br />
Clinics of the city of Cologne<br />
Prof. Dr. med. Thomas Zeller<br />
Head physician of angiology of the heart clinics<br />
Bad Krozingen<br />
PAYING AGENTS:<br />
in Luxembourg<br />
Sal. Oppenheim jr. & Cie. Luxembourg S.A.<br />
4, rue Jean Monnet, L-2180 Luxembourg<br />
in Germany<br />
Sal. Oppenheim jr. & Cie. AG & Co. KGaA<br />
Unter Sachsenhausen 4, D-50667 Cologne<br />
and its branches<br />
in Austria<br />
Deutsche Bank Österreich AG<br />
Head Office Vienna<br />
Stock im Eisen-Platz 3, A-1010 Vienna
<strong>FCP</strong> <strong>OP</strong> <strong>MEDICAL</strong> <strong>BioHealth</strong>-<strong>Trends</strong> / Annual Report as of December 31, 2010<br />
DISTRIBUTION:<br />
in Germany<br />
Sal. Oppenheim jr. & Cie. AG & Co. KGaA<br />
Unter Sachsenhausen 4, D-50667 Cologne<br />
and its branches<br />
MS Capital Relations GmbH<br />
Piechlerstrasse 3-5, D-86356 Neusäß<br />
(The Company holds the permission in accordance with § 34 c GewO<br />
to distribute units of the Fund.)<br />
in Austria<br />
Deutsche Bank Österreich AG<br />
Head Office Vienna<br />
Stock im Eisen-Platz 3, A-1010 Vienna<br />
TAX AGENT IN AUSTRIA:<br />
Leitner + Leitner GmbH & Co KG<br />
Auditor and tax advisor<br />
Ottensheimer Straße 30, 32, 36, A-4040 Linz<br />
ADDITIONAL INFORMATION ON THE DISTRIBUTION OF UNITS IN OR<br />
FROM SWITZERLAND:<br />
Actual Representative und Paying Agent in Switzerland:<br />
BNP Paribas Securities Services, Paris,<br />
succursale de Zurich<br />
Selnaustrasse 16<br />
CH-8002 Zurich<br />
The offering prospectuses, management regulations as well<br />
as annual, semi-annual and interim reports of the fund are<br />
available free of charge at BNP Paribas Securities Services,<br />
Paris, succursale de Zurich, Zurich.<br />
25
Oppenheim Asset Management Services S.à r.l.<br />
4, rue Jean Monnet 2180 Luxembourg<br />
Luxembourg<br />
Oppenheim Fonds Trust GmbH<br />
Unter Sachsenhausen 4 50667 Cologne<br />
Phone +49 1802 145 145 * Fax +49 221 145-2900<br />
www.oppenheim-fonds.com<br />
*6 ct/call from German Telekom landline, cellphone charges max. 42 ct/min.