
Create successful ePaper yourself
Turn your PDF publications into a flip-book with our unique Google optimized e-Paper software.
FINANCIAL DATA<br />
› January – <strong>March</strong> <strong>2009</strong><br />
OPERATIONAL DATA<br />
› January - <strong>March</strong> <strong>2009</strong>
Disclaimer<br />
This presentation is confidential and does not constitute or form part of, and should not be construed as, an offer or invitation to subscribe for,<br />
underwrite or otherwise acquire, any securities of <strong>Turkish</strong> <strong>Airlines</strong> A.O (the “Company”) or any member of its group nor should it or any part of it<br />
form the basis of, or be relied on in connection with, any contract to purchase or subscribe for any securities of the Company or any member of<br />
its group nor shall it or any part of it form the basis of or be relied on in connection with any contract, investment decision or commitment<br />
whatsoever. This presentation has been made to you solely for your information and background and is subject to amendment. This<br />
presentation (or any part of it) may not be reproduced or redistributed, passed on, or the contents otherwise divulged, directly or indirectly, to any<br />
other person (excluding the relevant person‟s professional advisers) or published in whole or in part for any purpose without the prior written<br />
consent of the Company.<br />
This presentation includes forward-looking statements. These forward-looking statements include all matters that are not historical facts,<br />
statements regarding the Company‟s intentions, beliefs or current expectations concerning, among other things, the Company‟s results of<br />
operations, financial condition, liquidity, prospects, growth, strategies and the industry in which the Company operates. By their nature, forwardlooking<br />
statements involve risks and uncertainties, including, without limitation, the risks and uncertainties set forth in the Company‟s Offering<br />
Memorandum, because they relate to events and depend on circumstances that may or may not occur in the future. The Company cautions you<br />
that forward-looking statements are not guarantees of future performance and that its actual results of operations, financial condition and liquidity<br />
and the development of the industry in which the Company operates may differ materially from those made in or suggested by the forwardlooking<br />
statements contained in this presentation. In addition, even if the Company‟s results of operations, financial condition and liquidity and<br />
the development of the industry in which the Company operates are consistent with the forward-looking statements contained in this<br />
presentation, those results or developments may not be indicative of results or developments in future periods. The Company does not<br />
undertake any obligation to review or confirm analyst expectations or estimates or to release publicly any revisions to any forward-looking<br />
statements to reflect events that occur or circumstances that arise after the date of this presentation.<br />
2
Speakers<br />
Dr. Temel KOTİL,<br />
CEO, <strong>Turkish</strong> <strong>Airlines</strong><br />
› Started his <strong>Turkish</strong> <strong>Airlines</strong> career in <strong>March</strong> 2003 as Executive Vice President (Technical) and was<br />
appointed as CEO in April 2005<br />
› Ph.D. in Mechanical Engineering University of Michigan, USA<br />
› M.Sc. in Mechanical Engineering University of Michigan, USA<br />
› M.Sc. in Aerospace Engineering University of Michigan, USA<br />
› B.Sc. in Aerospace Engineering, Istanbul Technical University, Istanbul<br />
› Board Members of IATA, <strong>Turkish</strong> <strong>Airlines</strong> Inc, <strong>Turkish</strong> <strong>Airlines</strong> Technical Inc. and Sun Express Inc.<br />
3
Speakers<br />
Coşkun KILIÇ<br />
CFO, <strong>Turkish</strong> <strong>Airlines</strong><br />
› CFO as of <strong>March</strong> 2006<br />
› M.Sc. in Finance, Urbana Champaign Illinois University, USA<br />
› M.A. Economics, Ankara University<br />
› Certified Public Accountant<br />
› Board Member of Sun Express<br />
4
30.7<br />
15.6<br />
11.9<br />
12.9<br />
4.1<br />
4.2<br />
10.0<br />
4.4<br />
54.8<br />
15.5<br />
11.6<br />
55.2<br />
-1.7<br />
11.5<br />
9.4<br />
3.0<br />
10.1<br />
37.2<br />
42.7<br />
17.4<br />
-9.5<br />
-3.7<br />
2.0<br />
5.9<br />
16.5<br />
26.3<br />
7.7<br />
14.4<br />
5.7<br />
6.6<br />
4.2<br />
0.7<br />
17.5<br />
5.0<br />
11.0<br />
4.9<br />
0.6<br />
3.4<br />
1.0<br />
3.5<br />
13.6<br />
16.0<br />
13.5<br />
25.5<br />
-9.8<br />
-4.1<br />
-6.5<br />
-3.4<br />
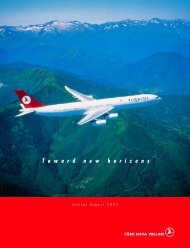
THY vs AEA<br />
30.0<br />
% Changed<br />
19.0<br />
THY vs AEA (Total)<br />
PAX ASK RPK<br />
% Changed<br />
40.0<br />
THY vs AEA (Europe)<br />
PAX ASK RPK<br />
10.0<br />
5.1<br />
13.8<br />
1.2<br />
11.3<br />
-7.3<br />
20.0<br />
0.0<br />
14.6<br />
7.0<br />
15.8<br />
2.0<br />
12.9<br />
-9.0<br />
TK AEA TK AEA TK AEA<br />
TK AEA TK AEA TK AEA<br />
-10.0<br />
2007 2008 1Q <strong>2009</strong><br />
-20.0<br />
2007 2008 1Q <strong>2009</strong><br />
Middle East, Far East and Africa routes are expected to grow higher than average during the years<br />
<strong>2009</strong>-2010, where THY has been successful in growing faster than AEA....<br />
THY vs AEA (Middle East)<br />
THY vs AEA (Far East)<br />
% Changed<br />
60.0<br />
61.1<br />
PAX ASK RPK<br />
50.0<br />
% Changed PAX ASK RPK<br />
28.5<br />
40.0<br />
28.7<br />
36.2<br />
30.0<br />
10.0<br />
3.1 1.9 0.4<br />
9.6<br />
-6.9<br />
20.0<br />
0.0<br />
9.5<br />
8.3<br />
1.0<br />
-10.0<br />
TK AEA TK AEA TK AEA<br />
2007 2008 1Q <strong>2009</strong><br />
TK AEA TK AEA TK AEA<br />
5<br />
2007 2008 1Q <strong>2009</strong>
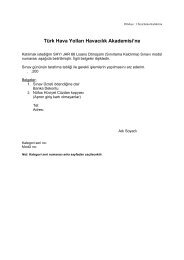
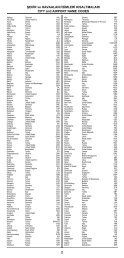
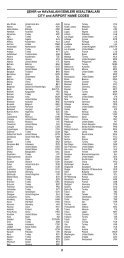
Company Overview<br />
› Destinations<br />
115 International Lines<br />
AMERICAS (3)<br />
CHICAGO<br />
NEW YORK<br />
SAO PAOLO<br />
NORTH AFRICA (7)<br />
ALGERS<br />
CARIO<br />
CASABLANCA<br />
KHARTOUM<br />
TRIPOLI<br />
TUNUS<br />
BENGAZI<br />
MID- AFRICA (4)<br />
ADISABABA<br />
LAGOS<br />
NAIROBİ<br />
DAKAR<br />
AMSTERDAM<br />
ATHENS<br />
BAKU<br />
BARCELONA<br />
BASEL<br />
BELGRAD<br />
BERLIN<br />
BIRMINGHAM<br />
BRUSSELS<br />
BUCHAREST<br />
BUDAPEST<br />
CHISINAOU<br />
COLOGNE<br />
COPENHAGEN<br />
DUBLIN<br />
DONETSK<br />
EUROPE (64)<br />
DÜSSELDORF<br />
MADRID<br />
FRANKFURT<br />
MILAN<br />
GENEVA<br />
MINSK<br />
HAMBURG<br />
MOSCOW<br />
HANNOVER<br />
MUNICH<br />
HELSINKI<br />
NICE<br />
KAZAN<br />
NURNBERG<br />
KIEV<br />
ODESSA<br />
LEFKOSE<br />
OSLO<br />
LISBON<br />
PARIS<br />
LONDON<br />
PRAG<br />
LJUBLIANA<br />
RIGA<br />
LYON<br />
ROME<br />
LVOV<br />
ROSTOV<br />
MANCHESTER<br />
PRISTINA<br />
DNEPREPETROVSK UFA<br />
SARAJEVO<br />
SIMFEROPOL<br />
SKOPJE<br />
SOFIA<br />
STOCKHOLM<br />
STRASBOURG<br />
ST PETERSBURG<br />
STUTTGART<br />
TBILISI<br />
TIRANA<br />
VIENNA<br />
ZAGREB<br />
WARSAW<br />
ZURICH<br />
VENICE<br />
YEKATERINBURG<br />
ALMATY<br />
ASKHABAT<br />
ASTANA<br />
BANGKOK<br />
BEIJING<br />
BISKEK<br />
DUSANBE<br />
HONG KONG<br />
AMMAN<br />
ABU DHABI<br />
BAHREYN<br />
BEIRUT<br />
DAMASCUS<br />
DUBAI<br />
DOHA<br />
JEDDAH<br />
BAGDAT<br />
FAR EAST (17)<br />
KARACHI<br />
MUMBAI<br />
NEW DELHI<br />
SHANGAI<br />
SEOUL<br />
SINGAPORE<br />
TASHKENT<br />
TOKYO<br />
OSAKA<br />
MIDDLE EAST (18)<br />
KUWAIT<br />
MUSCAT<br />
RIYAD<br />
SANAA<br />
TEHRAN<br />
TEBRIZ<br />
TEL AVIV<br />
MEDINAH<br />
ALEPPO<br />
SOUTH AFRICA (2)<br />
6<br />
JOHENSBURG<br />
CAPETOWN
TK-1951 Company INCIDENT Overview<br />
› Destinations<br />
37 Domestic Lines<br />
ÇORLU<br />
İSTANBUL<br />
İSTANBUL<br />
SİNOP<br />
SAMSUN<br />
ÇANAKKALE<br />
BURSA<br />
ESKİŞEHİR<br />
ANKARA<br />
MERZİFON<br />
SİVAS<br />
ERZİNCAN<br />
TRABZON<br />
ERZURUM<br />
KARS<br />
AĞRI<br />
İZMİR<br />
UŞAK<br />
DENİZLİ<br />
KONYA<br />
NEVŞEHİR<br />
KAYSERİ<br />
MALATYA<br />
K.MARAŞ<br />
ADIYAMAN<br />
ELAZIĞ<br />
DİYARBAKIR<br />
MUŞ<br />
BATMAN<br />
VAN<br />
BODRUM<br />
DALAMAN<br />
ANTALYA<br />
ADANA<br />
G.ANTEP<br />
Ş.URFA<br />
MARDİN<br />
HATAY<br />
7
Company Overview<br />
› Services<br />
HABOM Project<br />
› The Joint Venture Company, established by THY Technic AS and Grup Company of Technologies Corporation, Pratt & Whitney<br />
has been registered as `THY Technic Aircraft Engine Maintenance Center Limited Corporation` to commercial registrar as of<br />
October 10th,2008.<br />
› JV agreement on engine maintenance was signed on January 7th 2008, with Pratt & Whitney.<br />
› Revenue stream from engine maintenance is expected to start by the first half of <strong>2009</strong>.<br />
› MoU was signed on November 8, 2007 with Goodrich Aerostructures (Rohr Inc.) on Nacelle and Thrust Reverser<br />
maintenance.<br />
› Under HABOM, the plan is to increase the airframe maintenance capacity to approximately 400 aircraft per annum.<br />
› Expect over 500 mn$ revenue by 2016 from HABOM Project.<br />
THY will be developing its technical service and maintenance business through the HABOM Project<br />
8
Company Overview<br />
› Services<br />
› THY has 4 full flight simulators RJ-100, B737-400, B737-800 and A320 for cockpit crew training.<br />
› THY has;<br />
› A340 ”Business class”, B737 “Economy Class” Cabin Service Trainer(CST)<br />
› B737/A310/A340 Cabin Emergency Evacuation Trainer(CEET)<br />
› For cabin crew training;<br />
Flight Training<br />
› THY provided training to 60 other airlines/companies cabin and cockpit training in 2008. Out of 60 , 39 domestic<br />
and 21 international.<br />
› Besides third party training, THY has provided in-house training for its 8555 cabin crew and 6540 cockpit crew until<br />
December 31st, 2008.<br />
THY will be developing its technical service and maintenance business through the HABOM Project<br />
9
Airline Sector in Turkey<br />
› Passenger Traffic<br />
THY Passenger<br />
Traffic Domestic 2005 2006 2007 2008<br />
08 vs<br />
09<br />
Landings 65,448 78,910 86,428 92,187 20.499 20.824 1.6%<br />
ASK (million) 5,431 7,123 8,087 8,440 1,952 1.953 0.0%<br />
RPK (million) 3,992 5,213 5,893 6,377 1.393 1.421 2.0%<br />
Passenger # ( '000) 7,197 8,906 9,892 10,993 2.328 2.414 3.7%<br />
L/F % 73.5 73.2 73.0 75.6 71.4 72.8 1.4 pt<br />
THY Passenger<br />
Traffic Int'l 2005 2006 2007 2008<br />
Landings 61,689 73,626 83,920 97,762 20.241 23.746 17.3%<br />
ASK (million) 22,741 29,811 33,552 37,878 7.970 9.445 18.5%<br />
RPK (million) 16,355 20,170 24,357 27,790 5.535 6.118 10.5%<br />
Passenger # ( '000) 6,937 8,040 9,711 11,543 2.199 2.494 13.4%<br />
L/F % 71.9 67.7 73.2 73.8 70.0 65.0 -5.0pt<br />
THY Passenger<br />
Traffic Total 2005 2006 2007 2008<br />
Jan-<br />
Mar08<br />
Jan-<br />
Mar08<br />
Jan-<br />
Mar08<br />
Jan-<br />
Mar09<br />
Jan-<br />
Mar09<br />
Jan-<br />
Mar09<br />
08 vs<br />
09<br />
08 vs<br />
09<br />
Landings 127,137 152,536 170,348 189,949 40.740 44.570 9.4%<br />
ASK (million) 28,172 36,934 41,625 46,318 9.922 11.398 14.9%<br />
RPK (million) 20,347 25,383 30,250 34,167 6.929 7.539 8.8%<br />
Passenger # ( '000) 14,134 16,946 19,603 22,536 4.528 4.908 8.4%<br />
L/F % 71.5 68.7 72.7 73.8 69.8 66.1 -3.7 pt<br />
Total Passenger Traffic<br />
January-<strong>March</strong><br />
2008 vs <strong>2009</strong><br />
Landing : up by 9%<br />
ASK : up by 15%<br />
RPK : up by 9%<br />
Passenger : up by 8.4%<br />
L/F<br />
: down by 3.7 points<br />
Significant Growth in<br />
Operational Data<br />
10
(Million)<br />
24<br />
24<br />
25<br />
30<br />
37<br />
42<br />
46<br />
10<br />
11<br />
(%)<br />
Company Overview<br />
› Passenger Traffic<br />
50<br />
45<br />
40<br />
35<br />
30<br />
25<br />
20<br />
15<br />
10<br />
5<br />
0<br />
68.9<br />
Capacity-Traffic Development Load Factor %<br />
67.0<br />
17 16 17<br />
ASK RPK L/F %<br />
70.2 71.5<br />
21<br />
68.7<br />
25<br />
72.7<br />
30<br />
73.9<br />
34<br />
70.3<br />
66.3<br />
7 8<br />
2002 2003 2004 2005 2006 2007 2008 Jan-Mar Jan-Mar<br />
'08 '09<br />
80<br />
70<br />
60<br />
50<br />
40<br />
› In <strong>2009</strong>, capacity on<br />
domestic routes stayed the<br />
same, traffic increased by<br />
2%, load factor increased by<br />
1.4 pt to 72.8. Anadolu Jet‟s<br />
L/F was 77.4%.<br />
› On international routes;<br />
capacity increased by 17%,<br />
traffic increased by 11%,<br />
while load factor decreased<br />
by 5 pt to 65%.AnadoluJet‟s<br />
L/F was 65.4%<br />
› Total capacity increased by<br />
15% while traffic increased<br />
by 9%. Load factor was<br />
66.3% (-4pt).<br />
11
1,120<br />
864<br />
938<br />
1,208<br />
1,468<br />
1,814<br />
2,167<br />
Financial Highlights<br />
› Revenues<br />
Total Revenues (Mn€ 2008)<br />
3,500<br />
3,000<br />
2,500<br />
2,000<br />
1,500<br />
1,000<br />
500<br />
-<br />
Domestic International Other<br />
3,228<br />
1,815<br />
362<br />
1,481<br />
1,581<br />
323 335<br />
2,734 396<br />
2,247 321<br />
1,860 308<br />
251<br />
88 83<br />
332 294 308 401 471<br />
598 665 384 400<br />
133 112<br />
2002 2003 2004 2005 2006 2007 2008 1Q'08 1Q'09<br />
2%<br />
605 594<br />
Source: Financial statements released under <strong>Turkish</strong> CMB standards, converted to € Euro using average exchange rates<br />
Revenue has positive correlation with growth in GDP in Turkey<br />
12
Financial Highlights<br />
› Revenues<br />
Change In R/Y (€) Change In RASK (€)<br />
Domestic International Total<br />
Domestic International Total<br />
30%<br />
20%<br />
10%<br />
0%<br />
-10%<br />
-20%<br />
20%<br />
11% 19%<br />
12%<br />
12%<br />
2% 6% 7%<br />
0%<br />
5%<br />
6%<br />
-7%<br />
2004 2005 2005 2007 2008 1Q'09<br />
-9%<br />
-9%-11%<br />
-11%<br />
-11%<br />
-21%<br />
30%<br />
20%<br />
10%<br />
0%<br />
-10%<br />
-20%<br />
23%<br />
10%<br />
22%<br />
14%<br />
5% 9% 8%<br />
7%<br />
5%<br />
5%<br />
9%<br />
8%<br />
4%<br />
2004 2005 2006 2007 2008 1Q'09<br />
-6%<br />
-14%<br />
-12%<br />
-16%<br />
-19%<br />
-30%<br />
-30%<br />
Source: Financial statements released under <strong>Turkish</strong> CMB standards, converted to € Euro using average exchange rates<br />
13
Financial Highlights<br />
› Revenues<br />
Revenues Split (1Q ‘09)<br />
Passenger Revenues Split by Geography<br />
Charter,<br />
0.3%<br />
Other,<br />
6.6%<br />
Cargo,<br />
7.0%<br />
Pax<br />
Revenue<br />
, 86.1%<br />
Europe N.Africa<br />
37.97% 3.88%<br />
Domestic<br />
21.81% Far East M.Africa<br />
18.52% 0.48%<br />
Int’l<br />
78.19% M.East S.Africa<br />
12.61% 0.98%<br />
Source: Financial statements released under <strong>Turkish</strong> CMB standards, converted to € Euro using average exchange rates<br />
America E.Africa<br />
3.21% 0.55%<br />
Breakdown of Passenger Revenue Constant Over the Years<br />
14
Company Overview<br />
› Passenger Breakdown<br />
Int’l. Traffic Breakdown by Geography<br />
(1Q<strong>2009</strong>)<br />
N. Africa<br />
4,6%<br />
E. Africa<br />
0,47%<br />
Middle East<br />
14.3% S.Africa<br />
0.66%<br />
N. America<br />
1.77%<br />
Market Shares (1Q <strong>2009</strong>)<br />
Foreign<br />
Carriers<br />
30%<br />
Other<br />
<strong>Turkish</strong><br />
Carriers<br />
10%<br />
International<br />
Domestic<br />
THY<br />
60%<br />
Europe<br />
64.6%<br />
W.Africa<br />
0,46%<br />
Stable Market Share in International Traffic<br />
Far East<br />
13%<br />
Other<br />
<strong>Turkish</strong><br />
Carriers<br />
33%<br />
THY<br />
67%<br />
15
52%<br />
48%<br />
10,420<br />
51%<br />
49%<br />
11,991<br />
49%<br />
51%<br />
14,137<br />
48%<br />
52%<br />
16,946<br />
50%<br />
50%<br />
19,636<br />
51%<br />
49%<br />
22,597<br />
49%<br />
51%<br />
4,528<br />
51%<br />
49%<br />
4,908<br />
Company Overview<br />
› Passenger Breakdown<br />
Passenger Breakdown<br />
(2003 – 2008)<br />
25,000<br />
20,000<br />
15,000<br />
10,000<br />
International Domestic Total<br />
100%<br />
80%<br />
60%<br />
40%<br />
› THY carried 4.9 million<br />
passengers in <strong>2009</strong>, with an<br />
increase of 9% compared to<br />
2008.<br />
› Domestic and International<br />
passenger breakdown<br />
consistent over the years.<br />
5,000<br />
0<br />
2003<br />
2004<br />
2005<br />
2006<br />
2007<br />
2008<br />
Jan-Mar<br />
08<br />
Jan-Mar<br />
09<br />
20%<br />
0%<br />
› Haj and charter passengers<br />
each accounted for 2% of the<br />
passenger traffic.<br />
Balanced Breakdown Between Domestic and International Traffic<br />
16
17<br />
Company Overview<br />
› Fleet Development<br />
Additions<br />
Fleet as of May <strong>2009</strong><br />
Type Total Owned<br />
Financial<br />
Lease<br />
Operational<br />
Lease<br />
B737-800 51 - 38 13<br />
B737-700 4 - 4<br />
B737-400 7 - 7<br />
A320-200 22 - 12 10<br />
A321-200 21 - 14 7<br />
A319-100 4 - 4<br />
A330-200 6 - 5 1<br />
A340 9 7 2<br />
A310 2 2 -<br />
B777-3ER(*) 3 -<br />
A310 Cargo 4 3 1<br />
Total 133 12 69 49<br />
Type <strong>2009</strong><br />
B777-ER 3<br />
B737-700 1<br />
A321-200 0<br />
A330-200 2<br />
Total 6<br />
% 9% 52% 37%<br />
(*) B777-3ER‟s are currently under wet-lease and will be converted to dry lease within this year.<br />
Fleet Exits<br />
Type <strong>2009</strong><br />
A321- 200 1<br />
B737-400 4<br />
Total 5<br />
Seat Capacity After<br />
Additions&Exits<br />
Type <strong>2009</strong><br />
Seat Capacity 23.425<br />
› At the end of 1Q <strong>2009</strong>, total seat capacity<br />
reached to 23.080 (91% increase since<br />
2004), with an average age of 6,1 years.<br />
› During <strong>2009</strong>, annual lease payments<br />
expected to be approximately around<br />
$522 million, including 2 /A321 and<br />
2/A330 aircraft to be delivered in <strong>2009</strong>.<br />
› According to the Fleet Plan for <strong>2009</strong>-<br />
2023, decision was made to purchase 25<br />
firm, 10 optional total of 35 Wide Body<br />
Long-Haul aircraft with double aisle and<br />
50 firm, 20 optional total of 70 Narrow<br />
Body Medium-Haul aircraft.<br />
Seat capacity<br />
increased by 29% in 1Q <strong>2009</strong><br />
compared to same period of 2008
(Hours)<br />
10.672<br />
9.47<br />
10.07<br />
10.858<br />
10.12<br />
10.672<br />
10.17<br />
10.598<br />
10.31<br />
18,239<br />
11.14<br />
17,594<br />
11.40<br />
22,238<br />
10.55<br />
17,858<br />
9.57<br />
23,080<br />
Company Overview<br />
› Fleet Development<br />
23,000<br />
18,000<br />
13,000<br />
8,000<br />
3,000<br />
11.0<br />
Seat Capacity<br />
29%<br />
2002 2003 2004 2005 2006 2007 2008 Mar'08 Mar '09<br />
Average Daily Flight Utilization (hrs)<br />
9%<br />
› Since 2004, seat capacity<br />
has increased by 91% in<br />
<strong>2009</strong>.<br />
› Aircraft utilization has been<br />
rising due to better fleet<br />
composition and a more<br />
dynamic scheduling process.<br />
However for 1Q‟09 due to<br />
rapid capacity increase, the<br />
utilization has decreased.<br />
10.0<br />
9.0<br />
Strong capacity growth and<br />
better flight utilization<br />
8.0<br />
2002 2003 2004 2005 2006 2007 2008 Mar'08 Mar '09<br />
18
166<br />
945<br />
10,984<br />
158<br />
1,018<br />
10,239<br />
150<br />
1,094<br />
10,956<br />
134<br />
1,271<br />
11,121<br />
124<br />
1,323<br />
12,807<br />
127<br />
1,517<br />
12,951<br />
111<br />
1,606<br />
14,072<br />
128<br />
13,185<br />
108<br />
14,119<br />
Company Overview<br />
› Operating Efficiency<br />
12,000<br />
7,000<br />
2,000<br />
No of Personnel<br />
2002 2003 2004 2005 2006 2007 2008 Mar'08 Mar'09<br />
9%<br />
› THY enjoys high personnel<br />
efficiency compared to its<br />
competitors.<br />
› Personnel cost of THY per<br />
ASK was only €1.3 cents for<br />
1Q<strong>2009</strong><br />
19<br />
1,200<br />
700<br />
200<br />
200<br />
160<br />
120<br />
80<br />
40<br />
0<br />
Passengers per Employees<br />
343 348<br />
2002 2003 2004 2005 2006 2007 2008 Mar'08 Mar'09<br />
Employees per Aircraft<br />
1.2%<br />
16%<br />
2002 2003 2004 2005 2006 2007 2008 Mar'08 Mar'09<br />
› 108 employees per aircraft<br />
and 348 passengers per<br />
employee for the 1Q „09.<br />
Personnel efficiency is<br />
the key driven<br />
while ıncreasing fleet size
Financial Highlights<br />
› Operating Expenses<br />
Operating Expenses (€ Euro Mn)<br />
(€ Mn) 1Q'08 % in Total 1Q'09 % in Total 09/'08 %<br />
Personnel 149 24% 150 25% 1%<br />
Fuel 186 30% 130 21% -30%<br />
Rents 28 5% 48 8% 75%<br />
Maintenance 42 7% 39 6% -6%<br />
Insurance 4 1% 6 1% 49%<br />
Depreciation 46 8% 43 7% -7%<br />
Landing 42 7% 54 9% 29%<br />
Ground handling 30 5% 39 6% 31%<br />
Passenger Catering 29 5% 32 5% 12%<br />
Sales and Marketing 45 7% 52 8% 14%<br />
General Administration 5 1% 5 1% 7%<br />
Others 6 1% 10 2% 71%<br />
TOTAL 612 609 -0.5%<br />
Op.Cost per ASK (€ ) 6.18 5.35 -13%<br />
The difference is due to monthly exchange and year end exchange rate/<br />
20<br />
10<br />
0<br />
30%<br />
20%<br />
10%<br />
0%<br />
-10%<br />
-20%<br />
13.5<br />
Operating Costs per ASK<br />
(€ Cent 1Q’09)<br />
11.8<br />
10.6<br />
8.1 7.3<br />
Change in CASK €<br />
(1Q ‘09)<br />
5.4 4.9<br />
SAS LH OS IB AY TK EZY<br />
Domestic International Total<br />
11%<br />
14%<br />
16%<br />
11%<br />
10%<br />
1%<br />
6%<br />
0%<br />
1%<br />
-8% -4%<br />
-7%<br />
2004 -5% 2005 2006 2007-6%<br />
2008 1Q'09-9%<br />
-9%<br />
-11%<br />
-11%<br />
Total Expenses did not increase this quarter due to decrease in Fuel Expense<br />
20
€ sent<br />
Historical Highlights<br />
› Operating Expenses<br />
% in Total Operating Expenses (2002 – 1Q’09) € Cost Per ASK (2002-1Q ‘09)<br />
40%<br />
Personne Expenses<br />
Fuel Expenses<br />
CASK Personnel per ASK Fuel Per ASK<br />
35%<br />
30%<br />
25%<br />
20%<br />
15%<br />
10%<br />
27% 28%<br />
20% 23% 23% 24% 20%<br />
30%<br />
34%<br />
25%<br />
24%<br />
24%<br />
24% 21%<br />
20%<br />
21%<br />
15% 16%<br />
2002 2003 2004 2005 2006 2007 2008 1Q '081Q '09<br />
10.00<br />
8.00<br />
6.00<br />
4.00<br />
2.00<br />
-<br />
6.53<br />
5.67<br />
6.05 5.95 5.71 6.25 6.18<br />
5.36<br />
5.35<br />
2.11<br />
0.85 1.11 1.47 1.66<br />
0.95<br />
1.59 1.88<br />
1.14<br />
1.31 1.22 1.32 1.45 1.22 1.37 1.34 1.51 1.32<br />
2002 2003 2004 2005 2006 2007 2008 1Q'08 1Q'09<br />
Portion of fuel expenses decreased significantly<br />
21
Financial Highlights<br />
› EBITDAR<br />
EBITDAR margin % Comparison (1Q <strong>2009</strong>)<br />
20<br />
10<br />
0<br />
12.8<br />
11.4<br />
5.1<br />
2.0<br />
TK SAS LH CA<br />
› Cost cutting policies had a<br />
positive impact on operating<br />
expenses.<br />
› <strong>2009</strong> Year-end targeted<br />
EBITDAR Margin is 16%.<br />
(€ Euro Mn) 2004 2005 2006 2007 2008 1Q '08 1Q '09 09/'08 %<br />
Revenue 1.581 1.86 2.247 2.734 3.228 607 594 -2%<br />
EBIT 81 56 48 285 334 -2 -15 650%<br />
EBIT Margin (%) 5,1 3,0 2,1 10,42 10,34 -0.38 -2.59 -0.02pt<br />
EBITDA 251 235 235 490 541 44 28 10%<br />
EBITDA Margin (%) 15,9 12,6 10,5 17,92 16,77 7.25 4.69 -0.03 pt<br />
EBITDAR 315 320 366 678 723 71 76 3%<br />
EBITDAR Margin (%) 19,9 17,2 16,3 24,81 22,41 11.71 12.84 1.14 pt<br />
Net Income 61 56 101 149 598 114 72 -37%<br />
22
(Litre per 100 ask)<br />
THY<br />
› Fuel<br />
Average Specific Fuel Consumption<br />
4.2<br />
4.04<br />
THY Fleet 2007 3.6 Litres/100 ASK<br />
4.0<br />
3.82<br />
3.77<br />
3.8<br />
3.89<br />
3.76<br />
3.84<br />
3.6<br />
3.67 3.60<br />
3.4<br />
11,16% reduction since 2000<br />
3.59<br />
3.2<br />
3.0<br />
1999 2000 2001 2002 2003 2004 2005 2006 2007 2008<br />
Per ASK Fuel Cost (€ Cent) 1Q <strong>2009</strong><br />
› Daily average crude oil<br />
prices increased by 78% in<br />
2008 compared to 2007.<br />
› Although THY does not<br />
hedge, its fuel expense per<br />
ASK is lower on the average<br />
compared to its peer group.<br />
› Due to fleet expansion, the<br />
fleet average age will be<br />
lower which in return will<br />
increase THY‟s fuel<br />
efficiency.<br />
7<br />
5<br />
3<br />
1<br />
-2<br />
6.08<br />
2.23 1.88 1.67 1.64 1.40 1.14<br />
OS SAS IB LH EZY AY TK<br />
Fleet expansion will reduce<br />
fuel cost as well as fleet age<br />
23<br />
Source: Company annual reports & websites.
THY<br />
› Currency Breakdown<br />
Income by Currency (1Q <strong>2009</strong>)<br />
Other, 32%<br />
USD, 12%<br />
› THY‟s income is diversified<br />
among the major currencies.<br />
› Due to its currency basket<br />
THY is very flexible on fx<br />
position.<br />
YTL, 16%<br />
YTL,33%<br />
Expenses by Currency (1Q <strong>2009</strong>)<br />
YTL, 33%<br />
Other, 6%<br />
Other, 6%<br />
USD, 49%<br />
EURO, 40%<br />
USD, 49%<br />
› Although USD income is<br />
lower than USD expenses<br />
THY is able to cover its USD<br />
expenses from Euro income<br />
due to strong Euro against<br />
USD.<br />
Diversified revenue & expense<br />
base and agility<br />
in pricing currency<br />
Euro, 11%<br />
EURO, 11%<br />
24
Company Overview<br />
› Highlights<br />
› Blessed by its prime location<br />
› Turkey only 3hrs flight from 50 different countries<br />
› Increased focus on transit flights since 2002<br />
› Increased focus on Business Class passengers since 2006<br />
› Market leader in Turkey with a strong brand recognition<br />
› Member of Star Alliance<br />
› Substantial cost advantage over rivals<br />
› Labor costs only 1.32€ per ASK (Austrian : 2.41€, Lufthansa :3.25€, Iberia: 2.12€)<br />
› Profitable with room for further cost reductions<br />
25
THANK YOU<br />
<strong>Turkish</strong> <strong>Airlines</strong> Inc.<br />
Investor Relations Department<br />
Mr.Coşkun KILIÇ / CFO<br />
Ms.Suna ÇELEBİ / IR Manager<br />
Tel: +90 212-463-6363/3630<br />
E-mail: ir@thy.com<br />
26
Mn €<br />
136<br />
144<br />
160<br />
175<br />
179<br />
201<br />
43<br />
42<br />
THY<br />
› Cargo Transportation<br />
Cargo Revenue (€ Mn)<br />
250<br />
200<br />
150<br />
100<br />
2%<br />
› Domestic and International<br />
breakdown is consistent over<br />
the years.<br />
› Cargo revenue has decreased<br />
by 2% in 1Q <strong>2009</strong> compared to<br />
same period of 2008.<br />
50<br />
0<br />
2003 2004 2005 2006 2007 2008 1Q'08 1Q'09<br />
Plans to Enlarge Freighter Fleet<br />
Aiming Higher Cargo Revenues<br />
Source: Company<br />
27
(Tons<br />
(Tons)<br />
96,467<br />
276,283<br />
122,822<br />
93,828<br />
324,588<br />
134,851<br />
103,729<br />
331,116<br />
144,974<br />
113,163<br />
348,722<br />
159,873<br />
125,033<br />
382,572<br />
183,052<br />
144,033<br />
402,097<br />
199,006<br />
161,249<br />
85,975<br />
44,889<br />
35,603<br />
85,618<br />
47,015<br />
39,195<br />
THY<br />
› Cargo Transportation<br />
250,000 International<br />
200,000<br />
150,000<br />
100,000<br />
Domestic<br />
THY - Cargo<br />
50,000<br />
0<br />
28,438 28,994 31,122 31,811 34,840 39,019 37,757<br />
8,992 8,247<br />
2002 2003 2004 2005 2006 2007 2008 1Q '08 1Q '09<br />
Source: Company<br />
› Domestic and International<br />
breakdown is consistent over<br />
the years.<br />
› As of January - <strong>March</strong> <strong>2009</strong><br />
THY has carried total of<br />
47.442 Tons cargo, indicating<br />
6.4% increase compared to<br />
same period of 2008.<br />
450,000<br />
300,000<br />
150,000<br />
<strong>Turkish</strong> Cargo Market vs THY<br />
44% 42%<br />
Türkiye Pazarı<br />
THY<br />
44% 46% 48%<br />
49%<br />
52%<br />
55%<br />
80%<br />
60%<br />
40%<br />
20%<br />
› Cargo revenue has increased<br />
by 12% in 2008 compared<br />
to 2007.<br />
Plans to Enlarge Freighter Fleet<br />
Aiming Higher Cargo Revenues<br />
0<br />
0%<br />
2003 2004 2005 2006 2007 2008 1Q '08 1Q '09<br />
28<br />
Source: Company
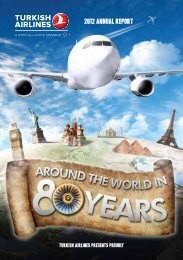
Weekly Frequency<br />
THY<br />
› Network Mapping<br />
5,500<br />
4,500<br />
Forecasted<br />
<strong>2009</strong> - 132<br />
3,500<br />
2008 - 127<br />
2007 - 101<br />
2006- 103<br />
2,500<br />
2005- 83<br />
2004-73<br />
1,500<br />
2002- 66<br />
2003- 65<br />
Destinations<br />
90 100 110 120 130 140 150 160 170
THY<br />
› Assets& Liabilities<br />
Assets (in € Mn) 2003 2004 2005 2006 2007 2008<br />
Annual<br />
08/'07<br />
Cash and Equivalents 378 200 304 197 281 236 -16%<br />
Net Trade Receivables 68 87 121 135 179 163 -9%<br />
Other Current Assets 57 84 95 241 410 806 97%<br />
Total Current Assets 502 371 520 573 870 1205 39%<br />
Due from Related Parties (Long Term) 30 0 0 8 13 11 -15%<br />
Net Fixed Assets 1130 995 1657 1671 1891 2359 25%<br />
Other Long Term Assets 26 248 224 143 104 101 -3%<br />
Total Long Term Assets 1.186 1.243 1.882 1.822 2.008 2.471 23%<br />
Total Assets 1.689 1.614 2.402 2.395 2.878 3.677 28%<br />
Liabilities (in € Mn) 2003 2004 2005 2006 2007 2008<br />
Annual<br />
'07/'06<br />
Short Term Lease Obligations 140 111 229 118 134 196 46%<br />
Accounts Payable 104 108 161 172 213 203 -5%<br />
Passenger Flight Liabilities 64 101 0 151 222 206 -7%<br />
Other Current Liabilities 112 78 365 136 125 149 19%<br />
Total Current Liabilities 420 399 755 577 694 754 9%<br />
Long Term Lease Obligations 688 524 540 780 933 1307 40%<br />
Retirement Pay Provision 45 55 72 63 77 67 -13%<br />
Other Long Term Liabilities 31 29 249 106 94 154 64%<br />
Total Long Term Liabilities 764 608 861 949 1104 1528 38%<br />
Capital 963 1048 110 95 102 82 -20%<br />
Share Premium 0 0 1180 1010 1018 781 -23%<br />
Reserves 71 77 5 4 36 0 -100%<br />
Foreign Currency Translation Differences 2<br />
Accumulated Loss /Income -530 -518 -509 -240 -75 530 807%<br />
Total Shareholders Equity 505 608 786 869 1081 1395 29%<br />
Total Liabilities & Shareholders Equity 1.689 1.614 2.402 2.395 2.878 3.677 28%<br />
30<br />
Source: In converting the TRY reported results to EURO, year-end EURO exchange rates were used
THY<br />
› Income Statement<br />
Income Statement<br />
(in Euro mn) 2003 2004 2005 2006 2007 2008 1Q'08 1Q'09<br />
Operating Revenues 1.481 1.581 1.86 2.246 2.685 3.228 605 594 -2%<br />
09/08<br />
%<br />
Operating Expenses -1.289 -1.501 -1.804 -2.196 -2.38 -2.894 -612 -609 -0.5%<br />
Operating Profit 193 81 56 50 307 334 -7 -15 108%<br />
Income From Other Operations 53 34 255 486 64 30 103 46 -56%<br />
Loss From Other Operations -6 -9 -166 -376 -236 -54 -1 -4 425%<br />
Income Before Financial Income/(Expense) 240 105 145 159 135 310 95 27 -72%<br />
Income/Loss due From Asset Valuation 2 -5 -5 10%<br />
Financial Income/(Loss) 154 21 -36 -54 93 753 205 229 12%<br />
Monetary Gain/(Loss) -223 -64 - - - -376 -153 -124 -19%<br />
Income Before Taxation 170 62 109 105 228 688 143 127 -11%<br />
Taxation -43 -2 -26 -4 -63 -90 -30 -55 86%<br />
Net Income 127 61 83 101 164 598 113 72 -36%<br />
In converting the TRY reported results to EURO, the period average EURO exchange rates were used<br />
31
THY<br />
› Subsidiary & Affiliates<br />
Subsidiaries<br />
› THY Technic A.S.(Consolidated)<br />
› Owned 100% by THY<br />
› During the 1Q‟09 posted revenues and net income was 77€mn and<br />
16€mn respectively.<br />
› Provides maintenance services to more than 10 international airlines<br />
including Lufthansa, KLM, BA and Alitalia as well as domestic airlines.<br />
› Main goal is to become one of the biggest MRO Center in the region.<br />
› THY Do & Co Catering A.S. (Equity Pick-up)<br />
› Owned 50% - %50 by THY and Do & Co Restaurants & Catering A.G.<br />
› During the 1Q‟09 posted revenues and net income was 23€mn and<br />
1.2€mn respectively.<br />
› TGS Ground Handling Inc. (Equity Pick-up)<br />
› Registered on August 28th, 2008 to Commerce Registary.<br />
› Sun Express A.S. (Equity Pick-up)<br />
› Owned 50% - 50% by THY and Lufthansa, respectively.<br />
› Fleet consisted of 19 aircraft; 16 B737& 3 B757 aircraft with<br />
total seat capacity of 3,696 as of <strong>March</strong> <strong>2009</strong>. Carried<br />
1,057,691 passengers in 1Q of <strong>2009</strong>, by achieving load factor<br />
of 75.47%. Number of personnel was 1,126 as of <strong>March</strong> <strong>2009</strong>.<br />
› During the 1Q‟09 posted revenues and net income was<br />
71.653€ ths and 10.067 €ths respectively.<br />
› JP`B&H <strong>Airlines</strong>`d.o.o.Sarajevo (Equity Pick-up)<br />
› Owned 49% by THY<br />
› During the 1Q‟09 posted revenues and loss was 979€ ths<br />
and 1.435 €ths respectively<br />
› THY Flight Training Inc. (to be Established)<br />
› With 6 Full Flight Simulators, 8 A/Cs and cabin training mock-ups<br />
HABOM Project will be<br />
launched by THY Technic A.Ş.<br />
32
THY<br />
› Safety & Quality<br />
› Safety:<br />
As it is very well known and appreciated “Safety” is the key concept to be<br />
adopted for existence. THY is determined to operate with the highest<br />
operational standards. Accepting and implementing the standards dictated<br />
by the aviation authorities and manufacturers as the baseline, THY strives<br />
to attain safer operation conditions in respect to continuous development<br />
process and appreciates it as a must. Within the frame of this efforts,<br />
adoption of Safety Management System approach, implementation of<br />
Flight Data Monitoring (FDM) system, trainings provided in risk assessed<br />
flight subjects and publications to flourish a widespread safety culture can<br />
be mentioned. The Flight Safety Department that has direct access to the<br />
Accountable Manager is in charge of the management and oversight of the<br />
system‟s safety. In addition to its audits, it also implements the Flight Data<br />
Monitoring System, makes informal Line Observations and investigates the<br />
occurences and reports (mandatory/voluntary) to promote safety.<br />
In this context, it must be emphasized that THY is qualified as an IOSA<br />
Operator after the IATA Operational Safety Audit as of April 07, 2006. The<br />
expiry date of renewed IOSA operatorship is October <strong>2009</strong>. In addition to<br />
the IOSA audit, due to its vast operation network, THY is in active contact<br />
with numerous Civil Aviation Authorities and subject to their audits. These<br />
audits, as well as providing the opportunity to the auditors to evaluate the<br />
current situation, input the required feedback for THY‟s safer operation<br />
from thereupon.<br />
› Quality:<br />
<strong>Turkish</strong> <strong>Airlines</strong> adopted TS-EN ISO 9001:2000 Quality<br />
Management System (QMS) in 2006. Quality Assurance<br />
Directorate which is also connected directly to Accountable<br />
Manager is in charge of the implementation and oversight of the<br />
quality system. The departments within this directorate are; Flight<br />
Operations, Ground Operations, Technic, Cabin, Flight Training,<br />
Quality Management and Improvement. Each department<br />
implements scheduled and unscheduled operational audits<br />
annually to acquire the condition information. The QMS is in a<br />
development stage progressing into Integrated Management<br />
System. TS-EN ISO 14001:2004 – Environmental Management<br />
System and OHSAS 18001- Occupational Health and Safety<br />
System are planned to be integrated by mid of <strong>2009</strong>.<br />
In addition to above, having all requirements fulfilled and systems<br />
in place with regards to <strong>Turkish</strong> Civil Aviation Law, <strong>Turkish</strong> <strong>Airlines</strong><br />
has the AOC (Air Operator Certificate) approved by <strong>Turkish</strong> Civil<br />
Aviation Administration (CAA).<br />
33