
Create successful ePaper yourself
Turn your PDF publications into a flip-book with our unique Google optimized e-Paper software.
2007/08 statistics<br />
GEOGRAPHICAL DISTRIBUTION<br />
OF PROJECTS<br />
Turkey<br />
6%<br />
UK<br />
3%<br />
Other<br />
Europe<br />
5%<br />
Americas<br />
15%<br />
RoW<br />
13%<br />
Europe<br />
68.7%<br />
Americas<br />
17.8%<br />
RoW<br />
13.5%<br />
2007<br />
France<br />
3%<br />
Europe<br />
66.8%<br />
Americas<br />
19.4%<br />
RoW<br />
13.8%<br />
Italy<br />
38%<br />
2008<br />
Germany<br />
8%<br />
The Netherlands<br />
9%<br />
2006<br />
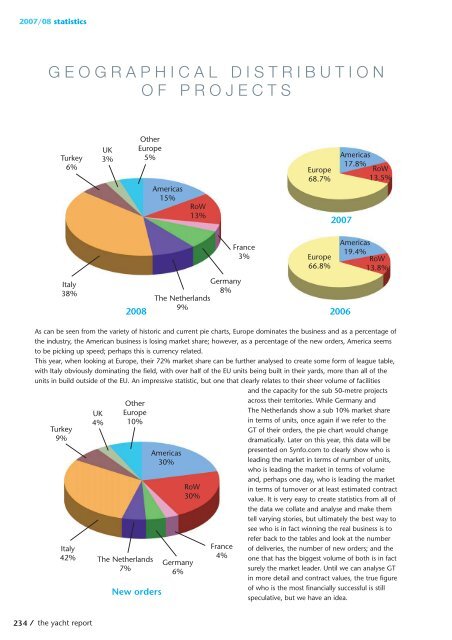
As can be seen from the variety of historic and current pie charts, Europe dominates the business and as a percentage of<br />
the industry, the American business is losing market share; however, as a percentage of the new orders, America seems<br />
to be picking up speed; perhaps this is currency related.<br />
This year, when looking at Europe, their 72% market share can be further analysed to create some form of league table,<br />
with Italy obviously dominating the field, with over half of the EU units being built in their yards, more than all of the<br />
units in build outside of the EU. An impressive statistic, but one that clearly relates to their sheer volume of facilities<br />
and the capacity for the sub 50-metre projects<br />
Turkey<br />
9%<br />
Italy<br />
42%<br />
UK<br />
4%<br />
Other<br />
Europe<br />
10%<br />
The Netherlands<br />
7%<br />
New orders<br />
Americas<br />
30%<br />
RoW<br />
30%<br />
Germany<br />
6%<br />
France<br />
4%<br />
across their territories. While Germany and<br />
The Netherlands show a sub 10% market share<br />
in terms of units, once again if we refer to the<br />
GT of their orders, the pie chart would change<br />
dramatically. Later on this year, this data will be<br />
presented on Synfo.com to clearly show who is<br />
leading the market in terms of number of units,<br />
who is leading the market in terms of volume<br />
and, perhaps one day, who is leading the market<br />
in terms of turnover or at least estimated contract<br />
value. It is very easy to create statistics from all of<br />
the data we collate and analyse and make them<br />
tell varying stories, but ultimately the best way to<br />
see who is in fact winning the real business is to<br />
refer back to the tables and look at the number<br />
of deliveries, the number of new orders; and the<br />
one that has the biggest volume of both is in fact<br />
surely the market leader. Until we can analyse GT<br />
in more detail and contract values, the true figure<br />
of who is the most financially successful is still<br />
speculative, but we have an idea.<br />
234<br />
the yacht report