VME 2100 Apr 02 PDF - VITA Technologies
VME 2100 Apr 02 PDF - VITA Technologies
VME 2100 Apr 02 PDF - VITA Technologies

Create successful ePaper yourself
Turn your PDF publications into a flip-book with our unique Google optimized e-Paper software.
Broadband FIR Moving-Target Indicator<br />
Radar Filters for Low-PRF Applications<br />
By Christopher Repesh<br />
Simple, feed-forward, multi-pulse cancellers are typical in<br />
Doppler processing Moving Target Indicator (MTI) radars for<br />
suppression of fixed targets. Doppler shift allows detection of<br />
targets that have a radial velocity component relative to the<br />
background return. Coherent pulsed radars that preserve transmitted<br />
pulse phase in the receiver demodulation reference signal<br />
allow for recovery of both phase and amplitude effects of<br />
propagation and Doppler shift. Using low pulse repetition frequencies,<br />
unambiguous range measurements with narrowband<br />
static clutter rejection can be achieved with simple binomial,<br />
weighted high-pass Finite Impulse Response (FIR) filters. In<br />
conditions of weather and chaff, the predominant clutter returns<br />
may have Doppler shifts that allow ineffective canceling with<br />
such filters. By using the phase recovery of coherent pulsed<br />
radars, these filters can become broadband cancellers.<br />
Introduction<br />
The analysis described in this article is used in the Peregrine<br />
Coastal Surveillance Radar developed by Metric Systems Inc.<br />
This system is being deployed as part of the Adriatic Coastal<br />
Surveillance Project in the Republic of Croatia. It is a signal processing<br />
and C3 modernization and upgrade of the original ITT<br />
Gilfillan FALCON design. Peregrine has an instrumented MTI<br />
range of 100 km, providing airborne and coastal maritime surveillance<br />
in low-coverage, gap-filler applications.<br />
Transmitted radar pulses can be described using the Binary Phase<br />
Shift Key (BPSK) complex envelope representation for demodulation<br />
purposes. The pulse width determines the frequency width<br />
of the power spectral density. The complex envelope, g(t), is<br />
described in Equations 1-3, where x(t) and y(t) are the quadrature<br />
components, m(t) is the binary code waveform, and A c is the<br />
carrier amplitude.<br />
g(t)=x(t) + jy(t) = R(t)e jθ(t) (1)<br />
m(t) = + 1 (2)<br />
g(t) = jA c m(t) (3)<br />
Code-modulated waveforms used in pulse compression allow for<br />
increased range resolution for a fixed peak transmission power.<br />
The bit duration interval has an inverse effect on the complex<br />
envelope power spectral density. Increased receiver bandwidth<br />
degrades the receiver sensitivity to noise, limiting the effectiveness<br />
of longer code words. If the pulse duration to be code modulated<br />
is shorter than the period of the Doppler modulation, then<br />
the code waveform’s phase information will be preserved for the<br />
matched filter for a given target return.<br />
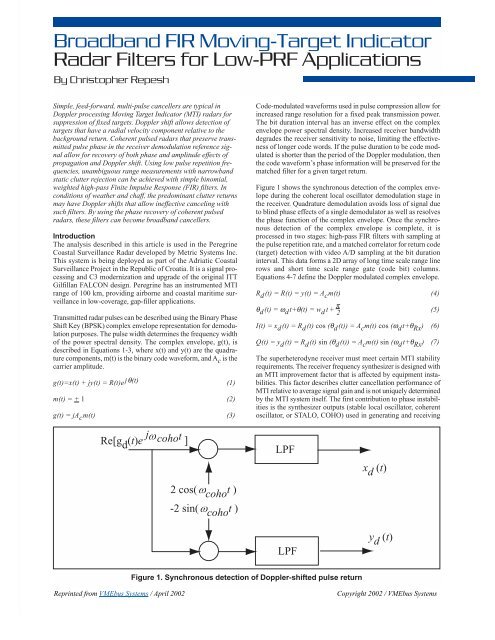
Figure 1 shows the synchronous detection of the complex envelope<br />
during the coherent local oscillator demodulation stage in<br />
the receiver. Quadrature demodulation avoids loss of signal due<br />
to blind phase effects of a single demodulator as well as resolves<br />
the phase function of the complex envelope. Once the synchronous<br />
detection of the complex envelope is complete, it is<br />
processed in two stages: high-pass FIR filters with sampling at<br />
the pulse repetition rate, and a matched correlator for return code<br />
(target) detection with video A/D sampling at the bit duration<br />
interval. This data forms a 2D array of long time scale range line<br />
rows and short time scale range gate (code bit) columns.<br />
Equations 4-7 define the Doppler modulated complex envelope.<br />
R d (t) = R(t) = y(t) = A c m(t) (4)<br />
θ d (t) = ω d t+θ(t) = w d t+<br />
2<br />
π (5)<br />
I(t) = x d (t) = R d (t) cos (θ d (t)) = A c m(t) cos (ω d t+θ Rx ) (6)<br />
Q(t) = y d (t) = R d (t) sin (θ d (t)) = A c m(t) sin (ω d t+θ Rx ) (7)<br />
The superheterodyne receiver must meet certain MTI stability<br />
requirements. The receiver frequency synthesizer is designed with<br />
an MTI improvement factor that is affected by equipment instabilities.<br />
This factor describes clutter cancellation performance of<br />
MTI relative to average signal gain and is not uniquely determined<br />
by the MTI system itself. The first contribution to phase instabilities<br />
is the synthesizer outputs (stable local oscillator, coherent<br />
oscillator, or STALO, COHO) used in generating and receiving<br />
Re[g d (t)e j cohot ]<br />
LPF<br />
x d (t)<br />
2 cos( coho t )<br />
-2 sin( coho t )<br />
LPF<br />
y d (t)<br />
Figure 1. Synchronous detection of Doppler-shifted pulse return<br />
Reprinted from <strong>VME</strong>bus Systems / <strong>Apr</strong>il 20<strong>02</strong><br />
Copyright 20<strong>02</strong> / <strong>VME</strong>bus Systems
the signal. Phase jitter in the video A/D sampling clock also<br />
causes imperfect clutter cancellation. Sensitivity time control<br />
attenuation for range normalization of nearby small targets contributes<br />
to amplitude and phase distortion. The phase, amplitude,<br />
and timing of the pulse code transmitter driver must also be considered.<br />
The MTI improvement factor has a direct effect on the<br />
stability of the constant receiver phase shift θ Rx in Equations 6-7.<br />
A steadily moving target moving at v d will Doppler shift by ω d<br />
the carrier frequency ω c , thereby altering the complex envelope of<br />
the radar waveform. This is defined in Equation 8, where ω c is the<br />
speed of light. The Doppler frequency is simply the time derivative<br />
of the complex envelope’s phase function, thus the emphasis<br />
on constant receiver phase offset. This Doppler shift is found by<br />
sampling the quadrature phase angle at the pulse repetition frequency.<br />
It is this angle α, defined in Equation 9 and illustrated in<br />
Figure 2, that is measured using consecutive IQ samples at the<br />
pulse repetition interval. This is averaged over many continuous<br />
Q<br />
(I 0 , Q 0 )<br />
d<br />
(I 1 , Q 1 )<br />
Figure 2. Quadrature Doppler phase angle<br />
measurement<br />
I<br />
range bins. The measured α, pulse repetition interval at the time of<br />
measurement, and carrier frequency determine a Doppler velocity<br />
that, combined with any other pulse repetition interval, determines<br />
the weights of the broadband filter when used at that pulse repetition<br />
sampling. Log detection in the IF stage with wide instantaneous<br />
dynamic range (80 dB) can be used to determine range bin<br />
phase samples for appropriate measurement of the Doppler phase<br />
angle over many samples using averaging.<br />
c<br />
v d = 2fc<br />
f d (8)<br />
2πfd 4π f<br />
α d = fpr<br />
= . c<br />
. c f<br />
v pr d (9)<br />
Static Clutter Pulse Cancellers<br />
The fundamental MTI filter component is the high-pass FIR<br />
feed-forward pulse canceller. These filters are guaranteed to be<br />
stable, i.e., all zeroes and no poles in the transfer function. They<br />
are easy to implement in direct form using a tapped delay line.<br />
The binomial weights, given in Equation 10, provide a symmetric<br />
or anti-symmetric unit sample response, depending on the<br />
order of the weights being odd or even. This symmetry guarantees<br />
a linear phase transformation and constant group delay,<br />
which is essential for presenting the filtered pulse compressed<br />
signal to the matched correlator. The nth power of two in the<br />
denominator of Equation 10 normalizes the maximum filter gain<br />
to unity. This is normalized for fixed-point DSP mapping to<br />
avoid accumulative overflow, where the inputs are normalized to<br />
Reprinted from <strong>VME</strong>bus Systems / <strong>Apr</strong>il 20<strong>02</strong><br />
Copyright 20<strong>02</strong> / <strong>VME</strong>bus Systems
avoid multiplicative overflow. Equation 11 gives the time domain<br />
response of the filter, where the order of the filter is q+1. Figure<br />
3 shows the unity gain frequency response of the filter.<br />
Given a pulse repetition frequency, only a small range of Doppler<br />
frequencies can be resolved at that sampling rate. Aliasing in the<br />
MTI filter will periodically stopband at integer multiples of the<br />
sample rate any incoming Doppler signal at that frequency. These<br />
periodic ambiguous rejection stopbands are known as blind<br />
speeds. Pulse-to-pulse staggering eliminates use of feedback to<br />
improve the blind speed response, thereby avoiding the stability<br />
issues of IIR filters. Staggering can be described as cascaded<br />
interpolation and decimation filter stages. Sample rate conversion<br />
maintains detection of targets by scaling the frequency domain<br />
spectrum envelope into the passband of the MTI filter. Low frequency<br />
components are not significantly scaled, so they always<br />
fall in the stopband of the MTI filter. Figure 4 illustrates a fourthorder<br />
response with varying stagger schedules compared to the<br />
uniform sampled filter response. Many stagger ratios have been<br />
described by other researchers on this topic, and they are dependent<br />
on the order of the filter. Those shown in Figure 4 use 10-<br />
20 percent increases in subsequent sampling intervals. A good<br />
stagger ratio can result in only a 10 dB loss of signal in the blind<br />
speed zones while maintaining the low-frequency stopband.<br />
Dynamic Clutter Pulse Cancellers<br />
Clutter-locked MTI uses a measured average Doppler shift of a<br />
given volume of clutter that is used to control an offset frequency<br />
oscillator that shifts clutter into the rejection notch. The first stage of<br />
the process is to take the complex conjugate of the synchronous<br />
detected signal to obtain a symmetric weight distribution in the<br />
completed derivation. Both h 1 and h 2 in Figure 5 are high-pass FIR<br />
transfer functions as defined by Equations 10 and 11 and can have<br />
any order as needed. The frequency oscillator performs a down con-<br />
dB<br />
0<br />
-10<br />
Order<br />
2<br />
3<br />
4<br />
5<br />
-20<br />
-30<br />
-40<br />
0 0.1 0.2 0.3 0.4 0.5<br />
Figure 3. MTI high-pass filter response vs. normalized frequency<br />
f<br />
f<br />
pr<br />
dB<br />
0<br />
Stagger Ratio 1<br />
Stagger Ratio 2<br />
Stagger Ratio 3<br />
Stagger Ratio 4<br />
No Stagger<br />
-20<br />
-40<br />
-60 0 0.5 1 1.5 2 2.5 3<br />
Figure 4. MTI fourth-order HPF response with stagger vs. normalized frequency<br />
f<br />
f<br />
pr<br />
Reprinted from <strong>VME</strong>bus Systems / <strong>Apr</strong>il 20<strong>02</strong><br />
Copyright 20<strong>02</strong> / <strong>VME</strong>bus Systems
version role that shifts the mean moving clutter component into the<br />
rejection notch of h 2 . The purpose of h 1 is to remove any static clutter<br />
component before the frequency translation stage, preventing<br />
upconverting it into the passband of h 2 . The resulting complex signal<br />
r(n) will be filtered in both the in-phase and quadrature-phase<br />
components and is defined in Equation 12.<br />
The order of h 1 is q+1, and the order of h 2 is p+1. Expanding the<br />
complex exponential term using Euler’s identity and multiplying<br />
it across the responses of the first stage filter, the r(n) response<br />
can then be expanded into its in-phase and quadrature components.<br />
Doppler cross-modulation terms are defined for each component<br />
by Equations 13-16, where t pr is the reciprocal of the<br />
pulse repetition frequency.<br />
b(k) =<br />
(–1) k (q)!<br />
2 q .<br />
(q – k)!(k)!<br />
(10)<br />
q<br />
out(n) = Σb(k)in(n – k) (11)<br />
k =0<br />
x d (n) - jy d (n) h 1 (n) h 2 (n) r(n)<br />
The filter response shown in Figure 7 illustrates the stopband<br />
improvement of Equation 12. This response is computed using a<br />
C-band carrier of 5.4 GHz, Doppler velocity-tuned weighting at<br />
8.5 meters/sec, and a pulse repetition frequency of 1538 Hz. A<br />
third-order filter is used on the input stage, and a fourth-order filter<br />
is used on the output stage. For comparison, a third- and<br />
fourth-order static filter response highlights the significant rejection<br />
capability of the broadband filter. The filter sidelobe<br />
centered around 0.1 on the normalized scale is the Doppler component<br />
that passed the input stage filter and is not fully downconverted<br />
into the rejection notch of the output stage filter. This<br />
sidelobe will increase as the notch frequency is increased. Pulseto-pulse<br />
stagger degrades the low frequency stopband of the<br />
broadband filter and is not recommended for dynamic clutter<br />
cancellation. Rather, a group-to-group pulse stagger is recommended<br />
to alleviate the blind zone cancellations.<br />
IpI(n) = cos (2π f d<br />
. nt pr ) (13)<br />
IpQ(n) = sin (2π f d<br />
. nt pr ) (14)<br />
QpI(n) = sin (2π f d<br />
. nt pr ) (15)<br />
QpQ(n) = cos (2π f d<br />
. nt pr ) (16)<br />
e jn d<br />
Figure 5. Doppler clutter-locked MTI transfer<br />
function<br />
The expansion and collection of Equation 12 will result in two<br />
real terms and two imaginary summation terms. Each term will<br />
have the same weight distribution as shown in Figure 6 except<br />
for the replacement of the Doppler cross-modulation term. The<br />
subscript naming identifies how the weight vector contributes to<br />
r(n). The letter on the left indicates to which component the<br />
weight dot product contributes, and the letter on the right indicates<br />
the input component with which to be dot product.<br />
Equations 17 and 18 give the real and imaginary responses of<br />
r(n), respectively.<br />
Conclusion<br />
Metric System’s Peregrine is operated in a dynamic MTI mode<br />
configuration. It has an instrumented 100km range in a normal<br />
MTI mode using four-pulse static filtering with pulse-to-pulse<br />
staggering in favorable weather conditions. Log video is monitored<br />
for threshold switching into a 70km range special MTI<br />
mode when inclement weather, high seas, or chaff conditions are<br />
detected. Six-pulse dynamic clutter MTI suppression against<br />
moving volumetric clutter simultaneous with low velocity ground<br />
and heavy sea clutter is performed in special MTI mode. The<br />
adaptive broadband weights are computed and applied in an openloop<br />
fashion based on an accumulated log video clutter map that<br />
directs phase video sampling in appropriate sectors. Dynamic<br />
clutter characteristics typically have a velocity mean around ±20<br />
r(n) =<br />
p<br />
Σb 2 (k)<br />
l = 0<br />
q<br />
q<br />
Σ b 1 (k)x d (n – l – k) – j Σ b 1 (k)y d (n – l – k) e j(n – l) ω d (12)<br />
k = 0<br />
k = 0<br />
b 1 (q)b 2 (p)IpI(0)<br />
b 1 (q – 1)b 2 (p)IpI(0) + b 1 (q)b 2 (p – 1) IpI(1)<br />
.<br />
b 1 (0)b 2 (p)IpI(0) + b 1 (1)b 2 (p –1)IPI(1) + . . . +b 1 (q – 1)b 2 (1)IpI(p – 1) + b 1 (q)b 2 (0)IpI(p)<br />
.<br />
b 1 (0)b 2 (1)IpI(p – 1) +b 1 (1)b 2 (0)IpI(p)<br />
b 1 (0)b 2 (0)IpI(p)<br />
Figure 6. b IPI (k) weight vector, where k begins from top (0) to bottom (p+q)<br />
Re[r(n)]=<br />
Im[r(n)]=<br />
p + q<br />
p + q<br />
Σ b IPI (k)x d (n – k) + Σb IPQ (k)y d (n – k) (17)<br />
k = 0<br />
k = 0<br />
p + q<br />
p + q<br />
Σ b QPI (k)x d (n – k) + Σ b QPQ (k)y d (n – k) (18)<br />
k = 0<br />
k = 0<br />
Reprinted from <strong>VME</strong>bus Systems / <strong>Apr</strong>il 20<strong>02</strong><br />
Copyright 20<strong>02</strong> / <strong>VME</strong>bus Systems
dB<br />
0<br />
-10<br />
6th order<br />
clutter-locked<br />
3rd order static<br />
4th order static<br />
6th order<br />
clutter-locked<br />
stagger<br />
-20<br />
-30<br />
-40<br />
-50<br />
-60 0 0.5 1 1.5 2 2.5 3<br />
f<br />
f<br />
pr<br />
Figure 7. Doppler clutter-locked MTI response<br />
meters/sec with a spectrum width near 1 meter/sec. The filters are<br />
applied independently on the in-phase and quadrature-phase components.<br />
In addition, the Peregrine performs the matched correlation<br />
on these channels independently before applying its modulus.<br />
It uses hard-limited (binary), phase-coded pulse compression<br />
on a 17.65 ms pulse transmission at 63-bit or 127-bit resolution.<br />
Instrumented pulse repetition frequencies vary from 1200 Hz to<br />
1600 Hz, depending on mode, range, and stagger.<br />
The Peregrine signal processing cabinet consists of:<br />
■ A <strong>VME</strong>bus chassis using a VMIC VMI<strong>VME</strong>-7740 Pentium<br />
III based single-board bus master<br />
■ Two Pentek 4290 quad TMS320C6201 DSP boards<br />
■ A Metric-designed, RAM-based trigger generator card<br />
The VMIC board is clocked at 800 MHz running Windows2000<br />
real-time acquisition of the DSP results and synchronization of<br />
the triggers. Pentek’s 6211 12-bit A/D mezzanine modules sample<br />
two three-channel video signals (I, Q, and log video). A highelevation<br />
beam path and a low-elevation beam path provide<br />
improved target detection. All DSP algorithms are optimized<br />
using the Texas Instruments Code Composer Studio V1.20 and<br />
loaded using Pentek’s Swiftnet product. The post-processing programs<br />
for multiple clutter map classification, sliding window<br />
correlation detection, and plot extractions for tracking filter are<br />
compiled using Visual Studio 6.0.<br />
In summary, coherent phase video processing using Doppler filtering<br />
and pulse compression in dedicated DSP hardware is combined<br />
with log-detected clutter mapping and mode control to provide constant<br />
false alarm rate detections to non-coherent short-term detection<br />
and long-term clutter residue censor processes.<br />
References<br />
Eaves, Jerry L., and Edward K. Reedy, Principles of Modern Radar,<br />
Von Nostrand, 1987.<br />
Couch, Leon W., Digital and Analog Communication Systems, Prentice<br />
Hall, 1997.<br />
Kehtarnavaz, Nasser, and Burc Simsek, C6x-Based Digital Signal<br />
Processing, Prentice Hall, 2000.<br />
Hayes, Monson H., Digital Signal Processing, Schaum’s Outline Series,<br />
McGraw-Hill, 1999.<br />
Christopher Repesh is a senior signal processing engineer<br />
for Metric Systems, a specialized manufacturer of threatradar-simulator<br />
systems, airborne instrumentation, RF datalink<br />
communications, and tactical surveillance radar systems. He<br />
has been instrumental in re-engineering and migrating legacy<br />
video processing hardware in ITT Gilfillan’s FALCON to a<br />
COTS software-based solution. Prior to joining Metric Systems,<br />
Christopher was an associate research engineer with Mission<br />
Research Corporation, developing and employing advanced<br />
computational electromagnetic software to diagnose the effectiveness<br />
of operationally viable antenna designs and the effects<br />
of high-power EMP discharges. Christopher holds a BSEE<br />
from the University of Texas at Arlington and an MSEE from<br />
the University of Florida, Gainesville. He currently works in<br />
Fort Walton Beach, FL.<br />
For more information, contact:<br />
Metric Systems<br />
645 Anchors Street • Fort Walton Beach, FL 32548<br />
Tel: 850-3<strong>02</strong>-3000 • Fax: 850-3<strong>02</strong>-3371<br />
Web site: www.metricsys.com<br />
Reprinted from <strong>VME</strong>bus Systems / <strong>Apr</strong>il 20<strong>02</strong><br />
Copyright 20<strong>02</strong> / <strong>VME</strong>bus Systems