VME 2100 Apr 02 PDF - VITA Technologies
VME 2100 Apr 02 PDF - VITA Technologies
VME 2100 Apr 02 PDF - VITA Technologies

Create successful ePaper yourself
Turn your PDF publications into a flip-book with our unique Google optimized e-Paper software.
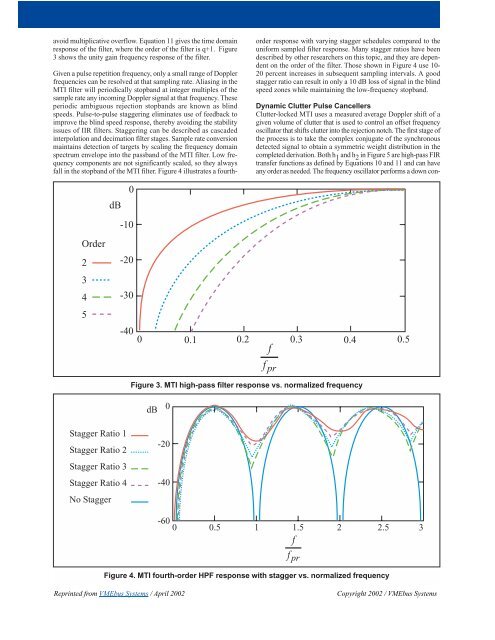
avoid multiplicative overflow. Equation 11 gives the time domain<br />
response of the filter, where the order of the filter is q+1. Figure<br />
3 shows the unity gain frequency response of the filter.<br />
Given a pulse repetition frequency, only a small range of Doppler<br />
frequencies can be resolved at that sampling rate. Aliasing in the<br />
MTI filter will periodically stopband at integer multiples of the<br />
sample rate any incoming Doppler signal at that frequency. These<br />
periodic ambiguous rejection stopbands are known as blind<br />
speeds. Pulse-to-pulse staggering eliminates use of feedback to<br />
improve the blind speed response, thereby avoiding the stability<br />
issues of IIR filters. Staggering can be described as cascaded<br />
interpolation and decimation filter stages. Sample rate conversion<br />
maintains detection of targets by scaling the frequency domain<br />
spectrum envelope into the passband of the MTI filter. Low frequency<br />
components are not significantly scaled, so they always<br />
fall in the stopband of the MTI filter. Figure 4 illustrates a fourthorder<br />
response with varying stagger schedules compared to the<br />
uniform sampled filter response. Many stagger ratios have been<br />
described by other researchers on this topic, and they are dependent<br />
on the order of the filter. Those shown in Figure 4 use 10-<br />
20 percent increases in subsequent sampling intervals. A good<br />
stagger ratio can result in only a 10 dB loss of signal in the blind<br />
speed zones while maintaining the low-frequency stopband.<br />
Dynamic Clutter Pulse Cancellers<br />
Clutter-locked MTI uses a measured average Doppler shift of a<br />
given volume of clutter that is used to control an offset frequency<br />
oscillator that shifts clutter into the rejection notch. The first stage of<br />
the process is to take the complex conjugate of the synchronous<br />
detected signal to obtain a symmetric weight distribution in the<br />
completed derivation. Both h 1 and h 2 in Figure 5 are high-pass FIR<br />
transfer functions as defined by Equations 10 and 11 and can have<br />
any order as needed. The frequency oscillator performs a down con-<br />
dB<br />
0<br />
-10<br />
Order<br />
2<br />
3<br />
4<br />
5<br />
-20<br />
-30<br />
-40<br />
0 0.1 0.2 0.3 0.4 0.5<br />
Figure 3. MTI high-pass filter response vs. normalized frequency<br />
f<br />
f<br />
pr<br />
dB<br />
0<br />
Stagger Ratio 1<br />
Stagger Ratio 2<br />
Stagger Ratio 3<br />
Stagger Ratio 4<br />
No Stagger<br />
-20<br />
-40<br />
-60 0 0.5 1 1.5 2 2.5 3<br />
Figure 4. MTI fourth-order HPF response with stagger vs. normalized frequency<br />
f<br />
f<br />
pr<br />
Reprinted from <strong>VME</strong>bus Systems / <strong>Apr</strong>il 20<strong>02</strong><br />
Copyright 20<strong>02</strong> / <strong>VME</strong>bus Systems