
You also want an ePaper? Increase the reach of your titles
YUMPU automatically turns print PDFs into web optimized ePapers that Google loves.
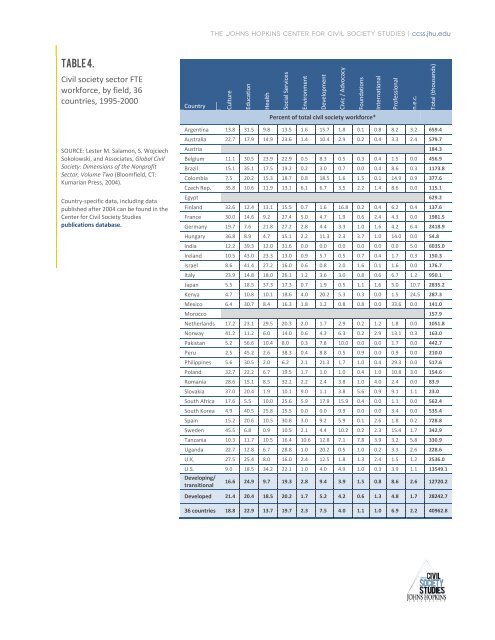
The Johns Hopkins Center for <strong>Civil</strong> <strong>Society</strong> Studies | ccss.jhu.edu<br />
table 4.<br />
<strong>Civil</strong> society sector FTE<br />
workforce, by field, 36<br />
countries, 1995-2000<br />
Country<br />
Culture<br />
Education<br />
Health<br />
Social Services<br />
Environment<br />
Development<br />
Civic / Advocacy<br />
Foundations<br />
International<br />
Professional<br />
n.e.c.<br />
Total (thousands)<br />
Percent of total civil society workforce*<br />
Argentina 13.8 31.5 9.8 13.5 1.6 15.7 1.8 0.1 0.8 8.2 3.2 659.4<br />
Australia 22.7 17.9 14.9 23.6 1.4 10.4 2.9 0.2 0.4 3.3 2.4 579.7<br />
SOURCE: Lester M. Salamon, S. Wojciech<br />
Sokolowski, and Associates, <strong>Global</strong> <strong>Civil</strong><br />
<strong>Society</strong>: Dimensions of the Nonprofit<br />
Sector, Volume Two (Bloomfield, CT:<br />
Kumarian Press, 2004).<br />
Country-specific data, including data<br />
published after 2004 can be found in the<br />
Center for <strong>Civil</strong> <strong>Society</strong> Studies<br />
publications database.<br />
Austria 184.3<br />
Belgium 11.1 30.5 23.9 22.9 0.5 8.3 0.5 0.3 0.4 1.5 0.0 456.9<br />
Brazil 15.1 35.1 17.5 19.2 0.2 3.0 0.7 0.0 0.4 8.6 0.3 1173.8<br />
Colombia 7.5 20.2 15.3 18.7 0.8 18.5 1.6 1.5 0.1 14.9 0.9 377.6<br />
Czech Rep. 35.8 10.6 11.9 13.1 6.1 6.7 3.5 2.2 1.4 8.6 0.0 115.1<br />
Egypt 629.2<br />
Finland 32.6 12.4 13.1 15.5 0.7 1.6 16.8 0.2 0.4 6.2 0.4 137.6<br />
France 30.0 14.6 9.2 27.4 5.0 4.7 1.9 0.6 2.4 4.3 0.0 1981.5<br />
Germany 19.7 7.6 21.8 27.2 2.8 4.4 3.3 1.0 1.6 4.2 6.4 2418.9<br />
Hungary 36.8 8.9 4.7 15.1 2.2 11.3 2.3 3.7 1.0 14.0 0.0 54.8<br />
India 12.2 39.3 12.0 31.6 0.0 0.0 0.0 0.0 0.0 0.0 5.0 6035.0<br />
Ireland 10.5 43.0 23.3 13.0 0.9 5.7 0.5 0.7 0.4 1.7 0.3 150.3<br />
Israel 8.6 41.4 27.2 16.0 0.6 0.8 2.0 1.6 0.1 1.6 0.0 176.7<br />
Italy 23.9 14.8 18.0 26.1 1.2 3.6 3.0 0.8 0.6 6.7 1.2 950.1<br />
Japan 5.5 18.5 37.3 17.3 0.7 1.9 0.5 1.1 1.6 5.0 10.7 2835.2<br />
Kenya 4.7 10.8 10.1 18.6 4.0 20.2 5.3 0.3 0.0 1.5 24.5 287.3<br />
Mexico 6.4 30.7 8.4 16.3 1.8 1.2 0.8 0.8 0.0 33.6 0.0 141.0<br />
Morocco 157.9<br />
Netherlands 17.2 23.1 29.5 20.3 2.0 1.7 2.9 0.2 1.2 1.8 0.0 1051.8<br />
Norway 41.2 11.2 6.0 14.0 0.6 4.3 6.3 0.2 2.9 13.1 0.3 163.0<br />
Pakistan 5.2 56.6 10.4 8.0 0.3 7.8 10.0 0.0 0.0 1.7 0.0 442.7<br />
Peru 2.5 45.2 2.6 38.3 0.4 8.8 0.5 0.9 0.0 0.9 0.0 210.0<br />
Philippines 5.6 30.5 2.0 6.2 2.1 21.3 1.7 1.0 0.4 29.3 0.0 517.6<br />
Poland 32.7 22.2 6.7 19.5 1.7 1.0 1.0 0.4 1.0 10.8 3.0 154.6<br />
Romania 28.6 15.1 8.5 32.2 2.2 2.4 3.8 1.0 4.0 2.4 0.0 83.9<br />
Slovakia 37.0 20.4 1.9 10.1 9.0 1.1 3.8 5.6 0.9 9.1 1.1 23.0<br />
South Africa 17.6 5.5 10.0 25.6 5.9 17.9 15.9 0.4 0.0 1.1 0.0 562.4<br />
South Korea 4.9 40.5 25.8 15.5 0.0 0.0 9.9 0.0 0.0 3.4 0.0 535.4<br />
Spain 15.2 20.6 10.5 30.8 3.0 9.2 5.9 0.1 2.6 1.8 0.2 728.8<br />
Sweden 45.5 6.8 0.9 10.5 2.1 4.4 10.2 0.2 2.3 15.4 1.7 342.9<br />
Tanzania 10.3 11.7 10.5 16.4 10.6 12.8 7.1 7.8 3.9 3.2 5.8 330.9<br />
Uganda 22.7 12.8 6.7 28.8 1.0 20.2 0.5 1.0 0.2 3.3 2.6 228.6<br />
U.K. 27.5 25.4 8.0 16.0 2.4 12.5 1.8 1.3 2.4 1.5 1.2 2536.0<br />
U.S. 9.0 18.5 34.2 22.1 1.0 4.0 4.9 1.0 0.3 3.9 1.1 13549.1<br />
Developing/<br />
transitional<br />
16.6 24.9 9.7 19.3 2.8 9.4 3.9 1.5 0.8 8.6 2.6 12720.2<br />
Developed 21.4 20.4 18.5 20.2 1.7 5.2 4.2 0.6 1.3 4.8 1.7 28242.7<br />
36 countries 18.8 22.9 13.7 19.7 2.3 7.5 4.0 1.1 1.0 6.9 2.2 40962.8