
Create successful ePaper yourself
Turn your PDF publications into a flip-book with our unique Google optimized e-Paper software.
The Johns Hopkins Center for <strong>Civil</strong> <strong>Society</strong> Studies | ccss.jhu.edu<br />
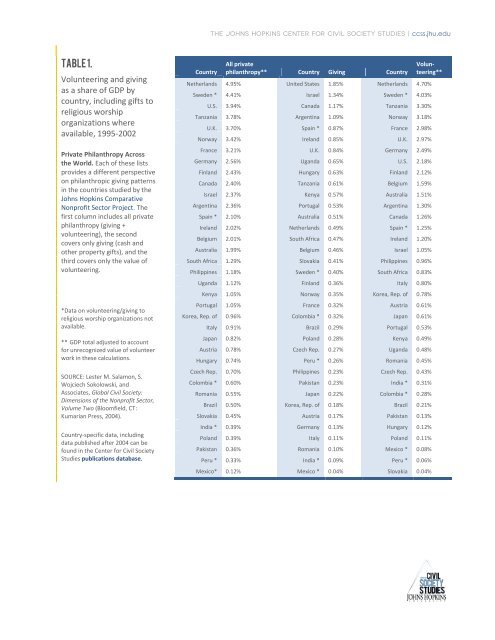
table 1.<br />
Volunteering and giving<br />
as a share of GDP by<br />
country, including gifts to<br />
religious worship<br />
organizations where<br />
available, 1995-2002<br />
Private Philanthropy Across<br />
the World. Each of these lists<br />
provides a different perspective<br />
on philanthropic giving patterns<br />
in the countries studied by the<br />
Johns Hopkins Comparative<br />
Nonprofit Sector Project. The<br />
first column includes all private<br />
philanthropy (giving +<br />
volunteering), the second<br />
covers only giving (cash and<br />
other property gifts), and the<br />
third covers only the value of<br />
volunteering.<br />
*Data on volunteering/giving to<br />
religious worship organizations not<br />
available.<br />
** GDP total adjusted to account<br />
for unrecognized value of volunteer<br />
work in these calculations.<br />
SOURCE: Lester M. Salamon, S.<br />
Wojciech Sokolowski, and<br />
Associates, <strong>Global</strong> <strong>Civil</strong> <strong>Society</strong>:<br />
Dimensions of the Nonprofit Sector,<br />
Volume Two (Bloomfield, CT:<br />
Kumarian Press, 2004).<br />
Country-specific data, including<br />
data published after 2004 can be<br />
found in the Center for <strong>Civil</strong> <strong>Society</strong><br />
Studies publications database.<br />
Country<br />
All private<br />
philanthropy** Country Giving Country<br />
Volunteering**<br />
Netherlands 4.95% United States 1.85% Netherlands 4.70%<br />
Sweden * 4.41% Israel 1.34% Sweden * 4.03%<br />
U.S. 3.94% Canada 1.17% Tanzania 3.30%<br />
Tanzania 3.78% Argentina 1.09% Norway 3.18%<br />
U.K. 3.70% Spain * 0.87% France 2.98%<br />
Norway 3.42% Ireland 0.85% U.K. 2.97%<br />
France 3.21% U.K. 0.84% Germany 2.49%<br />
Germany 2.56% Uganda 0.65% U.S. 2.18%<br />
Finland 2.43% Hungary 0.63% Finland 2.12%<br />
Canada 2.40% Tanzania 0.61% Belgium 1.59%<br />
Israel 2.37% Kenya 0.57% Australia 1.51%<br />
Argentina 2.36% Portugal 0.53% Argentina 1.30%<br />
Spain * 2.10% Australia 0.51% Canada 1.26%<br />
Ireland 2.02% Netherlands 0.49% Spain * 1.25%<br />
Belgium 2.01% South Africa 0.47% Ireland 1.20%<br />
Australia 1.99% Belgium 0.46% Israel 1.05%<br />
South Africa 1.29% Slovakia 0.41% Philippines 0.96%<br />
Philippines 1.18% Sweden * 0.40% South Africa 0.83%<br />
Uganda 1.12% Finland 0.36% Italy 0.80%<br />
Kenya 1.05% Norway 0.35% Korea, Rep. of 0.78%<br />
Portugal 1.05% France 0.32% Austria 0.61%<br />
Korea, Rep. of 0.96% Colombia * 0.32% Japan 0.61%<br />
Italy 0.91% Brazil 0.29% Portugal 0.53%<br />
Japan 0.82% Poland 0.28% Kenya 0.49%<br />
Austria 0.78% Czech Rep. 0.27% Uganda 0.48%<br />
Hungary 0.74% Peru * 0.26% Romania 0.45%<br />
Czech Rep. 0.70% Philippines 0.23% Czech Rep. 0.43%<br />
Colombia * 0.60% Pakistan 0.23% India * 0.31%<br />
Romania 0.55% Japan 0.22% Colombia * 0.28%<br />
Brazil 0.50% Korea, Rep. of 0.18% Brazil 0.21%<br />
Slovakia 0.45% Austria 0.17% Pakistan 0.13%<br />
India * 0.39% Germany 0.13% Hungary 0.12%<br />
Poland 0.39% Italy 0.11% Poland 0.11%<br />
Pakistan 0.36% Romania 0.10% Mexico * 0.08%<br />
Peru * 0.33% India * 0.09% Peru * 0.06%<br />
Mexico* 0.12% Mexico * 0.04% Slovakia 0.04%
The Johns Hopkins Center for <strong>Civil</strong> <strong>Society</strong> Studies | ccss.jhu.edu<br />
table 2.<br />
<strong>Civil</strong> society sector workforce* as a<br />
percent of the economically active<br />
population, 36 countries, 1995-<br />
2000<br />
*Excludes religious worship organizations.<br />
SOURCE: Lester M. Salamon, S. Wojciech<br />
Sokolowski, and Associates, <strong>Global</strong> <strong>Civil</strong> <strong>Society</strong>:<br />
Dimensions of the Nonprofit Sector, Volume Two<br />
(Bloomfield, CT: Kumarian Press, 2004).<br />
Country-specific data, including data published<br />
after 2004 can be found in the Center for <strong>Civil</strong><br />
<strong>Society</strong> Studies publications database.<br />
Country Paid staff Volunteers Total<br />
Argentina 2.93% 1.90% 4.84%<br />
Australia 4.43% 1.90% 6.33%<br />
Austria 3.84% 1.07% 4.92%<br />
Belgium 8.62% 2.32% 10.93%<br />
Brazil 1.43% 0.19% 1.62%<br />
Colombia 1.79% 0.56% 2.36%<br />
Czech Rep. 1.32% 0.72% 2.04%<br />
Egypt 2.73% 0.08% 2.81%<br />
Finland 2.42% 2.77% 5.25%<br />
France 3.70% 3.75% 7.55%<br />
Germany 3.54% 2.33% 5.89%<br />
Hungary 0.94% 0.21% 1.15%<br />
India 0.60% 0.76% 1.36%<br />
Ireland 8.28% 2.15% 10.42%<br />
Israel 6.61% 1.40% 8.00%<br />
Italy 2.26% 1.49% 3.76%<br />
Japan 3.19% 1.02% 4.21%<br />
Kenya 1.29% 0.82% 2.11%<br />
Mexico 0.26% 0.13% 0.40%<br />
Morocco 0.72% 0.79% 1.52%<br />
Netherlands 9.21% 5.07% 14.40%<br />
Norway 2.69% 4.35% 7.20%<br />
Pakistan 0.59% 0.40% 0.99%<br />
Peru 1.55% 0.94% 2.50%<br />
Philippines 0.68% 1.18% 1.88%<br />
Poland 0.64% 0.17% 0.80%<br />
Romania 0.35% 0.44% 0.79%<br />
Slovakia 0.57% 0.24% 0.82%<br />
South Africa 1.84% 1.59% 3.45%<br />
South Korea 1.88% 0.55% 2.43%<br />
Spain 2.82% 1.48% 4.31%<br />
Sweden 1.74% 5.11% 7.10%<br />
Tanzania 0.52% 1.54% 2.08%<br />
Uganda 0.92% 1.33% 2.27%<br />
United Kingdom 4.84% 3.63% 8.54%<br />
United States 6.28% 3.49% 9.80%<br />
Developing / transitional 1.18% 0.73% 1.91%<br />
Developed 4.65% 2.71% 7.41%<br />
36 country average 2.72% 1.61% 4.36%
The Johns Hopkins Center for <strong>Civil</strong> <strong>Society</strong> Studies | ccss.jhu.edu<br />
table 3.<br />
Volunteering, 36 countries,<br />
1995-2000<br />
*See methodological appendix for estimating<br />
procedures.<br />
SOURCE: Lester M. Salamon, S. Wojciech<br />
Sokolowski, and Associates, <strong>Global</strong> <strong>Civil</strong> <strong>Society</strong>:<br />
Dimensions of the Nonprofit Sector, Volume Two<br />
(Bloomfield, CT: Kumarian Press, 2004).<br />
Country-specific data, including data published<br />
after 2004 can be found in the Center for <strong>Civil</strong><br />
<strong>Society</strong> Studies publications database.<br />
Value of<br />
volunteer work<br />
People volunteering*<br />
Country (millions US $)<br />
number percent of<br />
(thousands) adult population<br />
Argentina $2,693.2 1,913 8%<br />
Australia $4,484.8 1,832 13%<br />
Austria $1,380.4 550 8%<br />
Belgium $4,197.7 809 10%<br />
Brazil $754.1 6,483 6%<br />
Colombia $229.1 1,149 5%<br />
Czech Rep. $196.4 381 5%<br />
Egypt $22.1 233 1%<br />
Finland $2,657.5 326 8%<br />
France $41,929.6 6,536 14%<br />
Germany $48,433.0 7,071 10%<br />
Hungary $49.7 277 3%<br />
India $1,355.9 16,490 2%<br />
Ireland $715.6 293 11%<br />
Israel $894.7 235 6%<br />
Italy $8,290.7 2,048 4%<br />
Japan $23,354.8 485 0.5%<br />
Kenya $52.0 955 6%<br />
Mexico $219.6 30 0.1%<br />
Morocco $98.4 699 4%<br />
Netherlands $16,991.6 1,962 16%<br />
Norway $4,255.8 1,847 52%<br />
Pakistan $68.1 133 0.2%<br />
Peru $38.2 729 5%<br />
Philippines $775.9 2,833 6%<br />
Poland $150.8 3,614 12%<br />
Romania $155.0 325 2%<br />
Slovakia $7.3 149 4%<br />
South Africa $960.5 2,659 9%<br />
South Korea $2,433.2 1,204 3%<br />
Spain $7,055.1 1,681 5%<br />
Sweden $10,206.1 2,009 28%<br />
Tanzania $289.5 2,092 11%<br />
Uganda $30.5 2,606 23%<br />
United Kingdom $21,976.2 14,357 30%<br />
United States $109,012.6 44,564 22%<br />
Total $316,415.6 131,557 -<br />
Developing / transitional country average 6%<br />
Developed country average - 15%<br />
All-country average - 10%
The Johns Hopkins Center for <strong>Civil</strong> <strong>Society</strong> Studies | ccss.jhu.edu<br />
table 4.<br />
<strong>Civil</strong> society sector FTE<br />
workforce, by field, 36<br />
countries, 1995-2000<br />
Country<br />
Culture<br />
Education<br />
Health<br />
Social Services<br />
Environment<br />
Development<br />
Civic / Advocacy<br />
Foundations<br />
International<br />
Professional<br />
n.e.c.<br />
Total (thousands)<br />
Percent of total civil society workforce*<br />
Argentina 13.8 31.5 9.8 13.5 1.6 15.7 1.8 0.1 0.8 8.2 3.2 659.4<br />
Australia 22.7 17.9 14.9 23.6 1.4 10.4 2.9 0.2 0.4 3.3 2.4 579.7<br />
SOURCE: Lester M. Salamon, S. Wojciech<br />
Sokolowski, and Associates, <strong>Global</strong> <strong>Civil</strong><br />
<strong>Society</strong>: Dimensions of the Nonprofit<br />
Sector, Volume Two (Bloomfield, CT:<br />
Kumarian Press, 2004).<br />
Country-specific data, including data<br />
published after 2004 can be found in the<br />
Center for <strong>Civil</strong> <strong>Society</strong> Studies<br />
publications database.<br />
Austria 184.3<br />
Belgium 11.1 30.5 23.9 22.9 0.5 8.3 0.5 0.3 0.4 1.5 0.0 456.9<br />
Brazil 15.1 35.1 17.5 19.2 0.2 3.0 0.7 0.0 0.4 8.6 0.3 1173.8<br />
Colombia 7.5 20.2 15.3 18.7 0.8 18.5 1.6 1.5 0.1 14.9 0.9 377.6<br />
Czech Rep. 35.8 10.6 11.9 13.1 6.1 6.7 3.5 2.2 1.4 8.6 0.0 115.1<br />
Egypt 629.2<br />
Finland 32.6 12.4 13.1 15.5 0.7 1.6 16.8 0.2 0.4 6.2 0.4 137.6<br />
France 30.0 14.6 9.2 27.4 5.0 4.7 1.9 0.6 2.4 4.3 0.0 1981.5<br />
Germany 19.7 7.6 21.8 27.2 2.8 4.4 3.3 1.0 1.6 4.2 6.4 2418.9<br />
Hungary 36.8 8.9 4.7 15.1 2.2 11.3 2.3 3.7 1.0 14.0 0.0 54.8<br />
India 12.2 39.3 12.0 31.6 0.0 0.0 0.0 0.0 0.0 0.0 5.0 6035.0<br />
Ireland 10.5 43.0 23.3 13.0 0.9 5.7 0.5 0.7 0.4 1.7 0.3 150.3<br />
Israel 8.6 41.4 27.2 16.0 0.6 0.8 2.0 1.6 0.1 1.6 0.0 176.7<br />
Italy 23.9 14.8 18.0 26.1 1.2 3.6 3.0 0.8 0.6 6.7 1.2 950.1<br />
Japan 5.5 18.5 37.3 17.3 0.7 1.9 0.5 1.1 1.6 5.0 10.7 2835.2<br />
Kenya 4.7 10.8 10.1 18.6 4.0 20.2 5.3 0.3 0.0 1.5 24.5 287.3<br />
Mexico 6.4 30.7 8.4 16.3 1.8 1.2 0.8 0.8 0.0 33.6 0.0 141.0<br />
Morocco 157.9<br />
Netherlands 17.2 23.1 29.5 20.3 2.0 1.7 2.9 0.2 1.2 1.8 0.0 1051.8<br />
Norway 41.2 11.2 6.0 14.0 0.6 4.3 6.3 0.2 2.9 13.1 0.3 163.0<br />
Pakistan 5.2 56.6 10.4 8.0 0.3 7.8 10.0 0.0 0.0 1.7 0.0 442.7<br />
Peru 2.5 45.2 2.6 38.3 0.4 8.8 0.5 0.9 0.0 0.9 0.0 210.0<br />
Philippines 5.6 30.5 2.0 6.2 2.1 21.3 1.7 1.0 0.4 29.3 0.0 517.6<br />
Poland 32.7 22.2 6.7 19.5 1.7 1.0 1.0 0.4 1.0 10.8 3.0 154.6<br />
Romania 28.6 15.1 8.5 32.2 2.2 2.4 3.8 1.0 4.0 2.4 0.0 83.9<br />
Slovakia 37.0 20.4 1.9 10.1 9.0 1.1 3.8 5.6 0.9 9.1 1.1 23.0<br />
South Africa 17.6 5.5 10.0 25.6 5.9 17.9 15.9 0.4 0.0 1.1 0.0 562.4<br />
South Korea 4.9 40.5 25.8 15.5 0.0 0.0 9.9 0.0 0.0 3.4 0.0 535.4<br />
Spain 15.2 20.6 10.5 30.8 3.0 9.2 5.9 0.1 2.6 1.8 0.2 728.8<br />
Sweden 45.5 6.8 0.9 10.5 2.1 4.4 10.2 0.2 2.3 15.4 1.7 342.9<br />
Tanzania 10.3 11.7 10.5 16.4 10.6 12.8 7.1 7.8 3.9 3.2 5.8 330.9<br />
Uganda 22.7 12.8 6.7 28.8 1.0 20.2 0.5 1.0 0.2 3.3 2.6 228.6<br />
U.K. 27.5 25.4 8.0 16.0 2.4 12.5 1.8 1.3 2.4 1.5 1.2 2536.0<br />
U.S. 9.0 18.5 34.2 22.1 1.0 4.0 4.9 1.0 0.3 3.9 1.1 13549.1<br />
Developing/<br />
transitional<br />
16.6 24.9 9.7 19.3 2.8 9.4 3.9 1.5 0.8 8.6 2.6 12720.2<br />
Developed 21.4 20.4 18.5 20.2 1.7 5.2 4.2 0.6 1.3 4.8 1.7 28242.7<br />
36 countries 18.8 22.9 13.7 19.7 2.3 7.5 4.0 1.1 1.0 6.9 2.2 40962.8
The Johns Hopkins Center for <strong>Civil</strong> <strong>Society</strong> Studies | ccss.jhu.edu<br />
table 5.<br />
<strong>Civil</strong> society sector sources of<br />
support, with and without<br />
volunteers, 34 countries,<br />
1995-2000<br />
SOURCE: Lester M. Salamon, S. Wojciech<br />
Sokolowski, and Associates, <strong>Global</strong> <strong>Civil</strong><br />
<strong>Society</strong>: Dimensions of the Nonprofit<br />
Sector, Volume Two (Bloomfield, CT:<br />
Kumarian Press, 2004).<br />
Country-specific data, including data<br />
published after 2004 can be found in the<br />
Center for <strong>Civil</strong> <strong>Society</strong> Studies<br />
publications database.<br />
Country<br />
Government<br />
Philanthropy<br />
Fees<br />
Millions<br />
US$<br />
Government<br />
Philanthropy<br />
Fees<br />
Millions<br />
US$<br />
Argentina 19.5% 7.5% 73.1% $13,321 16.2% 23.0% 60.8% $16,014<br />
Australia 31.2% 6.3% 62.5% $19,810 25.4% 23.6% 51.0% $24,295<br />
Austria 50.4% 6.1% 43.5% $6,262 41.3% 23.1% 35.6% $7,643<br />
Belgium 76.8% 4.7% 18.6% $25,576 65.9% 18.1% 16.0% $29,773<br />
Brazil 15.5% 10.7% 73.8% $11,390 14.5% 16.3% 69.2% $12,144<br />
Colombia 14.9% 14.9% 70.2% $1,719 13.1% 24.9% 62.0% $1,948<br />
Czech Rep. 39.4% 14.0% 46.6% $860 32.1% 30.0% 37.9% $1,056<br />
Finland 36.2% 5.9% 57.9% $6,064 25.2% 34.6% 40.3% $8,722<br />
France 57.8% 7.5% 34.6% $57,304 33.4% 46.6% 20.0% $99,234<br />
Germany 64.3% 3.4% 32.3% $94,454 42.5% 36.2% 21.3% $142,887<br />
Hungary 27.1% 18.4% 54.6% $1,433 26.2% 21.1% 52.7% $1,483<br />
India 36.1% 12.9% 51.0% $3,026 24.9% 39.9% 35.2% $4,382<br />
Ireland 77.2% 7.0% 15.8% $5,017 67.6% 18.6% 13.8% $5,732<br />
Israel 63.9% 10.2% 25.8% $10,947 59.1% 17.0% 23.9% $11,842<br />
Italy 36.6% 2.8% 60.6% $39,356 30.2% 19.7% 50.1% $47,647<br />
Japan 45.2% 2.6% 52.1% $258,959 41.5% 10.7% 47.8% $282,314<br />
Kenya 4.8% 14.2% 81.0% $404 4.3% 23.9% 71.8% $456<br />
Mexico 8.5% 6.3% 85.2% $1,554 7.5% 17.9% 74.7% $1,774<br />
Netherlands 59.0% 2.4% 38.6% $60,399 46.1% 23.9% 30.1% $77,391<br />
Norway 35.0% 6.9% 58.1% $5,640 20.0% 46.9% 33.1% $9,895<br />
Pakistan 6.0% 42.9% 51.1% $310 4.9% 53.1% 41.9% $378<br />
Peru 18.1% 12.2% 69.8% $1,272 17.5% 14.7% 67.7% $1,310<br />
Philippines 5.2% 3.2% 91.6% $1,103 3.1% 43.2% 53.7% $1,878<br />
Poland 24.1% 15.5% 60.4% $2,620 22.8% 20.1% 57.1% $2,771<br />
Romania 45.0% 26.5% 28.5% $130 20.5% 66.5% 13.0% $285<br />
Slovakia 21.9% 23.3% 54.9% $295 21.3% 25.1% 53.5% $302<br />
South Africa 44.2% 24.2% 31.7% $2,386 31.5% 45.9% 22.6% $3,346<br />
South Korea 24.3% 4.4% 71.4% $19,753 21.6% 14.9% 63.5% $22,186<br />
Spain 32.1% 18.8% 49.0% $25,778 25.2% 36.3% 38.5% $32,833<br />
Sweden 28.7% 9.1% 62.3% $10,599 14.6% 53.7% 31.7% $20,805<br />
Tanzania 27.0% 20.0% 53.1% $263 12.8% 61.9% 25.3% $552<br />
Uganda 7.1% 38.2% 54.7% $108 5.5% 51.8% 42.7% $139<br />
U.K. 46.7% 8.8% 44.6% $78,220 36.4% 28.8% 34.8% $100,196<br />
U.S. 30.5% 12.9% 56.6% $566,960 25.6% 26.9% 47.4% $675,973<br />
Developing/<br />
transitional 21.6% 17.2% 61.3% - 16.7% 33.0% 50.3% -<br />
Developed 48.2% 7.2% 44.6% - 37.5% 29.0% 33.5% -<br />
34 countries 34.1% 12.5% 53.4% - 26.5% 31.1% 42.4% -
The Johns Hopkins Center for <strong>Civil</strong> <strong>Society</strong> Studies | ccss.jhu.edu<br />
Figure 1.<br />
<strong>Civil</strong> society organization<br />
workforce as a share of the<br />
economically active<br />
population, by country,<br />
1995-2000<br />
36 countries<br />
Netherlands<br />
Belgium<br />
Ireland<br />
U.S.<br />
U.K.<br />
4.4%<br />
8.5%<br />
10.9%<br />
10.4%<br />
9.8%<br />
14.4%<br />
Israel<br />
8.0%<br />
France<br />
7.6%<br />
SOURCE: Lester M. Salamon, S.<br />
Wojciech Sokolowski, and Associates,<br />
<strong>Global</strong> <strong>Civil</strong> <strong>Society</strong>: Dimensions of the<br />
Nonprofit Sector, Volume Two<br />
(Bloomfield, CT: Kumarian Press,<br />
2004).<br />
Norway<br />
Sweden<br />
Australia<br />
Germany<br />
7.2%<br />
7.1%<br />
6.3%<br />
5.9%<br />
Country-specific data, including data<br />
published after 2004 can be found in<br />
the Center for <strong>Civil</strong> <strong>Society</strong> Studies<br />
publications database.<br />
Finland<br />
Austria<br />
Argentina<br />
Spain<br />
5.3%<br />
4.9%<br />
4.8%<br />
4.3%<br />
Japan<br />
4.2%<br />
Italy<br />
3.8%<br />
South Africa<br />
3.4%<br />
Egypt<br />
2.8%<br />
Peru<br />
2.5%<br />
South Korea<br />
2.4%<br />
Colombia<br />
2.4%<br />
Uganda<br />
2.3%<br />
Kenya<br />
2.1%<br />
Tanzania<br />
2.1%<br />
Czech Rep.<br />
2.0%<br />
Philippines<br />
1.9%<br />
Brazil<br />
1.6%<br />
Morocco<br />
1.5%<br />
Paid staff<br />
India<br />
Hungary<br />
1.4%<br />
1.1%<br />
Volunteers<br />
Pakistan<br />
1.0%<br />
Slovakia<br />
0.8%<br />
Poland<br />
0.8%<br />
Romania<br />
0.8%<br />
Mexico<br />
0.4%<br />
Percent of economically active population
The Johns Hopkins Center for <strong>Civil</strong> <strong>Society</strong> Studies | ccss.jhu.edu<br />
Figure 2.<br />
<strong>Civil</strong> society organization<br />
workforce as a share of the<br />
economically active population,<br />
by level of development, 1995-<br />
2000<br />
36-country<br />
average<br />
2.7%<br />
1.6%<br />
4.4%<br />
SOURCE: Lester M. Salamon, S. Wojciech<br />
Sokolowski, and Associates, <strong>Global</strong> <strong>Civil</strong><br />
<strong>Society</strong>: Dimensions of the Nonprofit Sector,<br />
Volume Two (Bloomfield, CT: Kumarian Press,<br />
2004).<br />
Developed<br />
countries<br />
4.7%<br />
2.7%<br />
7.4%<br />
Country-specific data, including data<br />
published after 2004 can be found in the<br />
Center for <strong>Civil</strong> <strong>Society</strong> Studies publications<br />
database.<br />
Developing and<br />
transitional<br />
countries<br />
1.2%<br />
0.7%<br />
1.9%<br />
Paid staff<br />
Volunteers<br />
Percent of economically active population