Modeling of Biogas Reactors
Modeling of Biogas Reactors
Modeling of Biogas Reactors

You also want an ePaper? Increase the reach of your titles
YUMPU automatically turns print PDFs into web optimized ePapers that Google loves.
180 6 <strong>Modeling</strong> <strong>of</strong> <strong>Biogas</strong> <strong>Reactors</strong><br />
usual range <strong>of</strong> substrate concentrations. If the system was heavily overloaded for<br />
some time and was out <strong>of</strong> the described range, the microbial population might need<br />
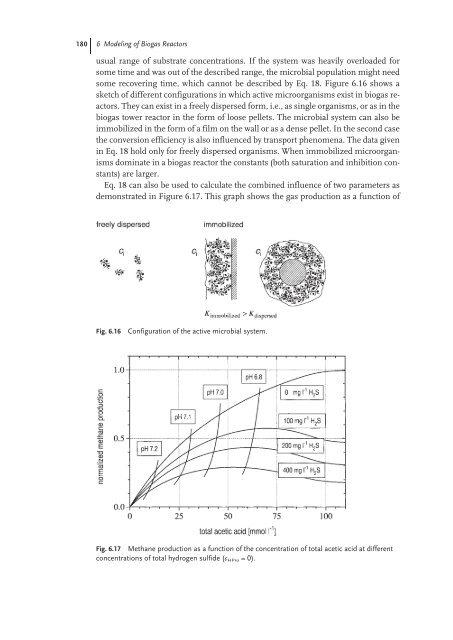
some recovering time, which cannot be described by Eq. 18. Figure 6.16 shows a<br />
sketch <strong>of</strong> different configurations in which active microorganisms exist in biogas reactors.<br />
They can exist in a freely dispersed form, i.e., as single organisms, or as in the<br />
biogas tower reactor in the form <strong>of</strong> loose pellets. The microbial system can also be<br />
immobilized in the form <strong>of</strong> a film on the wall or as a dense pellet. In the second case<br />
the conversion efficiency is also influenced by transport phenomena. The data given<br />
in Eq. 18 hold only for freely dispersed organisms. When immobilized microorganisms<br />
dominate in a biogas reactor the constants (both saturation and inhibition constants)<br />
are larger.<br />
Eq. 18 can also be used to calculate the combined influence <strong>of</strong> two parameters as<br />
demonstrated in Figure 6.17. This graph shows the gas production as a function <strong>of</strong><br />
Fig. 6.16 Configuration <strong>of</strong> the active microbial system.<br />
Fig. 6.17 Methane production as a function <strong>of</strong> the concentration <strong>of</strong> total acetic acid at different<br />
concentrations <strong>of</strong> total hydrogen sulfide (c HPro = 0).