Emergy as a tool for Ecodesign - Advances In Cleaner Production
Emergy as a tool for Ecodesign - Advances In Cleaner Production
Emergy as a tool for Ecodesign - Advances In Cleaner Production

Create successful ePaper yourself
Turn your PDF publications into a flip-book with our unique Google optimized e-Paper software.
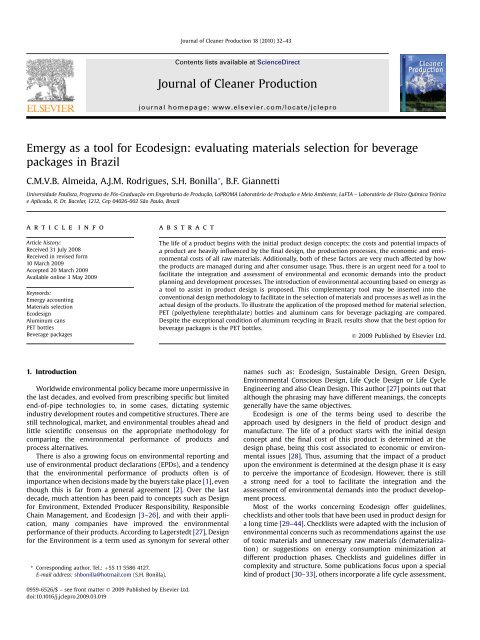
Journal of <strong>Cleaner</strong> <strong>Production</strong> 18 (2010) 32–43<br />
Contents lists available at ScienceDirect<br />
Journal of <strong>Cleaner</strong> <strong>Production</strong><br />
journal homepage: www.elsevier.com/locate/jclepro<br />
<strong>Emergy</strong> <strong>as</strong> a <strong>tool</strong> <strong>for</strong> <strong>Ecodesign</strong>: evaluating materials selection <strong>for</strong> beverage<br />
packages in Brazil<br />
C.M.V.B. Almeida, A.J.M. Rodrigues, S.H. Bonilla * , B.F. Giannetti<br />
Universidade Paulista, Programa de Pós-Graduação em Engenharia de Produção, LaPROMA Laboratório de Produção e Meio Ambiente, LaFTA – Laboratório de Físico Química Teórica<br />
e Aplicada, R. Dr. Bacelar, 1212, Cep 04026-002 São Paulo, Brazil<br />
article<br />
info<br />
abstract<br />
Article history:<br />
Received 31 July 2008<br />
Received in revised <strong>for</strong>m<br />
10 March 2009<br />
Accepted 20 March 2009<br />
Available online 3 May 2009<br />
Keywords:<br />
<strong>Emergy</strong> accounting<br />
Materials selection<br />
<strong>Ecodesign</strong><br />
Aluminum cans<br />
PET bottles<br />
Beverage packages<br />
The life of a product begins with the initial product design concepts; the costs and potential impacts of<br />
a product are heavily influenced by the final design, the production processes, the economic and environmental<br />
costs of all raw materials. Additionally, both of these factors are very much affected by how<br />
the products are managed during and after consumer usage. Thus, there is an urgent need <strong>for</strong> a <strong>tool</strong> to<br />
facilitate the integration and <strong>as</strong>sessment of environmental and economic demands into the product<br />
planning and development processes. The introduction of environmental accounting b<strong>as</strong>ed on emergy <strong>as</strong><br />
a <strong>tool</strong> to <strong>as</strong>sist in product design is proposed. This complementary <strong>tool</strong> may be inserted into the<br />
conventional design methodology to facilitate in the selection of materials and processes <strong>as</strong> well <strong>as</strong> in the<br />
actual design of the products. To illustrate the application of the proposed method <strong>for</strong> material selection,<br />
PET (polyethylene terephthalate) bottles and aluminum cans <strong>for</strong> beverage packaging are compared.<br />
Despite the exceptional condition of aluminum recycling in Brazil, results show that the best option <strong>for</strong><br />
beverage packages is the PET bottles.<br />
Ó 2009 Published by Elsevier Ltd.<br />
1. <strong>In</strong>troduction<br />
Worldwide environmental policy became more unpermissive in<br />
the l<strong>as</strong>t decades, and evolved from prescribing specific but limited<br />
end-of-pipe technologies to, in some c<strong>as</strong>es, dictating systemic<br />
industry development routes and competitive structures. There are<br />
still technological, market, and environmental troubles ahead and<br />
little scientific consensus on the appropriate methodology <strong>for</strong><br />
comparing the environmental per<strong>for</strong>mance of products and<br />
process alternatives.<br />
There is also a growing focus on environmental reporting and<br />
use of environmental product declarations (EPDs), and a tendency<br />
that the environmental per<strong>for</strong>mance of products often is of<br />
importance when decisions made by the buyers take place [1], even<br />
though this is far from a general agreement [2]. Over the l<strong>as</strong>t<br />
decade, much attention h<strong>as</strong> been paid to concepts such <strong>as</strong> Design<br />
<strong>for</strong> Environment, Extended Producer Responsibility, Responsible<br />
Chain Management, and <strong>Ecodesign</strong> [3–26], and with their application,<br />
many companies have improved the environmental<br />
per<strong>for</strong>mance of their products. According to Lagerstedt [27], Design<br />
<strong>for</strong> the Environment is a term used <strong>as</strong> synonym <strong>for</strong> several other<br />
* Corresponding author. Tel.: þ55 11 5586 4127.<br />
E-mail address: shbonilla@hotmail.com (S.H. Bonilla).<br />
names such <strong>as</strong>: <strong>Ecodesign</strong>, Sustainable Design, Green Design,<br />
Environmental Conscious Design, Life Cycle Design or Life Cycle<br />
Engineering and also Clean Design. This author [27] points out that<br />
although the phr<strong>as</strong>ing may have different meanings, the concepts<br />
generally have the same objectives.<br />
<strong>Ecodesign</strong> is one of the terms being used to describe the<br />
approach used by designers in the field of product design and<br />
manufacture. The life of a product starts with the initial design<br />
concept and the final cost of this product is determined at the<br />
design ph<strong>as</strong>e, being this cost <strong>as</strong>sociated to economic or environmental<br />
issues [28]. Thus, <strong>as</strong>suming that the impact of a product<br />
upon the environment is determined at the design ph<strong>as</strong>e it is e<strong>as</strong>y<br />
to perceive the importance of <strong>Ecodesign</strong>. However, there is still<br />
a strong need <strong>for</strong> a <strong>tool</strong> to facilitate the integration and the<br />
<strong>as</strong>sessment of environmental demands into the product development<br />
process.<br />
Most of the works concerning <strong>Ecodesign</strong> offer guidelines,<br />
checklists and other <strong>tool</strong>s that have been used in product design <strong>for</strong><br />
a long time [29–44]. Checklists were adapted with the inclusion of<br />
environmental concerns such <strong>as</strong> recommendations against the use<br />
of toxic materials and unnecessary raw materials (dematerialization)<br />
or suggestions on energy consumption minimization at<br />
different production ph<strong>as</strong>es. Checklists and guidelines differ in<br />
complexity and structure. Some publications focus upon a special<br />
kind of product [30–33], others incorporate a life cycle <strong>as</strong>sessment,<br />
0959-6526/$ – see front matter Ó 2009 Published by Elsevier Ltd.<br />
doi:10.1016/j.jclepro.2009.03.019
C.M.V.B. Almeida et al. / Journal of <strong>Cleaner</strong> <strong>Production</strong> 18 (2010) 32–43 33<br />
emph<strong>as</strong>izing dis<strong>as</strong>sembly and recycling <strong>as</strong> central issues in <strong>Ecodesign</strong><br />
[34–36]. There are also publications that concentrate on the<br />
reduction of resource exploitation and dematerialization [37–39],<br />
and several works have been published concerning <strong>Ecodesign</strong>, in<br />
the sense that it incorporates materials selection in order to reduce<br />
the environmental burdens of products [40–44]. <strong>In</strong> 2006, the<br />
Journal of <strong>Cleaner</strong> production published a special issue offering an<br />
overview of the subject area of <strong>Ecodesign</strong> [45].<br />
<strong>In</strong> this context, designers are being <strong>for</strong>ced to consider more<br />
holistic techniques <strong>for</strong> design and <strong>as</strong>sess products and processes, <strong>as</strong><br />
the need <strong>for</strong> changing the current non-sustainable product development<br />
practices becomes incre<strong>as</strong>ingly patent. As a result, techniques<br />
such <strong>as</strong> Life Cycle Assessment (LCA) and Materials Flow<br />
Analysis (MFA) are incre<strong>as</strong>ingly popular. Such techniques attempt<br />
to quantify critical environmental variables, seeking to scientifically<br />
evaluate environmental impact and resource consumption (Fig. 1).<br />
The search <strong>for</strong> an <strong>as</strong>sessment method or the combination of<br />
methods to monitor and evaluate production systems is a growing<br />
concern that attracts ef<strong>for</strong>ts from researchers all over the world. <strong>In</strong><br />
an ef<strong>for</strong>t to quantify and compare the environmental impact of<br />
products and processes, there is also a great number of papers<br />
dealing with the application of LCA <strong>for</strong> this t<strong>as</strong>k [46–48]. As LCA<br />
offers the possibility to identify environmental impacts all over the<br />
production chain, it h<strong>as</strong> been widely employed to calculate the<br />
environmental burden of a product life cycle, such <strong>as</strong> greenhouse<br />
g<strong>as</strong> emissions or ozone depletion. However, there are some shortcomings<br />
to deal with, especially at the design ph<strong>as</strong>e. At first, LCA<br />
data of a target product is only available after detail design. Hence,<br />
it is hard to quantify the environmental impact of products and<br />
processes be<strong>for</strong>e detail design, <strong>as</strong> LCA’s impact is <strong>as</strong>sociated to the<br />
quantity of w<strong>as</strong>tes and emissions, which may only be estimated at<br />
this ph<strong>as</strong>e. Secondly, although several studies dealing with LCA <strong>for</strong><br />
materials have already been per<strong>for</strong>med, LCA practitioners have<br />
a number of different weighting methods available, and the results<br />
of the different methods do not generally coincide because of a lack<br />
of standardization in conventional methodologies [49]. At this<br />
point, the ISO 14042 states that in an LCA study it may be desirable<br />
to use different weighting methods and conduct sensitivity analysis<br />
to <strong>as</strong>sess the consequences they may have on the results of the LCA.<br />
MFA [50–53] applies the concepts of industrial ecology [54,55]<br />
to study how materials and energy flow into, throughout, and out of<br />
a system. This method, developed at the Wuppertal <strong>In</strong>stitute [53],<br />
can evaluate the environmental harm <strong>as</strong>sociated with the extraction<br />
or diversion of resources from their natural ecosystemic<br />
pathways. Material intensity factors (g/unit) are multiplied by each<br />
input (material or energy), respectively, accounting <strong>for</strong> the total<br />
amount of abiotic matter, water, air and biotic matter required in<br />
order to provide that input to the process in study (Fig. 1). MFA<br />
accounts physical units such <strong>as</strong> the quantity of materials, which<br />
result from the extraction, production, trans<strong>for</strong>mation, consumption,<br />
recycling, and disposal within a system [56]. The target of the<br />
analysis can be one single substance (such <strong>as</strong> carbon dioxide),<br />
a material (trans<strong>for</strong>med naturally or technically) or a product. But<br />
there are also shortcomings <strong>as</strong> MFA <strong>as</strong>sumes fundamentally that,<br />
<strong>for</strong> a given period, inter-sector flows from one sector to another are<br />
proportional to the total output of the receiving sector <strong>for</strong> that same<br />
time period.<br />
These shortcomings arise in part from the difficulty <strong>for</strong> establishing<br />
metrics that completely represent a desirable environmental<br />
per<strong>for</strong>mance. Challenges arise especially on defining<br />
sustainability and which <strong>as</strong>sessment method should be used to<br />
me<strong>as</strong>ure this sustainability. Up till now, various indicators quantifying<br />
product environmental per<strong>for</strong>mance have been proposed<br />
[57,58], but none of them w<strong>as</strong> completely accepted by the scientific<br />
community [59].<br />
<strong>Emergy</strong> accounting (EA) offers a promising metric to introduce<br />
environmental concerns into the <strong>Ecodesign</strong> methodologies. It<br />
counts with scientific b<strong>as</strong>is and offers indices that can supply additional<br />
in<strong>for</strong>mation on the environmental loading of a system and its<br />
sustainability. But, more importantly, emergy accounting fulfils the<br />
need <strong>for</strong> including the contribution of natural ecosystems, data<br />
relative to human labor and process implementation. With the<br />
development of EA [60,61], the aware of the impossibility of<br />
completely control, dispose or recycle all pollutants, suggests<br />
a strategy to calculate the emergy investment needed to dispose or<br />
recycle some of the w<strong>as</strong>tes and pollutants. To complete the analysis,<br />
an additional emergy investment required by the biosphere to repair<br />
damages, dispersing or mitigating pollutants often rele<strong>as</strong>ed without<br />
control, can be also calculated [61], although some damages are very<br />
unlikely to be amendable. Even though this methodology is able to<br />
meet the main needs of ecodesigners, it h<strong>as</strong> still found relatively<br />
limited use in environmentally conscious design.<br />
Fig. 1. <strong>In</strong>tegration scheme of inventory ph<strong>as</strong>e with the <strong>as</strong>sessment methods: LCA, life cycle <strong>as</strong>sessment, which focuses mainly downstream flows; MFA, material flow analysis<br />
regarding only upstream flows, and EA, emergy accounting, with its central attention to upstream flows, but may include also downstream fluxes.
34<br />
C.M.V.B. Almeida et al. / Journal of <strong>Cleaner</strong> <strong>Production</strong> 18 (2010) 32–43<br />
The purpose of this study is to introduce environmental<br />
accounting b<strong>as</strong>ed on emergy <strong>as</strong> a <strong>tool</strong> to <strong>as</strong>sist product design,<br />
through the use of emergy indices. The use of this simplified <strong>tool</strong>,<br />
e<strong>as</strong>y to use, aims to support designer’s decisions in the development/<strong>as</strong>sessment<br />
of more sustainable products. This complementary<br />
<strong>tool</strong> may be inserted into the conventional design<br />
methodology with LCI or MFA inventories to facilitate the selection<br />
of materials and processes, the <strong>as</strong>sessment of improvements and<br />
process changes or to guide decision making. To check the fe<strong>as</strong>ibility<br />
of the proposed <strong>tool</strong> using an LCI inventory, the production of<br />
PET bottles w<strong>as</strong> compared with that of aluminum cans <strong>for</strong> beverage<br />
packaging in order to help designers regarding materials selection.<br />
2. Method<br />
2.1. Theoretical background<br />
The concept of emergy can be used to <strong>as</strong>sess the load imposed<br />
by a product to the environment. <strong>Emergy</strong> is in agreement with one<br />
of the principles of sustainability defined by Daly [62], namely, that<br />
a process is sustainable only if the resources consumed are used at<br />
a rate that does not exceed the rate at which they are renewed.<br />
Odum [63] defined emergy <strong>as</strong> the quantity of solar energy necessary<br />
(directly or indirectly) to obtain a product (good or service) or<br />
energy flow in a given process. Solar energy, despite being<br />
dispersed and low quality energy, is the common b<strong>as</strong>is of all energy<br />
flows circulating within the biosphere. The greater the emergy flow<br />
necessary to sustain a process, the greater the quantity of solar<br />
energy consumed or in other words, the greater the environmental<br />
cost. Hence emergy represents the memory of all the solar energy<br />
consumed during the process. <strong>Emergy</strong> is me<strong>as</strong>ured in solar energy<br />
joules (sej) [64]. Solar trans<strong>for</strong>mity is the solar energy directly or<br />
indirectly necessary to obtain 1 J of another type of energy and<br />
emergy per unit (g) is the solar emergy needed to obtain one unit of<br />
a product (specific emergy). For systems with the same output,<br />
such <strong>as</strong> the 1000 L of beverage packaged, the lower the emergy per<br />
functional unit (emergy/FU, where FU ¼ 1000 L), the higher is the<br />
efficiency of the system in the production [64]. It is worthy to note<br />
that this definition of efficiency includes all biosphere services,<br />
called from here of global efficiency. For designers, this approach<br />
may provide indicators of processes’ efficiency and environmental<br />
stress. <strong>In</strong>dicators b<strong>as</strong>ed on emergy accounting distinguish between<br />
renewable (R) and the non-renewable (N) resources, and imported<br />
inputs (F) of the total emergy of the output (Y ¼ N þ R þ F).<br />
Targeting the <strong>as</strong>sessment of environmental demands into the<br />
product development process, the environmental loading ratio<br />
(ELR) w<strong>as</strong> chosen among the emergy-b<strong>as</strong>ed indicators. ELR<br />
compares the amount of non-renewable and purch<strong>as</strong>ed emergy<br />
(N þ F) to the amount of local renewable emergy [65], that is, the<br />
total human-controlled emergy invested in the system divided by<br />
the annual free environmental emergy input, providing a quantitative<br />
means <strong>for</strong> <strong>as</strong>sessing the PET and aluminum cans production<br />
balance (Eq. (1)).<br />
ELR ¼ðN þ FÞ=R (1)<br />
A high value of the ELR, often due to a high technological level in<br />
the use of resources, indicates high environmental stress, because<br />
local environmental cycles are overloaded. <strong>In</strong> the absence of<br />
investments from outside, the renewable emergy locally available<br />
would result in a full-grown ecosystem with ELR / 0 consistent<br />
with the limits imposed by the local environment. But, with<br />
anthropogenic intervention, the non-renewable imported emergy<br />
imposes a distance from the natural ecosystem, which can be<br />
indicated by the ratio (N þ F)/R. The higher the ratio, the bigger is<br />
the distance between the system and the natural environment.<br />
Hence, ELR may be defined <strong>as</strong> a me<strong>as</strong>ure of the load inflicted to the<br />
environment by production systems or any other human activity.<br />
<strong>In</strong> this work, besides the use of the traditional indices, the<br />
product ELR emergy/FU and the ratio of ELR with the emergy per<br />
functional unit were analyzed in order to obtain a more complete<br />
<strong>as</strong>sessment.<br />
2.2. <strong>In</strong>troducing emergy accounting <strong>for</strong> <strong>Ecodesign</strong> use<br />
The first step <strong>for</strong> applying any <strong>as</strong>sessment method is data<br />
collection through an inventory of m<strong>as</strong>s and energy flows (Fig. 1).<br />
Data collection and compilation are often the most work- and timeconsuming<br />
steps in <strong>as</strong>sessment methods, and must extend over all<br />
the production cycle (Fig. 2). But, independently of methodological<br />
choices regarding the <strong>as</strong>sessment of a product system, <strong>for</strong> each<br />
process of the product system, a data set is imperative. For<br />
designers, a good option may lie on the use of data sets already<br />
published in the literature.<br />
Among the common data sets found in the literature, LCIs (Life<br />
Cycle <strong>In</strong>ventories) are used by LCA practitioners to calculate, <strong>as</strong> well<br />
<strong>as</strong> to interpret, indicators of the potential impacts <strong>as</strong>sociated with<br />
emission and resource consumption. The aim of LCIs is to report the<br />
Fig. 2. Life cycle stages that provide feedback in<strong>for</strong>mation to <strong>Ecodesign</strong> evaluation.
C.M.V.B. Almeida et al. / Journal of <strong>Cleaner</strong> <strong>Production</strong> 18 (2010) 32–43 35<br />
quantities of different resources required and emissions and w<strong>as</strong>tes<br />
generated per functional unit of a given system. There are also<br />
public datab<strong>as</strong>e initiatives, industry datab<strong>as</strong>es initiatives and LCA<br />
dedicated softwares, which cover the more commonly used goods<br />
and services <strong>for</strong> a number of products and processes [66].<br />
LCIs commonly include the main raw materials and the use of<br />
water and energy, and special emph<strong>as</strong>is is given to the emissions<br />
rele<strong>as</strong>ed to the environment. <strong>Emergy</strong> accounting refers to the use of<br />
resources to produce a good or a service. It is worthy to mention<br />
that at the design ph<strong>as</strong>e of a given product, the designer using<br />
emergy accounting would be able to consider not only the<br />
resources used <strong>for</strong> operating the production life cycle, but also all<br />
materials, human labor and energy to implement and operate the<br />
production process. Data referring to the system rele<strong>as</strong>es may be<br />
also used to calculate the environmental services required <strong>for</strong><br />
absorbing, diluting or decomposing these emissions and w<strong>as</strong>tes.<br />
But, it is worthy to attention that, at the design ph<strong>as</strong>e, data relative<br />
to emissions may only be estimated.<br />
The interactions of each stage of PET bottles and aluminum cans<br />
production with the <strong>Ecodesign</strong> activity may be established<br />
throughout the product’s life cycle stages (Fig. 2). From these<br />
interactions, the designer gets important in<strong>for</strong>mation <strong>for</strong> the<br />
development of the product or <strong>for</strong> the improvement of its environmental<br />
per<strong>for</strong>mance. It is important to note that designer’s<br />
power to make changes in both production life cycles lies on the<br />
manufacture stage. However, his actions may indirectly affect the<br />
life cycle, both upstream and downstream.<br />
The following are the steps recommended <strong>for</strong> designers <strong>for</strong><br />
evaluating a system with emergy accounting using data collected<br />
from the literature:<br />
1. Get a data set from the literature, from public, industrial or<br />
academic source.<br />
2. Draw an energy diagram, which helps to convert mental/verbal<br />
models to quantitative energy fluxes and to visualize the<br />
interactions among production stages.<br />
3. Set up an emergy evaluation table with a line item <strong>for</strong> each<br />
input.<br />
4. Multiply the amount relative to each flow by its respective<br />
emergy/unit or trans<strong>for</strong>mity to get the total emergy flow per<br />
functional unit.<br />
5. For interpretation, calculate the emergy indices. <strong>In</strong> this work,<br />
ELR is calculated in order to <strong>as</strong>sess the environmental load of<br />
the product, but there are other indices which may help<br />
designers to <strong>as</strong>sess the benefits of the economic use of an<br />
environmental resource, <strong>for</strong> example. For further in<strong>for</strong>mation<br />
see Ref. [64].<br />
6. To compare products or processes or to evaluate process’<br />
improvements, calculate the trans<strong>for</strong>mity or the emergy/unit of<br />
each product/process. The use of the product ELR emergy/FU<br />
and the ratio of ELR with the emergy per functional unit may<br />
lead to more complete and reliable results.<br />
To illustrate the use of the emergy accounting and the calculations<br />
<strong>for</strong> ELR, an LCI found in the literature [67,68] w<strong>as</strong> taken. This<br />
example w<strong>as</strong> chosen in order to enlighten the use of a literature<br />
data set and the use of quantitative results provided by emergy<br />
accounting during the product development. The selected LCI<br />
[67,68] compares beverage packages produced with PET and<br />
aluminum using virgin and recycled materials.<br />
2.3. C<strong>as</strong>e study<br />
The LCIs of PET bottles and aluminum cans were taken <strong>as</strong><br />
a Brazilian c<strong>as</strong>e study, and LCI in<strong>for</strong>mation is b<strong>as</strong>ed on literature<br />
data. A detailed description of the system, including the complete<br />
life cycle inventory data, can be consulted from Valt [67,68]. This<br />
approach w<strong>as</strong> used to <strong>as</strong>sess not only production systems and<br />
product options, but principally to aid designers to decide among<br />
materials alternatives, and to <strong>as</strong>sess changes and improvements in<br />
each production process.<br />
The inventory tables include the use of raw material, energy<br />
consumption, the use of semi-manufactures and auxiliary materials,<br />
and transport at each life cycle stage. Values of emergy per<br />
unit are shown in Table 1. Because of the size of the system, which<br />
covers several Brazilian States in both production and recycling<br />
stages, the type of the inputs <strong>for</strong> each flow w<strong>as</strong> chosen considering<br />
Brazilian boundaries. Crude oil and bauxite are then considered<br />
non-renewable inputs and water a renewable input. The quantity of<br />
recycled PET <strong>as</strong>sumed (40% in weight) is in agreement with Brazilian<br />
[69] and Mercosur [70] regulations. The quantity of recycled<br />
aluminum (80% in weight) is that practiced in the country in the<br />
same year [67]. The functional unit (FU) is 1000 L of beverage corresponding<br />
to 500 PET bottles of 2 L, and to 2857 aluminum cans.<br />
Diesel spent <strong>for</strong> transporting materials between stages w<strong>as</strong> taken<br />
into account <strong>as</strong> distances exceed 1000 km (Fig. 3).<br />
3. Results<br />
3.1. PET bottles production<br />
System diagrams illustrated in Figs. 4 and 5 were drawn to<br />
combine in<strong>for</strong>mation about the system of interest and the LCI<br />
inventory [67,68]. The energy diagram ensures that all driving<br />
energies included in the PET life cycle inventory were taken into<br />
account. Fig. 4 shows the diagram <strong>for</strong> PET production from virgin<br />
materials, and Fig. 5 includes the recycling stage <strong>for</strong> producing PET-<br />
R bottles. Both diagrams were used to construct tables of data<br />
required <strong>for</strong> the emergy accounting.<br />
As shown in Figs. 4 and 5, PET production operating inputs <strong>for</strong><br />
1000 L of beverage (electricity, materials, and fuels <strong>for</strong> transportation),<br />
<strong>as</strong> well <strong>as</strong> direct and indirect environmental inputs<br />
(water), are quantified in Tables 2 and 3, accordingly to the LCI data<br />
[67,68], <strong>as</strong>signed a suitable emergy per unit and converted to<br />
emergy values.<br />
The calculated emergy per 1000 L of beverage of the PET bottle<br />
production life cycle is 9.26 10 14 sej/FU, while the emergy per<br />
m<strong>as</strong>s of the finished bottle is 3.70 10 10 sej/g (Table 2). 93% of the<br />
total emergy invested <strong>for</strong> PET bottles production is <strong>as</strong>sociated to the<br />
first two life cycle stages. The major contributions to the total<br />
emergy are related to electricity (71%, being 30% sej/sej <strong>as</strong>sociated<br />
to petroleum extraction and 41% sej/sej to crude oil refining), and to<br />
the crude oil used <strong>as</strong> raw material (14% sej/sej). It is interesting to<br />
mention that in Brazil 95% of the electric energy is obtained from<br />
hydroelectric plants [76], and that this kind of energy h<strong>as</strong><br />
Table 1<br />
Values of emergy per unit and trans<strong>for</strong>mities used in this work.<br />
Item Type a <strong>Emergy</strong> per unit References<br />
(sej/g)<br />
(sej/J)<br />
River water R 2.03 10 5 4.26 10 4 [71]<br />
Methanol F 4.80 10 4 [72]<br />
Coke F 5.40 10 4 [73]<br />
Crude oil N 5.54 10 4 [74]<br />
Diesel (transport) F 6.60 10 4 [64]<br />
Electric energy F 1.65 10 5 [64]<br />
Bauxite N 8.55 10 8 [64]<br />
Chemicals F 2.65 10 9 [75]<br />
Paint and varnish F 3.00 10 9 [61]<br />
a Types of inputs were cl<strong>as</strong>sified accordingly to the boundaries set to the system.
36<br />
C.M.V.B. Almeida et al. / Journal of <strong>Cleaner</strong> <strong>Production</strong> 18 (2010) 32–43<br />
Fig. 3. Distances between stages in the PET bottle production life cycle (right) and aluminum cans production life cycle (left). The white triangle marked in Bahia State shows the<br />
location of the PET recycling plant, 100 km distant from the per<strong>for</strong>m production plant.<br />
a renewable fraction of 70% sej/sej corresponding to the geopotential<br />
input [64].<br />
Table 3 shows the total emergy per 1000 L of beverage of the<br />
PET-R bottle production. The value of 5.86 10 14 sej/FU corresponds<br />
to 63% of the emergy invested to produce PET bottles<br />
exclusively from virgin materials, while the emergy per unit of the<br />
PET-R bottle 2.34 10 10 sej/g indicates that the inclusion of recycled<br />
material in the PET bottle life cycle incre<strong>as</strong>es its global efficiency<br />
in approximately 37% sej/sej. The implementation of the<br />
recycling stage reflects directly on the extraction and refining<br />
ph<strong>as</strong>es diminishing the quantities of resources and energy use.<br />
3.2. Aluminum cans production<br />
System diagrams illustrated in Fig. 6 and show the diagram <strong>for</strong><br />
aluminum cans (Al) production from virgin materials, and Fig. 7<br />
includes the recycling stage (Al-R).<br />
As shown in Figs. 6 and 7, aluminum can production operating<br />
inputs <strong>for</strong> 1000 L of beverage (electricity, materials, and fuels <strong>for</strong><br />
transportation), <strong>as</strong> well <strong>as</strong> direct and indirect environmental inputs,<br />
are quantified in Tables 4 and 5, accordingly to the LCI data [67,68],<br />
<strong>as</strong>signed a suitable emergy per unit and converted to emergy values.<br />
The calculated emergy per 1000 L of beverage of the aluminum<br />
cans production life cycle is 3.02 10 15 sej/FU, while the emergy<br />
per m<strong>as</strong>s of the finished can is 7.10 10 10 sej/g (Table 4). The major<br />
contributions to the total emergy are related to electricity (86%,<br />
being 53% sej/sej <strong>as</strong>sociated to bauxite extraction and alumina<br />
production and 33% sej/sej to electrolysis and smelting stage), and<br />
to the bauxite used <strong>as</strong> raw material (6% sej/sej). It is worthy to note<br />
that 96% of the total emergy invested <strong>for</strong> Al cans production is<br />
<strong>as</strong>sociated to the first two life cycle stages.<br />
Table 5 shows the total emergy per 1000 L of beverage of the Al-R<br />
can production. The value of 7.95 10 14 sej/FU corresponds to 26% of<br />
the emergy invested to produce aluminum cans exclusively from<br />
virgin materials; while the emergy per unit of the Al-R can<br />
1.87 10 10 sej/g indicates that the inclusion of recycled material in<br />
the cans life cycle incre<strong>as</strong>es its global efficiency in approximately<br />
47%sej/sej. The implementation of the recycling stage reflects<br />
directly on the extraction and ingots production ph<strong>as</strong>es diminishing<br />
the quantities of resources and energy use. It is important to mention<br />
that can recycling in Brazil also generates employment <strong>for</strong> over 160<br />
thousand people in activities ranging from used cans collection to<br />
the scrap processing into new cans [77]. Brazil h<strong>as</strong> been the world<br />
leader in beverage aluminum can recycling <strong>for</strong> four consecutive<br />
years, and, in 2004, a new record w<strong>as</strong> achieved with 95.7% kg/kg of<br />
the cans returning to the production chain. This percentage corresponds<br />
to 121.3 thousands tons, or approximately 9 billion cans.<br />
4. Discussion<br />
Once the total number of input flows to the PET bottles and<br />
aluminum cans production process h<strong>as</strong> been identified and the<br />
Fig. 4. Energy diagram <strong>for</strong> PET production using exclusively virgin materials. Each number within the circles or over arrows corresponds to a line in Table 2. <strong>Emergy</strong> fluxes 5, 10, 14<br />
and 18 are presented in the table but do not contribute to the total emergy, <strong>as</strong> the only raw material entering the production chain is crude oil.
C.M.V.B. Almeida et al. / Journal of <strong>Cleaner</strong> <strong>Production</strong> 18 (2010) 32–43 37<br />
Fig. 5. Energy diagram <strong>for</strong> PET-R production using virgin and recycled materials. Each number within the circles or over arrows corresponds to a line in Table 3. <strong>Emergy</strong> fluxes 5, 10,<br />
14, 18 and 22 are presented in the table but do not contribute to the total emergy, <strong>as</strong> the only raw material entering the production chain is crude oil.<br />
emergy yield driving the process h<strong>as</strong> been calculated (Tables 2, 3, 4<br />
and 5) a set of indices and ratios can be accordingly calculated.<br />
<strong>Emergy</strong> indices have been shown to be particularly useful when<br />
studying processes under human control, where a sustainable<br />
pattern is not guaranteed and choices have to be supported by the<br />
careful consideration of many different parameters. The environmental<br />
loading ratio (Eq. (1)) expresses the use of environmental<br />
services by a system, indicating a load on the environment. The<br />
Table 2<br />
Environmental accounting <strong>for</strong> the PET bottle production (500 bottles).<br />
# Item a Type Unit Amount <strong>Emergy</strong> per<br />
unit d (sej/un)<br />
Solar <strong>Emergy</strong><br />
(sej)<br />
Oil extraction<br />
1 Water R g 9.49 10 4 2.03 10 5 1.93 10 10<br />
2 Electricity F J 1.69 10 9 1.65 10 5 2.79 10 14<br />
3 Diesel (transport) F J 5.16 10 8 6.60 10 4 3.41 10 13<br />
4 Crude oil N J 2.30 10 9 5.54 10 4 1.27 10 14<br />
5 Petroleum Y1 g 7.46 10 4 5.90 10 9 4.41 10 14<br />
Refining<br />
6 Water R g 4.33 10 4 2.03 10 5 8.79 10 9<br />
7 Electricity F J 2.27 10 9 1.65 10 5 3.74 10 14<br />
8 Diesel (transport) F J 4.51 10 8 6.60 10 4 2.98 10 13<br />
9 Methanol F J 2.07 10 8 4.80 10 4 9.93 10 12<br />
10 DMT þ MEG b Y2 g 3.29 10 4 2.60 10 10 8.55 10 14<br />
Resin production<br />
11 Water R g 5.54 10 3 2.03 10 5 1.12 10 9<br />
12 Electricity F J 1.89 10 8 1.65 10 5 3.12 10 13<br />
13 Diesel (transport) F J 1.19 10 8 6.60 10 4 7.82 10 12<br />
14 PET Resin Y3 g 2.60 10 4 3.44 10 10 8.94 10 14<br />
Pre<strong>for</strong>m c production<br />
15 Water R g 1.96 10 3 2.03 10 5 3.98 10 8<br />
16 Electricity F J 1.47 10 7 1.65 10 5 2.43 10 12<br />
17 Diesel (transport) F J 4.52 10 7 6.60 10 4 2.98 10 12<br />
18 Pre<strong>for</strong>mer Y4 g 2.39 10 4 3.76 10 10 8.99 10 14<br />
PET bottle production<br />
19 Water R g 4.50 10 4 2.03 10 5 9.14 10 9<br />
20 Electricity F J 1.60 10 8 1.65 10 5 2.64 10 13<br />
21 Diesel (transport) F J 1.06 10 7 6.60 10 4 6.98 10 11<br />
PET bottles Y g 2.50 10 4 3.70 10 10 9.26 10 14<br />
a Items from lines 5, 10, 14 and 18 (over arrows in Fig. 4) were not accounted to<br />
avoid double-counting.<br />
b DMT dimethyl terephtalate and MEG mono ethylene glycol.<br />
c <strong>In</strong> the PET bottle life cycle, the PET resin is first molded into a ‘‘pre<strong>for</strong>m’’ using<br />
the <strong>In</strong>jection Molded Process. These pre<strong>for</strong>ms are produced with the necks of the<br />
bottles, including threads on one end. These pre<strong>for</strong>ms are fed after cooling into<br />
a blow molding machine.<br />
d The values of emergy per unit calculated in this table (lines 5, 10, 14 and 18) only<br />
take into account inputs considered in the LCI used (water, electricity and diesel <strong>for</strong><br />
transport). However, the value calculated <strong>for</strong> PET resin is comparable to that<br />
calculated <strong>for</strong> PVC (1.14 10 10 sej/g [76]), confirming that the inputs considered are<br />
the main flows of PET production.<br />
Table 3<br />
Environmental accounting <strong>for</strong> the PET-R bottle production, 40% of recycled material<br />
in weight (500 bottles).<br />
# Item a Type Unit Amount <strong>Emergy</strong> per<br />
unit (sej/un)<br />
Solar emergy<br />
(sej)<br />
Oil extraction<br />
1 Water R g 5.69 10 4 2.03 10 5 1.16 10 10<br />
2 Electricity F J 1.01 10 9 1.65 10 5 1.67 10 14<br />
3 Diesel (transport) F J 3.10 10 8 6.60 10 4 2.04 10 13<br />
4 Crude oil N J 1.38 10 9 5.54 10 4 7.65 10 13<br />
5 Petroleum Y1 g 4.48 10 4 5.90 10 9 2.64 10 14<br />
Refining<br />
6 Water R g 2.60 10 4 2.03 10 5 5.28 10 9<br />
7 Electricity F J 1.36 10 9 1.65 10 5 2.25 10 14<br />
8 Diesel (transport) F J 2.71 10 8 6.60 10 4 1.79 10 13<br />
9 Methanol F J 1.24 10 8 4.80 10 4 5.96 10 12<br />
10 DMT þ MEG b Y2 g 1.97 10 4 2.60 10 10 5.13 10 14<br />
Resin production<br />
11 Water R g 3.32 10 3 2.03 10 5 6.75 10 8<br />
12 Electricity F J 1.13 10 8 1.65 10 5 1.87 10 13<br />
13 Diesel (transport) F J 7.11 10 7 6.60 10 4 4.69 10 12<br />
14 PET Resin Y3 g 1.56 10 4 3.44 10 10 5.36 10 14<br />
Recycling<br />
15 PET bottles (after use) g 1.14 10 4<br />
16 Water R g 1.50 10 4 2.03 10 5 3.05E 10 9<br />
17 Electricity F J 1.02 10 8 1.65 10 5 1.68 10 13<br />
18 Diesel (transport) F J 1.09 10 7 6.60 10 4 7.17 10 11<br />
19 Recycled PET Resin Y4 g 1.04 10 4 5.32 10 10 5.54 10 14<br />
Pre<strong>for</strong>m production<br />
15 Water R g 1.96 10 3 2.03 10 5 3.98 10 8<br />
16 Electricity F J 1.47 10 7 1.65 10 5 2.43 10 12<br />
17 Diesel (transport) F J 4.52 10 7 6.60 10 4 2.98 10 12<br />
18 Pre<strong>for</strong>mers Y5 g 2.39 10 4 2.34 10 10 5.59 10 14<br />
PET bottle production<br />
19 Water R g 4.50 10 4 2.03 10 5 9.14 10 9<br />
20 Electricity F J 1.60 10 8 1.65 10 5 2.64 10 13<br />
21 Diesel (transport) F J 1.06 10 7 6.60 10 4 6.98 10 11<br />
PET-R bottles Y g 2.50 10 4 2.34 10 10 5.86 10 14<br />
a Items from lines 5, 10, 14, 18 and 23 (over arrows in Fig. 5) were not accounted<br />
to avoid double-counting.<br />
b DMT dimethyl terephtalate and MEG mono ethylene glycol.
38<br />
C.M.V.B. Almeida et al. / Journal of <strong>Cleaner</strong> <strong>Production</strong> 18 (2010) 32–43<br />
Fig. 6. Energy diagram <strong>for</strong> Al cans production using exclusively virgin materials. Each number within the circles or over arrows corresponds to a line in Table 4. <strong>Emergy</strong> fluxes 6, 12<br />
and 17 are presented in the table but do not contribute to the total emergy, <strong>as</strong> the only raw material entering the production chain is bauxite.<br />
lower the ratio, the lower is the stress to the environment. Table 6<br />
summarizes results concerning the total emergy per functional<br />
unit, the emergy per gram and the environmental load that each<br />
production process imposes to the environment.<br />
Recycled packages, besides the higher environmental efficiency,<br />
present a lower value <strong>for</strong> ELR. The result is in agreement with the<br />
idea that the more a material circulates within a production life<br />
cycle, the more this life cycle approximates the natural ecosystem,<br />
and the lower will be the stress imposed to the environment. <strong>In</strong> this<br />
way, the designer’s decision <strong>for</strong> using recycled materials must be<br />
unquestionable <strong>for</strong> both c<strong>as</strong>es. The result illustrates the c<strong>as</strong>e in<br />
which designers may intervene in a running process or make<br />
a decision at the project ph<strong>as</strong>e imposing the use of a recycled<br />
fraction. This decision made with support of emergy accounting, is<br />
now b<strong>as</strong>ed on numeric data and on the in<strong>for</strong>mation that the use of<br />
recycled materials reduces the environmental load of in approximately<br />
19% <strong>for</strong> the PET bottles life cycle and ca. 72% <strong>for</strong> the<br />
production of aluminum cans. The values of specific emergy <strong>for</strong><br />
PET-R bottles correspond to 63% of the invested emergy to produce<br />
PET bottles with virgin materials. The values <strong>for</strong> Al-R cans correspond<br />
to 26% of that used <strong>for</strong> the production of aluminum cans with<br />
virgin materials.<br />
Table 6 shows three different points of view to the designer<br />
<strong>as</strong>sessment of beverage packages production. The first, emergy per<br />
gram (of package), can be <strong>as</strong>sociated to the package producer point<br />
of view, <strong>as</strong> the idea is to produce 1 g of product with the minimum<br />
use of resources. The production of Al-R cans is environmentally<br />
more efficient than that produced with aluminum virgin materials<br />
or those produced with PET, recycled or not. The second indicator,<br />
emergy per UF, indicates the total emergy invested to supply 1000 L<br />
beverage to the customer, who wants to receive the packages with<br />
the minimum emergy use. This indicator would be better used by<br />
a designer working to the beverages producers, and in this c<strong>as</strong>e, the<br />
designer would choose among the four options the production<br />
using PET-R bottles, with specific emergy of 5.86 10 14 sej/UF.<br />
However, from the biosphere point of view, the ELR value should<br />
determine the designer’s decision towards the PET-R production.<br />
The product ELR <strong>Emergy</strong>/FU gives a more complete and reliable<br />
Fig. 7. Energy diagram <strong>for</strong> Al-R cans production. Each number within the circles or over arrows corresponds to a line in Table 5. <strong>Emergy</strong> fluxes 6, 12, 13, 16 and 21 are presented in<br />
the table but do not contribute to the total emergy, <strong>as</strong> the only raw material entering the production chain is bauxite.
C.M.V.B. Almeida et al. / Journal of <strong>Cleaner</strong> <strong>Production</strong> 18 (2010) 32–43 39<br />
Table 4<br />
Environmental accounting <strong>for</strong> the Al cans production (2857 cans).<br />
# Item a Type Unit Amount <strong>Emergy</strong> per<br />
unit (sej/un)<br />
Solar <strong>Emergy</strong><br />
(sej)<br />
Extraction and alumina production<br />
1 Water R g 1.68 10 4 2.03 10 5 3.41 10 9<br />
2 Electricity F J 9.79 10 9 1.65 10 5 1.62 10 14<br />
3 Chemicals F g 1.12 10 4 2.65 10 9 2.96 10 13<br />
4 Diesel F J 4.79 10 8 6.60 10 4 3.16 10 13<br />
5 Bauxite N g 1.95 10 5 8.55 10 8 1.67 10 14<br />
6 Alumina Y1 g 7.80 10 4 2.36 10 10 1.84 10 15<br />
Electrolysis and smelting<br />
7 Water R g 5.03 10 3 2.03 10 5 1.02 10 9<br />
8 Electricity F J 6.00 10 9 1.65 10 5 9.90 10 14<br />
9 Chemicals F g 8.44 10 3 2.65 10 9 2.24 10 13<br />
10 Diesel F J 4.74 10 8 6.60 10 4 3.13 10 13<br />
11 Coke F J 1.13 10 8 5.40 10 4 6.10 10 12<br />
12 Aluminum ingot Y2 g 4.49 10 4 6.44 10 10 2.89 10 15<br />
Lamination<br />
13 Water R g 1.12 10 2 2.03 10 5 2.27 10 7<br />
14 Electricity F J 4.29 10 8 1.65 10 5 7.07 10 13<br />
15 Chemicals F g 2.00 10 1 2.65 10 9 5.30 10 8<br />
16 Diesel F J 4.53 10 7 6.60 10 4 2.99 10 12<br />
17 Aluminum sheets Y3 g 4.61 10 4 6.44 10 10 2.97 10 15<br />
Aluminum cans production<br />
18 Water R g 1.22 10 5 2.03 10 5 2.48 10 10<br />
19 Electricity F J 2.96 10 8 1.65 10 5 4.88 10 13<br />
20 Diesel F J 9.11 10 7 6.60 10 4 6.01 10 12<br />
21 Paint and varnish F g 8.17 10 2 3.00 10 9 2.45 10 12<br />
Aluminum cans Y g 4.26 10 4 7.10 10 10 3.02 10 15<br />
a Items from lines 6, 12 and 17 (over arrows in Fig. 6) were not accounted to avoid<br />
double-counting.<br />
evaluation, <strong>as</strong> the designer should seek <strong>for</strong> a low emergy use per<br />
functional unit combined with a low environmental load.<br />
Despite the environmental load reduction of the overall life<br />
cycle (Table 6), designers may also evaluate the emergy use and the<br />
ELR of each stage, to prioritize/identify changes and to look <strong>for</strong><br />
opportunities of improvement, <strong>as</strong> the sheer volume of materials<br />
processed through the life cycle continues to incre<strong>as</strong>e dissipative<br />
pollution.<br />
The total emergy use <strong>for</strong> both life cycles can be compared. Fig. 8<br />
shows the total emergy use <strong>for</strong> each stage of PET and aluminum<br />
beverage packages, and it is clear that the emergy use <strong>for</strong> packages<br />
production with recycled materials is sensibly lower than that of<br />
produced with virgin materials at all stages of the production cycle.<br />
Fig. 9 shows the environmental loading ratio <strong>for</strong> each stage <strong>for</strong><br />
both systems. As the proportion of the inputs needed to produce<br />
the intermediary products at stages preceding the recycled material<br />
entrance in the life cycle does not vary, ELR remains the same.<br />
Observing the stages of PET production, it is clear that a great stress<br />
is imposed to the environment at the crude oil extraction and<br />
refining stage, and during resin production. Aluminum cans<br />
production also presents a high stress at the first three stages<br />
(extraction, electrolysis/smelting and lamination). These are life<br />
cycle stages where designers have no influence, but the result may<br />
convince a designer to examine the best conditions to prescribe the<br />
use of recycled materials. The stress introduced by the recycling<br />
process can be noticed. The emergy invested in the recycling<br />
process represents 3% of the total emergy <strong>for</strong> PET and 11% <strong>for</strong><br />
aluminum cans.<br />
The designer h<strong>as</strong> now a good picture of both production cycles,<br />
and may decide <strong>for</strong> the package producer choosing the lowest<br />
specific emergy, <strong>for</strong> the package consumer choosing the minimum<br />
emergy per UF or <strong>for</strong> the biosphere, selecting the production cycle<br />
with the lowest environmental load and highest efficiency (less<br />
emergy per functional unit).<br />
Table 5<br />
Environmental accounting <strong>for</strong> the Al-R cans production, <strong>for</strong> 80% in weight of recycled<br />
material (2857 cans).<br />
# Item a Type Unit Amount <strong>Emergy</strong> per<br />
unit (sej/un)<br />
Solar <strong>Emergy</strong><br />
(sej)<br />
Extraction and alumina production<br />
1 Water R g 4.22 10 3 2.03 10 5 8.57 10 8<br />
2 Electricity F J 1.96 10 9 1.65 10 5 3.23 10 14<br />
3 Chemicals F g 2.23 10 3 2.65 10 9 5.92 10 12<br />
4 Diesel F J 9.56 10 7 6.60 10 4 6.31 10 12<br />
5 Bauxite N g 3.90 10 4 8.55 10 8 3.33 10 13<br />
6 Alumina Y1 g 1.56 10 4 2.37 10 10 3.69 10 14<br />
Electrolysis and smelting<br />
7 Water R g 1.01 10 3 2.03 10 5 2.05 10 8<br />
8 Electricity F J 1.20 10 9 1.65 10 5 1.98 10 14<br />
9 Chemicals F g 1.34 10 3 2.65 10 9 3.55 10 12<br />
10 Diesel F J 9.48 10 7 6.60 10 4 6.26 10 12<br />
11 Coke F J 2.26 10 7 5.40 10 4 1.22 10 12<br />
12 Aluminum ingots Y2 g 8.98 10 3 6.44 10 10 5.78 10 14<br />
Recycling<br />
13 Post use aluminum cans F g 3.67 10 4<br />
14 Electricity F J 4.97 10 8 1.65 10 5 8.20 10 13<br />
15 Diesel F J 3.97 10 7 6.60 10 4 2.62 10 12<br />
16 Recycled aluminum Y3 g 3.59 10 4 1.85 10 10 6.63 10 14<br />
Lamination<br />
17 Water R g 1.12 10 2 2.03 10 5 2.27 10 7<br />
18 Electricity F J 4.29 10 8 1.65 10 5 7.07 10 13<br />
19 Chemicals F g 2.00 10 1 2.65 10 9 5.30 10 8<br />
20 Diesel F J 4.53 10 7 6.60 10 4 2.99 10 12<br />
21 Aluminum sheets Y4 g 4.49 10 4 1.64 10 9 7.37 10 14<br />
Aluminum cans production<br />
22 Water R g 1.22 10 5 2.03 10 5 2.48 10 10<br />
23 Electricity F J 2.96 10 8 1.65 10 5 4.88 10 13<br />
25 Diesel F J 1.19 10 8 6.60 10 4 7.84 10 12<br />
26 Paint and varnish F g 8.17 10 2 3.00 10 9 2.45 10 12<br />
Aluminum cans Y g 4.26 10 4 1.87 10 10 7.94 10 14<br />
a Items from lines 6. 12, 13,16 and 21 (over arrows in Fig. 7) were not accounted to<br />
avoid double-counting.<br />
At this point, one may suppose that the Brazilian designer would<br />
choose the biosphere option, selecting to produce beverage packages<br />
with PET-R bottles, which presents the lowest values <strong>for</strong><br />
emergy per functional unit and <strong>for</strong> ELR.<br />
According to the Ordinance No. 987, from 8 December 1998 from<br />
ANVISA [69] and Resolution No. 25, June 10, 1999 of Mercosur [70],<br />
the thickness of the PET virgin material layer in contact with the<br />
drink must be greater than 25 mm and the thickness of the recycled<br />
layer should not exceed 200 mm. The lowest thickness <strong>for</strong> PET<br />
bottles allowed by Resolution No. 25 is 225 mm. Then the limit <strong>for</strong><br />
recycled PET inclusion is 199 mm of recycled PET and 26 mm of<br />
virgin material. <strong>In</strong> this way, the maximum percentage of recycled<br />
PET <strong>for</strong> beverage packing use is 88.44% in weight.<br />
The recycling rates <strong>for</strong> PET, <strong>for</strong> the years 2003 and 2006,<br />
considered by Valt [67,68], were 40% kg/kg and 47% kg/kg respectively.<br />
But in 2006, ABIPET [78] published a report accounting the<br />
Table 6<br />
Specific emergy, emergy per functional unit (FU), environmental load ratio (ELR),<br />
and the product ELR emergy/FU <strong>for</strong> PET bottles and aluminum cans production.<br />
Product<br />
Specific<br />
emergy 10 10<br />
(sej/g)<br />
<strong>Emergy</strong> per<br />
FU 10 14<br />
(sej/FU)<br />
PET bottle 3.70 9.26 23,900 2.21<br />
PET-R bottle 2.34 5.86 19,500 1.14<br />
Al can 7.10 30.20 103,000 31.11<br />
Al-R can 1.87 7.95 30.600 2.43<br />
ELR<br />
ELR emergy<br />
per FU 10 19<br />
(sej/FU)<br />
FU, functional unit: 1000 L beverage (500 bottles of 2 L each or 2857 aluminum<br />
cans).
40<br />
C.M.V.B. Almeida et al. / Journal of <strong>Cleaner</strong> <strong>Production</strong> 18 (2010) 32–43<br />
Fig. 8. Total emergy of the production life cycle of beverage packages production: with virgin materials (black) and with recycled materials (gray), <strong>for</strong> 1000 L of beverage.<br />
Fig. 9. Environmental load ratio of the production life cycle of beverage packages production: with virgin materials (black) and with recycled materials (gray), <strong>for</strong> 1000 L of<br />
beverage.
C.M.V.B. Almeida et al. / Journal of <strong>Cleaner</strong> <strong>Production</strong> 18 (2010) 32–43 41<br />
Fig. 10. ELR (top) and total emergy (bottom) of the production life cycle of PET bottles considering different rates of recycling.<br />
recycling of 194 tons of post-consumer PET in this year, or the<br />
equivalent to 51.3% in weight of the total output.<br />
Along with the data found in the literature [68–70,78],<br />
a commercially available PET bottle w<strong>as</strong> evaluated. The 2 L PET<br />
bottle is 300 mm thick, and accordingly to the limits determined by<br />
ANVISA [69], it h<strong>as</strong> a maximum layer of recycled material of<br />
200 mm. Considering that all post-consumer PET in 2006 w<strong>as</strong><br />
constituted of this specific type of bottle, the recycling rate of PET<br />
bottles would be 67% kg/kg.<br />
Fig. 10 shows the possibilities <strong>for</strong> PET recycling according to the<br />
different in<strong>for</strong>mation found about PET recycling in Brazil. It is clear<br />
that the more PET is recycled, the less will be the environmental load<br />
and the less the use of resources. The emergy invested <strong>for</strong> the<br />
implementation of the recycling stage is very low in face of the<br />
savings related to the use of raw materials and other inputs. It is clear<br />
that the product ELR <strong>Emergy</strong>/FU represents the correctness of<br />
each material selection under an environmental point of view. The<br />
lower the product ELR <strong>Emergy</strong>/FU, the better the selection to be<br />
done, but a critical analysis permits to visualize that a small product<br />
alone does not satisfy a sufficient condition. However, supposing the<br />
designer is free to choose among aluminum cans (Al or Al-R) and all<br />
the possibilities shown <strong>for</strong> PET bottles in Fig. 10, it would be also<br />
possible, and safer, to analyze the ratio of ELR and the emergy/FU.<br />
The ratio of ELR and the emergy per functional unit may bring<br />
more in<strong>for</strong>mation. The inverse of the emergy per functional unit may<br />
be <strong>as</strong>sociated to the global productivity (GP) of each material [79].<br />
Fig. 11 shows the relationship between ELR and the global<br />
productivity <strong>for</strong> aluminum (Al and Al-R) and <strong>for</strong> PET bottles. Each<br />
point represents the values of ELR and GP <strong>for</strong> each material choice<br />
covering all the recycling rates shown in Fig. 10.<br />
Fig. 11. ELR versus GP, where GP is the inverse of the emergy per functional unit (FU ¼ 1000 L of beverage). The descendant arrow indicates the direction <strong>for</strong> better material<br />
selection.
42<br />
C.M.V.B. Almeida et al. / Journal of <strong>Cleaner</strong> <strong>Production</strong> 18 (2010) 32–43<br />
The point corresponding to Al defines an area almost equal to<br />
that defined by the PET-R 47% point. However, it is clear that Al area<br />
is composed by a high ELR combined with a low global productivity,<br />
while the PET area is composed by a higher value <strong>for</strong> global<br />
productivity and a lower environmental load. <strong>In</strong> this way, the<br />
product ELR emergy/FU would give similar values <strong>for</strong> the selection<br />
between these two options, but the analysis of Fig. 11 makes<br />
clear that Al and PET-R with 47% kg/kg recycling rate belong to<br />
opposite situations, and that the PET-R selection corresponds to the<br />
best option. PET selection still offers the possibility <strong>for</strong> incre<strong>as</strong>ing<br />
the recycling rate. Obviously, an incre<strong>as</strong>e of the recycling rate does<br />
not depend only on the designer’s preferences. For aluminum, the<br />
maximum recycling rate w<strong>as</strong> almost achieved, and in this c<strong>as</strong>e,<br />
improvements due to the incre<strong>as</strong>e of the recycling rate are almost<br />
accomplished. For PET, the analysis shows that there is still possibility<br />
to incre<strong>as</strong>e the PET recycling rate, and it also indicates that an<br />
incre<strong>as</strong>e from 67% to 88.4% (in weight) would incre<strong>as</strong>e the global<br />
productivity substantially, but the decre<strong>as</strong>e on the ELR value will be<br />
less important.<br />
With these results, the Brazilian designer is able to distinguish<br />
which would be the benefit to the environment depending on his<br />
material selection and on the recycling rate chosen.<br />
5. Conclusions<br />
The use of emergy accounting, through the calculation of the<br />
specific emergy, the emergy per functional unit and the ELR, w<strong>as</strong><br />
proposed <strong>as</strong> a <strong>tool</strong> <strong>for</strong> <strong>Ecodesign</strong>, and the usefulness of this <strong>tool</strong> w<strong>as</strong><br />
illustrated with an example regarding PET bottles and aluminum<br />
cans production with and without a recycling stage. This approach<br />
allows answering some b<strong>as</strong>ic questions regarding the materials<br />
selection, the appropriate rate of recycling to be used and the<br />
benefits achieved <strong>for</strong> each recycling rate.<br />
The novelty of this approach is that it supplies quantitative<br />
indicators, b<strong>as</strong>ed on a common unit (solar energy joules), which<br />
may be compared to those calculated <strong>for</strong> other processes and other<br />
products, independently of the weighting method.<br />
With the use of emergy accounting designers may:<br />
1. get a data set from the literature, from public, industrial or<br />
academic source. This procedure may facilitate data collection,<br />
although designers may collect their own data, if possible,<br />
including fluxes <strong>as</strong>sociated to human labor, to the system<br />
implementation ph<strong>as</strong>e and after use collection and landfilling.<br />
2. identify the main fluxes of each production stage drawing the<br />
energy diagram. This procedure helps the designer to explore<br />
the system in study, with a deeper awareness of the variables to<br />
be considered.<br />
3. by setting up an emergy evaluation table, identify the<br />
production stages of higher impact, the resources with higher<br />
use and the contribution of the implementation of the recycling<br />
stage. Designers will be also capable to <strong>as</strong>sess the effect of<br />
a change done in the manufacture stage (<strong>as</strong> the inclusion of<br />
a recycling stage or the dematerialization of the product) and<br />
identify improvements on the entire production chain.<br />
4. with the value of the emergy per unit (UF or g), identify the best<br />
material option and the most advantageous recycling rate<br />
possible to supply the desired product with the minimum<br />
resource use.<br />
5. with the values of ELR, designers may <strong>as</strong>sess the environmental<br />
load that the product causes on the biosphere and select the<br />
best option among materials to guarantee the minimum<br />
damage possible to the environment.<br />
6. With the product ELR emergy/FU and the ratio ELR/emergy<br />
per functional unit designers may have an accurate and more<br />
reliable analysis <strong>for</strong> material selection and <strong>for</strong> the determination<br />
of the best recycling rate to be used.<br />
The main conclusion is that emergy accounting is very valuable<br />
<strong>for</strong> incorporating environmental <strong>as</strong>pects in the development of<br />
more sustainable products. However, a reflection on what would be<br />
a more sustainable product and what would be the contribution of<br />
<strong>Ecodesign</strong> <strong>for</strong> the achievement of this product is needed.<br />
The best choice among the four options presented is the<br />
production of PET-R bottles <strong>for</strong> this Brazilian c<strong>as</strong>e study. PET-R<br />
bottles cause less damage to the environment than aluminum cans,<br />
and despite the reduction of the environmental load achieved by<br />
the implementation of a recycling stage, the environmental load of<br />
the PET-R bottles production is still very high, indicating that this<br />
process, <strong>as</strong> many others under human control, contributes to the<br />
reduction of the carrying capacity of the earth beyond an acceptable<br />
limit. The PET production life cycle is b<strong>as</strong>ed on the use of a nonrenewable<br />
resource and <strong>as</strong> the carrying capacity of the earth is<br />
exceeded, the whole system will be stressed over time, going into<br />
decline and finally collapsing.<br />
Acknowledgements<br />
This study had financial support from Vice-Reitoria de Pos-<br />
Gradução e Pesquisa da Universidade Paulista signatory of The<br />
<strong>In</strong>ternational Declaration on <strong>Cleaner</strong> <strong>Production</strong>, a voluntary but<br />
public statement of commitment to the strategy and practice of<br />
cleaner production. The authors thank the anonymous reviewers,<br />
whose comments largely improved this paper. Special thanks are<br />
addressed to Prof. Donald Huisingh, whose sharp observations have<br />
considerably improved the manuscript, and with his comments<br />
lead us to understand the main contribution of our work.<br />
References<br />
[1] de Bakker FGA, Fisscher OAM, Brack AJP. Organizing product oriented environmental<br />
management from a firm’s perspective. Journal of <strong>Cleaner</strong><br />
<strong>Production</strong> 2002;10:455–64.<br />
[2] Vogtlander JG, Bijma A, Brezet HG. Communicating the ecoefficiency of<br />
products and services by means of the eco-cost/value model. Journal of<br />
<strong>Cleaner</strong> <strong>Production</strong> 2002;10:57–67.<br />
[3] Davis G, Wilt CA, Dillon PS, Fishbein BK. Extended producer responsibility:<br />
a new principle <strong>for</strong> product-oriented pollution prevention. Report prepared<br />
under cooperative agreement with the United States Environmental Protection<br />
Agency Office of Solid W<strong>as</strong>te; 1997.<br />
[4] Fiksel J. Design <strong>for</strong> environment: creating eco-efficient products and<br />
processes. New York: McGraw-Hil; 1996.<br />
[5] Lifset RE. Take it back: extended producer responsibility <strong>as</strong> a <strong>for</strong>m of incentive-b<strong>as</strong>ed<br />
environmental policy. Journal of Resource Management and<br />
Technology 1993;21:163–75.<br />
[6] OECD (Organisation <strong>for</strong> Economic Co-operation and Development). Pollution<br />
prevention and control extended producer responsibility in the OECD area.<br />
Ph<strong>as</strong>e 1 report. no. 66. Paris; 1996.<br />
[7] de Bakker FGA, Nijhof A. Responsible chain management: a capability<br />
<strong>as</strong>sessment framework. Business Strategy and the Environment<br />
2002;11(1):63–75.<br />
[8] Br<strong>as</strong> B. <strong>In</strong>corporating environmental issues in product realization. (United<br />
Nations UNEP/IE invited contribution). <strong>In</strong>dustry and Environment 1997;20<br />
(1–2):7–13.<br />
[9] van Hemel CG, Brezet JC. <strong>Ecodesign</strong>, a promising approach to sustainable<br />
production and consumption. Paris: United Nations Environment Programme<br />
(UNEP); 1996.<br />
[10] van Weenen JC. Towards sustainable product development. Journal of <strong>Cleaner</strong><br />
<strong>Production</strong> 1995;3:95–100.<br />
[11] Knight P, Jenkins JO. Adopting and applying eco-design techniques: a practitioners<br />
perspective. Journal of <strong>Cleaner</strong> <strong>Production</strong> 2008;17:549–58.<br />
[12] Zackrisson M, Rocha C, Christiansen K, Jarnehammar A. Stepwise environmental<br />
product declarations: ten SME c<strong>as</strong>e studies. Journal of <strong>Cleaner</strong><br />
<strong>Production</strong> 2008;16(17):1872–86.<br />
[13] N<strong>as</strong>h HA. The European Commission’s sustainable consumption and production<br />
and sustainable industrial policy action plan. Journal of <strong>Cleaner</strong><br />
<strong>Production</strong> 2008;17:496–8.
C.M.V.B. Almeida et al. / Journal of <strong>Cleaner</strong> <strong>Production</strong> 18 (2010) 32–43 43<br />
[14] Tukker A, Emmert S, Charter M, Vezzoli C, Sto E, Andersen MM, et al. Fostering<br />
change to sustainable consumption and production: an evidence b<strong>as</strong>ed view.<br />
Journal of <strong>Cleaner</strong> <strong>Production</strong> 2008;16(11):1218–25.<br />
[15] Duarte AP, Martins P, Alexandre J. Pro-active behaviour induction by integration<br />
of sustainability in business strategic management: INOVE project c<strong>as</strong>e<br />
study. Journal of <strong>Cleaner</strong> <strong>Production</strong> 2008;16(10):1127–32.<br />
[16] Kurk F, Eagan P. The value of adding design-<strong>for</strong>-the-environment to pollution<br />
prevention <strong>as</strong>sistance options. Journal of <strong>Cleaner</strong> <strong>Production</strong> 2008;16(6):<br />
722–6.<br />
[17] Gehin A, Zwolinski P, Brissaud D. A <strong>tool</strong> to implement sustainable end-of-life<br />
strategies in the product development ph<strong>as</strong>e. Journal of <strong>Cleaner</strong> <strong>Production</strong><br />
2008;16(5):566–76.<br />
[18] Mathieux F, Froelich D, Moszkowicz P. ReSICLED: a new recovery-conscious<br />
design method <strong>for</strong> complex products b<strong>as</strong>ed on a multicriteria <strong>as</strong>sessment of<br />
the recoverability. Journal of <strong>Cleaner</strong> <strong>Production</strong> 2008;16(3):277–98.<br />
[19] Krozer Y. Life cycle costing <strong>for</strong> innovations in product chains. Journal of<br />
<strong>Cleaner</strong> <strong>Production</strong> 2008;16(3):310–21.<br />
[20] Platcheck ER, Schaeffer L, Kindlein Jr W, Cândido LHA. Methodology of ecodesign<br />
<strong>for</strong> the development of more sustainable electro-electronic equipments.<br />
Journal of <strong>Cleaner</strong> <strong>Production</strong> 2008;16(1):75–86.<br />
[21] Park Pil-Ju, Tahara K. Quantifying producer and consumer-b<strong>as</strong>ed eco-efficiencies<br />
<strong>for</strong> the identification of key ecodesign issues. Journal of <strong>Cleaner</strong><br />
<strong>Production</strong> 2008;16(1):95–104.<br />
[22] Aoe T. Eco-efficiency and ecodesign in electrical and electronic products.<br />
Journal of <strong>Cleaner</strong> <strong>Production</strong> 2007;15(15):1406–14.<br />
[23] Byggeth S, Broman G, Robèrt KH. A method <strong>for</strong> sustainable product development<br />
b<strong>as</strong>ed on a modular system of guiding questions. Journal of <strong>Cleaner</strong><br />
<strong>Production</strong> 2007;15(1):1–11.<br />
[24] Waage SA. Re-considering product design: a practical ‘‘road-map’’ <strong>for</strong> integration<br />
of sustainability issues. Journal of <strong>Cleaner</strong> <strong>Production</strong> 2007;15(7):<br />
638–49.<br />
[25] Millet D, Bistagnino L, Lanzavecchia C, Camous R, Poldma T. Does the potential<br />
of the use of LCA match the design team needs Journal of <strong>Cleaner</strong> <strong>Production</strong><br />
2007;15(4):335–46.<br />
[26] Le Pochat S, Bertoluci G, Froelich D. <strong>In</strong>tegrating ecodesign by conducting<br />
changes in SMEs. Journal of <strong>Cleaner</strong> <strong>Production</strong> 2007;15(7):671–80.<br />
[27] Lagerstedt J. Functional and environmental factors in early ph<strong>as</strong>es of product<br />
development – eco functional matrix. PhD dissertation, KTH, January 24;<br />
2003.<br />
[28] Knight W. Product design <strong>for</strong> manufacture and <strong>as</strong>sembly. NY: Boothroyd<br />
Dewhurst <strong>In</strong>c./Marcel Dekker; 1994.<br />
[29] Luttropp C, Lagerstedt J. <strong>Ecodesign</strong> and the ten golden rules: generic advice <strong>for</strong><br />
merging environmental <strong>as</strong>pects into product development. Journal of <strong>Cleaner</strong><br />
<strong>Production</strong> 2006;14:1396–408.<br />
[30] Cramer J. Towards innovative more eco-efficient product strategies. Journal of<br />
Sustainable Product Design 1997;1:7–16.<br />
[31] Stevels ALN. Moving companies towards sustainability through ecodesign:<br />
conditions <strong>for</strong> success. Journal of Sustainable Product Design 1997;3:47–55.<br />
[32] Rodrigo J, C<strong>as</strong>tells F. Electrical and electronic: practical ecodesign guide. Tarrogona,<br />
Spain: University Rovira i Virgili; 2002.<br />
[33] <strong>In</strong>stitute <strong>for</strong> Product Development DTU Denmark and Danish Toxicology<br />
Center, http://www.ecodesignguide.dk [accessed 10.08].<br />
[34] Fercucci F, Tompkins D. Automotive interiors: design <strong>for</strong> recyclability. Warrendale,<br />
USA: SAE technical paper; 1991. SP 867.<br />
[35] Luttropp C. <strong>Ecodesign</strong> with focus on product structures. <strong>In</strong>: Hundahl MS,<br />
editor. Mechanical life cycle handbook. New York: Marcel Dekker; 2001.<br />
[36] Herring H. Is energy efficiency environmentally friendly Energy & Environment<br />
2000;11:313–25.<br />
[37] Lovins AB. Negawatts: twelve transitions, eight improvements and one<br />
distraction. Energy Policy 1996;24:331–43.<br />
[38] Tischner U. Sustainability by design: new targets and new <strong>tool</strong>s <strong>for</strong> designers.<br />
Journal of Sustainable Product Design 1997;3:28–33.<br />
[39] ADME French agency <strong>for</strong> the environment and energy management SMILE.<br />
webpage, http://www.smile-europe.org/index.html [accessed in 05.08].<br />
[40] Rydh CJ, Sun M. Life cycle inventory data <strong>for</strong> materials grouped according to<br />
environmental and material properties. Journal of <strong>Cleaner</strong> <strong>Production</strong><br />
2005;13:1258–68.<br />
[41] Young SB, Vanderburg WH. Applying environmental life-cycle analysis to<br />
materials. Journal of the Minerals Metals Materials Society 1994;46(4):<br />
22–7.<br />
[42] Young SB. Materials in LCA. <strong>In</strong>: Curran MA, editor. Environmental life-cycle<br />
<strong>as</strong>sessment. McGraw-Hill; 1996.<br />
[43] Koroneos C, Dompros A, Bovea MD, Gallardo A. Environmental <strong>as</strong>sessment of<br />
brick production in Greece. Building and Environment 2007;42:2114–23.<br />
[44] Michelsen O, Fet AM, Dahlsrud A. The influence of impact <strong>as</strong>sessment<br />
methods on materials selection <strong>for</strong> eco-design. Materials and Design<br />
2006;27:209–15.<br />
[45] Karlsson R, Luttropp C, editors. EcoDesign: what’s happening Journal of<br />
<strong>Cleaner</strong> <strong>Production</strong> 2006;14(15–16):1291–450.<br />
[46] Khan FI, Sadiq R, Veitch B, Bovea MD, Wang B. Life cycle iNdeX (L<strong>In</strong>X): a new<br />
indexing procedure <strong>for</strong> process and product design and decision-making.<br />
Journal of <strong>Cleaner</strong> <strong>Production</strong> 2004;12:59–76.<br />
[47] Bovea MD, Vidal R. <strong>In</strong>cre<strong>as</strong>ing product value by integrating environmental<br />
impact, costs and customer valuation. Resources, Conservation and Recycling<br />
2004;41:133–45.<br />
[48] Andersson K, Ohlsson T. <strong>In</strong>cluding environmental <strong>as</strong>pects in production<br />
development: a c<strong>as</strong>e study of tomato ketchup. Lebensmittel-Wissenschaft<br />
und-Technologie 1999;32:134–41.<br />
[49] Itsubo N, <strong>In</strong>aba A. Assessment of environmental impact of manufacturing steel<br />
considering physical damage to human health. Materials Transactions<br />
2003;44(1):167–72.<br />
[50] Ayres RU, Kneese AV. <strong>Production</strong>, consumption, and externalities. American<br />
Economic Review 1989;59:282–97.<br />
[51] Ayres RU. <strong>In</strong>dustrial metabolism, technology and environment. National<br />
Academy Press; 1989.<br />
[52] Ayres RU, Simonis UE. <strong>In</strong>dustrial metabolism: restructuring <strong>for</strong> sustainable<br />
development. United Nations University Press; 1994.<br />
[53] Bringezu S, Behrensmeier R, Schütz H. Material flow accounts part I general<br />
<strong>as</strong>pects, aluminum, national overall accounts. Wuppertal <strong>In</strong>stitute, Department<br />
<strong>for</strong> Material Flows and Structural Change; 1995.<br />
[54] Giannetti BF, Almeida CMVB. <strong>In</strong>dustrial ecology: concepts, <strong>tool</strong>s and applications.<br />
São Paulo: Edgard Blücher; 2005 [in Portuguese].<br />
[55] Giannetti BF, Bonilla SH, Almeida CMVB. Developing eco-technologies:<br />
a possibility to minimize environmental impact in Southern Brazil. Journal of<br />
<strong>Cleaner</strong> <strong>Production</strong> 2004;12(4):361–8.<br />
[56] Giannetti BF, Bonilla SH, Silva IR, Almeida CMVB. <strong>Cleaner</strong> production practices<br />
in a medium size gold-plated jewelry company in Brazil: when little changes<br />
make the difference. Journal of <strong>Cleaner</strong> <strong>Production</strong> 2008;16:1106–17.<br />
[57] Franklin USA LCI Datab<strong>as</strong>e. Available from: http://www.fal.com; 1998<br />
[accessed 05.08].<br />
[58] IVAM LCA Datab<strong>as</strong>e. Available from: http://www.ivambv.uva.nl/uk/index.htm;<br />
2003.<br />
[59] Giannetti BF, Silva CC, Bonilla SH, Almeida CMVB. The reliability of experts<br />
opinions in constructing a composite environmental index: The c<strong>as</strong>e of ESI<br />
2005. Journal of Environmental Management June 2009;90(8):2448–59.<br />
[60] Ulgiati S, Brown MT, B<strong>as</strong>tianoni S, Marchettini N. <strong>Emergy</strong> b<strong>as</strong>ed indices and<br />
ratios to evaluate sustainable use of resources. Ecological Engineering<br />
1995;5:497–517.<br />
[61] Ulgiati S, Brown MT. Quantifying the environmental support <strong>for</strong> the dilution<br />
and abatement of process emissions: the c<strong>as</strong>e of electricity production. Journal<br />
of <strong>Cleaner</strong> <strong>Production</strong> 2002;10(4):37–50.<br />
[62] Daly HE. Commentary: toward some operational principles of sustainable<br />
development. Ecological Economics 1990;2:1–6.<br />
[63] Odum HT. Self-organization, trans<strong>for</strong>mity, and in<strong>for</strong>mation. Science<br />
1988;242:1132–9.<br />
[64] Odum HT. Environmental accounting, emergy and environmental decision<br />
making. New York: J. Wiley and Sons <strong>In</strong>c.; 1996.<br />
[65] Brown MT, Ulgiati S. <strong>Emergy</strong> and environmental accounting. <strong>In</strong>: Cleveland C,<br />
editor. Encyclopedia of energy. Ox<strong>for</strong>d, UK: Academic Press, Elsevier; 2004.<br />
[66] Rebitzer G, Ekvall T, Frischknecht R, Hunkeler D, Norris G, Rydberg T,<br />
Schmidt W-P, Suh S, Weidema BP, Pennington DW. Life cycle <strong>as</strong>sessment part<br />
1: framework, goal and scope definition, inventory analysis, and applications.<br />
Environment <strong>In</strong>ternational 2004;30:701–20.<br />
[67] Valt RBG. Análise do ciclo de vida de embalagens de PET, de alumínio e de<br />
vidro para refrigerantes no Br<strong>as</strong>il variando a taxa de reciclagem dos materiais.<br />
[Life Cycle Assessment of PET, aluminum and gl<strong>as</strong>s packages <strong>for</strong> <strong>for</strong> beverage<br />
in Brazil, varying the recycling rate]. M<strong>as</strong>ter thesis, Curitiba, 2004 [in<br />
Portuguese].<br />
[68] Valt RBG. Ciclo de Vida de Embalagens para Bebida no Br<strong>as</strong>il. [Life cycle of<br />
beverage packages in Brazil]. Br<strong>as</strong>ília: Thesaurus; 2007 [in Portuguese].<br />
[69] Anvisa. Portaria n 987, de 8 de dezembro 1998, http://e-legis.anvisa.gov.br<br />
/leisref/public/search.php; 1998 [in Portuguese][accessed 12.08].<br />
[70] MERCOSUL/GMC/RES N 25/99-Regulamento Técnico MERCOSUL sobre<br />
Embalagens Descartáveis de Polietileno Tereftalato – PET – Multicamada<br />
Destinad<strong>as</strong> ao Acondicionamento de Bebid<strong>as</strong> Não-Alcoólic<strong>as</strong> Carbonatad<strong>as</strong>,<br />
http://www.sice.o<strong>as</strong>.org/default_s.<strong>as</strong>p [in Portuguese][accessed in December<br />
2008].<br />
[71] Buenfil AA. <strong>Emergy</strong> evaluation of water. PhD Dissetation University of Florida;<br />
2001.<br />
[72] Ulgiati S, Brown MT. Quantifying the environmental support <strong>for</strong> dilution and<br />
abatement of process emissions: The c<strong>as</strong>e of electricity production. Journal of<br />
<strong>Cleaner</strong> <strong>Production</strong> 2002;10:335–48.<br />
[73] Caruso C, Catenacci G, Marchettini N, Principi I, Tiezzi E. <strong>Emergy</strong> b<strong>as</strong>ed analysis<br />
of Italian electricity production system. Journal of Thermal Analysis and<br />
Calorimetry 2001;66:265–72.<br />
[74] B<strong>as</strong>tianoni S, Campbell D, Susani L, Tiezzi E. The solar trans<strong>for</strong>mity of oil and<br />
petroleum natural g<strong>as</strong>. Ecological Modelling 2005;186:212–20.<br />
[75] Geber U, Björklund J. The relationship between ecosystem services and<br />
purch<strong>as</strong>ed input in Swedish w<strong>as</strong>tewater treatment systems – a c<strong>as</strong>e study.<br />
Ecological Engineering 2001;18:39–59.<br />
[76] Cao K, Feng X. Distribution of emergy indices and its application. Energy &<br />
Fuels 2007;21:1717–23.<br />
[77] Brazilian Aluminum Association, http://www.abal.org.br/downloads/rsia_<br />
abal_en.pdf [accessed 01.09].<br />
[78] ABIPET – ASSOCIAÇÃO BRASILEIRA DA INDÚSTRIA DO PET. Recycling: recycling<br />
rates of post-consumer PET packages in 2006 [in Portuguese], www.<br />
abipet.org.br [accessed 12.08].<br />
[79] Bonilla SH, Guarnetti R, Almeida CMVB, Giannetti BF. Sustainability <strong>as</strong>sessment<br />
of giant bamboo plantation in Brazil: exploring the influence of labor,<br />
time and space. Journal of <strong>Cleaner</strong> <strong>Production</strong>, in this Special Issue.