Catalysts - The Freedonia Group
Catalysts - The Freedonia Group
Catalysts - The Freedonia Group

You also want an ePaper? Increase the reach of your titles
YUMPU automatically turns print PDFs into web optimized ePapers that Google loves.
US Outlook for<br />
<strong>Catalysts</strong><br />
with forecasts toi 2005 and 2010<br />
• Demand for process catalysts (which exclude environmental applications) is forecast to<br />
increase 4.4 percent per year to $3.3 billion in 2005, driven by accelerating growth in<br />
the petroleum refining sector and continued strength in new polymerization technologies.<br />
• Best opportunities in the chemical processing catalysts market are expected in the<br />
fine chemical sector, especially in pharmaceuticals, where the development of new<br />
chiral and enzyme catalysts is spurring gains.<br />
• <strong>The</strong> top seven catalyst suppliers -- Engelhard, Grace Davison, Akzo Nobel, Royal<br />
Dutch/Shell (via Criterion, CRI Catalyst and other operations), UOP, Atofina and<br />
Sud-Chemie -- accounted for 45 percent of the US market in the year 2000.
<strong>Freedonia</strong> Industry Study #1494<br />
<strong>Catalysts</strong><br />
Study Publication Date: November 2001<br />
Price: $3,700<br />
Pages: 271<br />
<strong>Catalysts</strong>, a new study from <strong>The</strong> <strong>Freedonia</strong> <strong>Group</strong>, provides<br />
you with an in-depth analysis of major trends in the<br />
industry and the outlook for product segments and major<br />
markets -- critical information to help you with strategic<br />
planning.<br />
This brochure gives you an indication of the scope, depth<br />
and value of <strong>Freedonia</strong>'s new study, <strong>Catalysts</strong>. Ordering<br />
information is included on the back page of the brochure.<br />
Brochure Table of Contents<br />
Study Highlights ............................................................................... 2<br />
Table of Contents and List of Tables and Charts ............................. 4<br />
Sample Pages and Sample Tables from:<br />
Market Environment .................................................... 6<br />
<strong>Catalysts</strong> by Market ..................................................... 7<br />
<strong>Catalysts</strong> by Material ................................................... 8<br />
Industry Structure ........................................................ 9<br />
Company Profiles ...................................................... 10<br />
List of Companies Profiled ........................................ 11<br />
Forecasting Methodology ............................................................... 12<br />
About the Company ....................................................................... 13<br />
Advantages of <strong>Freedonia</strong> Reports ................................................... 13<br />
About Our Customers .................................................................... 14<br />
Other Titles From <strong>Freedonia</strong> ......................................................... 15<br />
Ordering Information..................................................................... 16
Study Highlights<br />
• Demand for process catalysts (which exclude environmental<br />
applications) is forecast to increase 4.4 percent<br />
per year to $3.3 billion in 2005, driven by accelerating<br />
growth in the petroleum refining sector and continued<br />
strength in new polymerization technologies.<br />
• Petroleum refining will continue to be the largest<br />
market for catalysts, with advances driven by new<br />
government regulations, an increasing emphasis on<br />
heavy sour crude feedstocks and the impending<br />
phaseout of MTBE oxygenates.<br />
• Polymerization catalysts will continue to record the<br />
fastest gains of the three major catalyst segments,<br />
although growth will decelerate through 2005.<br />
• Best opportunities in the chemical processing catalysts<br />
market are expected in the fine chemical sector,<br />
especially in pharmaceuticals, where the development<br />
of new chiral and enzyme catalysts is spurring gains.<br />
• Metals will continue to dominate the catalyst market<br />
in value terms due primarily to the wide applicability<br />
of base metals and the high performance of precious<br />
metals.<br />
• <strong>The</strong> top seven catalyst suppliers -- Engelhard, Grace<br />
Davison, Akzo Nobel, Royal Dutch/Shell (via Criterion,<br />
CRI Catalyst and other operations), UOP,<br />
Atofina and Sud-Chemie -- accounted for 45 percent<br />
of the US market in the year 2000.<br />
* <strong>Catalysts</strong> used in environmental applications, such as catalytic<br />
converters, are not covered within the scope of the study.<br />
<strong>Catalysts</strong> #1494<br />
<strong>Freedonia</strong> Industry Study<br />
2
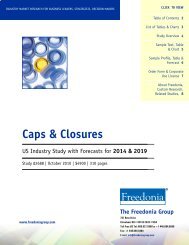
Study Highlights<br />
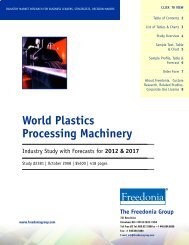
Catalyst Demand, 2000<br />
Petroleum Refining<br />
41.2%<br />
Chemical Processing<br />
32.6%<br />
Polymerization<br />
26.2%<br />
Catalyst Demand<br />
(million dollars)<br />
% Annual Growth<br />
Item 1995 2000 2005 2010 00/95 05/00<br />
Nondurable Goods Shpts (bil $) 1595 1887 2192 2620 3.4 3.0<br />
$ catalysts/000$ nondurables 1.39 1.41 1.51 1.57 — —<br />
SUMMARY TABLE<br />
Catalyst Demand 2220 2670 3310 4120 3.8 4.4<br />
Petroleum Refining 995 1100 1340 1650 2.0 4.0<br />
Chemical Processing 720 870 1050 1270 3.9 3.8<br />
Polymerization 505 700 920 1200 6.7 5.6<br />
$/lb 0.35 0.38 0.42 0.47 1.7 2.2<br />
$/lb excluding alkylation 2.04 2.22 2.48 2.81 1.7 2.2<br />
Catalyst Demand (mil lb) 6420 7035 7810 8690 1.8 2.1<br />
© Copyright by <strong>The</strong> <strong>Freedonia</strong> <strong>Group</strong>, Inc.<br />
<strong>Catalysts</strong> #1494<br />
Order form on last page<br />
3
List of Contents,<br />
Tables and Charts<br />
I. EXECUTIVE SUMMARY<br />
Summary Table ..............................................................3<br />
II.<br />
III.<br />
MARKET ENVIRONMENT<br />
General ..............................................................................4<br />
Macroeconomic Outlook ....................................................4<br />
Table - Macroeconomic Environment .............................6<br />
Manufacturing Outlook .....................................................7<br />
Table - Manufacturers’ Shipments ..................................9<br />
Market Volatility ................................................................9<br />
Table - Catalyst Market Volatility, 1990-2000 ............. 11<br />
Chart - Catalyst Market Volatility ................................. 11<br />
Pricing Trends ................................................................ 12<br />
Table - Catalyst Pricing Trends .................................... 14<br />
Environmental & Regulatory Issues ................................. 14<br />
Clean Air Act Regulations ............................................ 15<br />
Oxygenated Gasoline Program ..................................... 16<br />
Reformulated Gasoline Program ................................... 17<br />
Diesel Fuel Regulations ................................................ 19<br />
Resource Conservation and Recovery Act ...................... 20<br />
Catalyst Reclamation & Disposal .................................. 21<br />
International Activity ...................................................... 23<br />
OVERVIEW<br />
Supply & Demand ......................................................... 24<br />
Table - Catalyst Supply & Demand ............................. 26<br />
Foreign Trade ................................................................. 26<br />
Table - Catalyst Imports & Exports .............................. 28<br />
Chart - Catalyst Imports by Source, 2000 ..................... 28<br />
Chart - Catalyst Exports by Destination, 2000 ............. 29<br />
Market Overview ............................................................ 29<br />
Table - Catalyst Demand by Market ............................ 30<br />
Chart - Catalyst Market Value, 2000 ........................... 31<br />
Chart - Catalyst Market Volume, 2000 ........................ 31<br />
IV. PETROLEUM REFINING CATALYSTS<br />
General ........................................................................... 32<br />
Refined Petroleum Products Outlook ............................... 33<br />
Table - Refined Petroleum Production ......................... 35<br />
Petroleum Refining Process Outlook ................................ 36<br />
Table - Downstream Charge Capacity .......................... 38<br />
Chart - Gasoline Production Flow Chart ...................... 39<br />
Catalyst Demand ............................................................ 40<br />
Table - Petroleum Refining Catalyst Demand ............... 42<br />
Fluid Catalytic Cracking (FCC) ................................... 42<br />
Table - Fluid Catalytic Cracking Catalyst Demand .... 45<br />
Hydroprocessing ......................................................... 46<br />
Table - Hydroprocessing Catalyst<br />
Demand by Process & Material .............................. 48<br />
Hydrotreating .......................................................... 48<br />
Hydrocracking ......................................................... 50<br />
Alkylation ................................................................... 52<br />
Table - Petroleum Alkylation Catalyst Demand ......... 54<br />
Other .......................................................................... 54<br />
Table - Other Petroleum Refining Catalyst<br />
Demand by Process & Material .............................. 56<br />
Suppliers & Market Share ................................................ 57<br />
Chart - Petroleum Refining Catalyst Market Share, 2000 .. 58<br />
V. CHEMICAL PRODUCTION CATALYSTS<br />
General ........................................................................... 60<br />
Chemical Industry Outlook ............................................. 61<br />
Table - Chemical Shipments ........................................ 63<br />
Catalyst Types ................................................................ 63<br />
Table - Chemical Processing Catalyst<br />
Demand by Process & Source .................................... 65<br />
Organic Synthesis ........................................................ 66<br />
Table - Organic Synthesis Catalyst Demand .............. 67<br />
Oxidation ................................................................... 67<br />
Table - Oxidation Catalyst Demand ......................... 69<br />
Synthesis Gas .............................................................. 70<br />
Table - Syngas Catalyst Demand .............................. 72<br />
Hydrogenation ............................................................ 73<br />
Table - Hydrogenation Catalyst Demand .................. 74<br />
4<br />
<strong>Catalysts</strong> #1494<br />
<strong>Freedonia</strong> Industry Study
VI.<br />
VII.<br />
Other .......................................................................... 74<br />
Table - Other Chemical Processing <strong>Catalysts</strong> Demand ... 76<br />
Table - Chemical Processing Catalyst<br />
Demand by Product & Process ............................... 77<br />
Catalyst Applications ....................................................... 77<br />
Fine Chemicals ............................................................ 78<br />
Oleochemicals ............................................................. 79<br />
Inorganics ................................................................... 80<br />
Other .......................................................................... 82<br />
New Developments ......................................................... 83<br />
Chiral Technology ...................................................... 83<br />
Biocatalysts .................................................................. 85<br />
High-Throughput Experimentation ............................ 86<br />
Suppliers & Market Share ................................................ 87<br />
Chart - Chemical Processing Catalyst Market Share, 2000 ... 88<br />
POLYMER PRODUCTION CATALYSTS<br />
General ........................................................................... 89<br />
Plastic Industry Outlook .................................................. 90<br />
Table - Plastics Supply & Demand .............................. 91<br />
Catalyst Types ................................................................ 92<br />
Table - Polymerization Catalyst<br />
Demand by Type & Material .................................... 93<br />
Ziegler-Natta & Other Conventional Types ................. 94<br />
Reaction Initiators ........................................................ 96<br />
Metallocene & Other Next Generation <strong>Catalysts</strong> .......... 98<br />
Catalyst Applications ..................................................... 101<br />
Table - Polymerization Catalyst Demand by Application ....102<br />
Polyolefins ................................................................ 102<br />
Other ........................................................................ 104<br />
Suppliers & Market Share .............................................. 105<br />
Chart - Polymerization Catalyst Market Share, 2000 ... 106<br />
CATALYST MATERIALS<br />
General ......................................................................... 107<br />
Table - Catalyst Demand by Material ......................... 109<br />
Metals ......................................................................... 109<br />
Table - Metal Catalyst Demand ................................. 111<br />
Base Metals ............................................................... 111<br />
VIII.<br />
Table - Base Metal Catalyst Demand ...................... 113<br />
Nickel ................................................................... 113<br />
Other Base Metals .................................................. 115<br />
Precious Metals .......................................................... 116<br />
Table - Precious Metal Catalyst<br />
Demand by Metal & Process ................................ 119<br />
Chemicals ..................................................................... 119<br />
Table - Chemical Catalyst Demand ............................ 120<br />
Acids ......................................................................... 120<br />
Table - Acid Catalyst Demand by Type & Market .... 122<br />
Peroxides ................................................................... 123<br />
Table - Peroxide Catalyst Demand ......................... 125<br />
Other Chemicals ....................................................... 125<br />
Table - Other Chemical <strong>Catalysts</strong> Demand ............. 128<br />
Organometallics ............................................................ 128<br />
Table - Organometallic Catalyst Demand ................... 131<br />
Zeolites ......................................................................... 132<br />
Table - Zeolite Catalyst Demand ................................ 134<br />
Other ......................................................................... 134<br />
Table - Other Material-Based <strong>Catalysts</strong><br />
Demand by Type & Market .................................... 138<br />
INDUSTRY STRUCTURE<br />
General ......................................................................... 139<br />
Market Share ................................................................ 140<br />
Chart - Process Catalyst Market Share, 2000 ............... 142<br />
Competitive Strategies ................................................... 143<br />
Product Differentiation .............................................. 143<br />
Research & New Product Development ..................... 144<br />
Market Focus ............................................................ 146<br />
Low-Cost Leadership ................................................. 147<br />
Catalyst Services ........................................................ 148<br />
Mergers, Acquisitions & Divestitures .............................. 149<br />
Table - Selected Acquisitions & Divestitures ............... 151<br />
Cooperative Agreements ................................................ 152<br />
Table - Selected Cooperative Agreements .................... 154<br />
Manufacturing ............................................................. 160<br />
Marketing & Distribution ............................................. 162<br />
Table - Selected Catalyst Producers, 2000 .................. 167<br />
Company Profiles ................................................... 167-271<br />
<strong>Catalysts</strong> #1494<br />
Order form on last page<br />
5
Market Environment<br />
<strong>The</strong> Market Environment Section<br />
discusses factors influencing catalyst<br />
demand, including pricing trends and<br />
environmental issues.<br />
MARKET ENVIRONMENT<br />
This information provides you with an<br />
understanding and an analysis of the<br />
climate in which the catalysts industry<br />
operates.<br />
Catalyst Reclamation & Disposal<br />
As catalysts are used in petroleum refining and chemical processing reactions, they<br />
can age or become poisoned by the build-up of metals or other materials. Manufacturers<br />
have three options to deal with these spent catalysts and their metallic<br />
byproducts: regeneration, reclamation and disposal.<br />
Regeneration can recover between 75 and 95 percent of a catalyst’s original<br />
activity, extending the life of the catalyst and decreasing disposal costs. One<br />
SAMPLE PAGE<br />
commonly regenerated catalyst is sulfuric acid, which is used in the production of<br />
gasoline in oil refineries. However, a regenerated catalyst may only last 50 to 90<br />
percent of the life of its fresh state. As a general rule, after the catalyst can no<br />
longer be regenerated to at least 75 percent of its original activity, it is reclaimed<br />
or disposed of. In addition, permanent poisons (e.g., arsenic, lead, vanadium, iron<br />
or silicon) in levels greater than about two percent generally spoil a catalyst for<br />
regeneration. Companies such as the Catalyst Recovery <strong>Group</strong> specialize in the<br />
regeneration of catalyst metals.<br />
When a catalyst is unfit for regeneration, companies can choose to reclaim the<br />
metals and/or landfill the catalysts. Major factors in metal reclamation include<br />
proper physical handling, transportation, environmental concerns, potential end<br />
uses of the catalysts and the choice of an effective reclamation firm. Proper<br />
handling and transportation requires the use of packaging approved by the US<br />
Department of Transportation (DOT). Shipments of mixed catalysts can be most<br />
troublesome, since each type must be segregated and properly labeled. <strong>Catalysts</strong><br />
must be tested prior to shipment to determine if the materials are classified as<br />
hazardous substances. A material safety data sheet must accompany each catalyst<br />
sent for reclamation; this sheet details the analysis of the catalyst and lists<br />
procedures and precautions for shipping and handling.<br />
Despite these factors, reclamation of the metal in a catalyst is often an attractive<br />
alternative to disposal. Although metals reclamation may be expensive, the<br />
6<br />
<strong>Catalysts</strong> #1494<br />
<strong>Freedonia</strong> Industry Study
<strong>Catalysts</strong> by Market<br />
<strong>The</strong> Catalyst Sections provide demand<br />
for historical years and forecast growth<br />
to 2005 and 2010.<br />
This information helps you:<br />
• Analyze your company's<br />
growth potential in<br />
the industry.<br />
CHEMICAL PRODUCTION CATALYSTS<br />
Catalyst Applications - Fine Chemicals<br />
Demand for catalysts used in fine chemical applications is forecast to increase 4.4<br />
percent per annum to $385 million in 2005, the fastest growth of any chemical<br />
SAMPLE PAGE<br />
catalyst application. Demand will benefit from continued healthy gains in US<br />
pharmaceutical production and the increasing use of chiral catalysts. However, in<br />
general, growth will be slowed by maturity in the fine chemical market and slowing<br />
in specialty sectors such as flavors and fragrances and agrochemicals.<br />
• Outline your strategic<br />
plans for five and ten<br />
years out.<br />
• Establish sales goals.<br />
Products synthesized for the fine chemicals industry using catalysts include flavors<br />
and fragrances; herbicides, fungicides and insecticides; and active ingredients and<br />
intermediates for pharmaceuticals. <strong>Catalysts</strong> used include organometallic types, as<br />
well as those based on aluminum, nickel, copper, cobalt, platinum and palladium.<br />
<strong>The</strong>se compounds catalyze a variety of reactions such as oxidation, reduction, and<br />
Heck reactions, which form carbon-carbon double bonds.<br />
Growth of fine chemicals catalysts will stem primarily from increased demand for<br />
chiral compounds. In chiral applications catalysts can be used both to synthesize<br />
single-enantiomer products and to separate a racemic mixture into its enantiomers.<br />
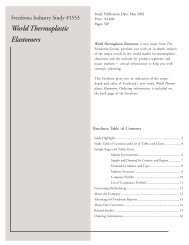
Hydroprocessing Catalyst Demand by Process & Material<br />
<strong>The</strong>se catalysts are becoming increasingly important in pharmaceutical applications<br />
since many drugs exhibit fewer side effects when delivered as a (million dollars)<br />
single<br />
Item enantiomer. Other opportunities lie 1990 in the flavors 1995and fragrances 2000 industry. 2005 For 2010<br />
example, in 2001 Rhodia ChiRex used its JACOBSEN catalyst technology to<br />
Hydroprocessing create Capacity single-enantiomer (mil bbl) fragrances, 3950 the first nonpharmaceutical 4490 4795 use 5330 of the 6150<br />
lb catalyst/000 technology. bbl capacity 10.9 13.1 15.6 17.3 19.0<br />
Hydroprocessing In addition, <strong>Catalysts</strong> both (mil heterogeneous lb) catalysts 43 and biocatalysts 59 will 75 experience 92 growth 117<br />
$/lb opportunities. Benefits of heterogeneous 3.72 catalysts 4.92SAMPLE include 4.67 simplifying 5.27<br />
TABLE<br />
the 5.64<br />
separation of product from catalyst. Because of dangers stemming from excess<br />
Hydroprocessing <strong>Catalysts</strong> 160 290 350 485 660<br />
metal content in pharmaceuticals, regulations limit the amounts of certain metals,<br />
By Process:<br />
Hydrotreating 120 245 285 400 555<br />
Hydrocracking 40 45 65 85 105<br />
By Material:<br />
Metals 154 282 342 474 646<br />
Other 6 8 8 11 14<br />
% hydroprocessing 19.8 29.1 31.8 36.2 40.0<br />
Petroleum Refining <strong>Catalysts</strong> 810 995 1100 1340 1650<br />
© Copyright by <strong>The</strong> <strong>Freedonia</strong> <strong>Group</strong>, Inc.<br />
<strong>Catalysts</strong> #1494<br />
Order form on last page<br />
7
<strong>Catalysts</strong> by Material<br />
<strong>The</strong> Materials Section analyzes trends<br />
and considers the threats and<br />
opportunities for each major catalyst<br />
material.<br />
<strong>The</strong> information presented will<br />
help you:<br />
• Focus your sales and marketing<br />
efforts on high growth areas.<br />
• Propose new areas for development.<br />
CATALYST MATERIALS<br />
Precious Metals<br />
Nearly all precious metals have significant use as catalysts including gold, silver and<br />
the platinum group metals (platinum, palladium, rhodium, ruthenium, iridium and<br />
osmium). Demand for precious metal catalysts is forecast to grow three percent<br />
SAMPLE PAGE<br />
per annum to $325 million in 2005, a significant from the previous five year pace<br />
despite improvement in the chemical processing sector. Growth in recent years has<br />
been severely impacted by price volatility among precious metals, with platinum,<br />
palladium and rhodium prices skyrocketing in 2000 due to increased demand in the<br />
auto emission sector. Prices are expected to level out at more sustainable levels<br />
over the next decade and this will restrain growth in market value. Also restraining<br />
growth will be trends toward minimizing the use of expensive precious metals and<br />
competition from alternative catalysts. However, demand will benefit from<br />
improving catalyst performance, the development of catalysts based on alloys of<br />
several materials and the increasing popularity of chiral chemistry.<br />
Precious metal catalysts are used for a variety of applications such as naphtha<br />
reforming and selective hydrogenation in refineries and steamcrackers, organic<br />
reactions such as hydrogenation and dehydrogenation, ammonia synthesis, gas<br />
purification, isomerization, reduction and chiral syntheses. For example, silver<br />
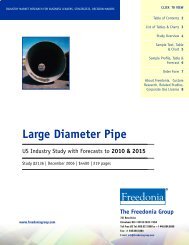
Zeolite Catalyst Demand<br />
(million dollars)<br />
catalyzes such industrially important reactions as the epoxidation of ethylene to<br />
ethylene oxide, which is used to synthesize polyester resins, and the production of<br />
formaldehyde. Demand for precious metal catalysts will benefit from their use in<br />
Item 1990 1995 2000 2005 2010<br />
enantioselective reactions, especially in the pharmaceutical and other fine<br />
chemical industries, as well as their high specificity compared to base metal types.<br />
Gasoline Production (bil bbl) 2540 2770 2996 3180 3370<br />
lbs/000 bbl gasoline For example, ammonia is typically 0.18 produced 0.17 from 0.17natural 0.18 gas using 0.19 an iron<br />
(magnetite) catalyst. However, catalyst producers are switching over to higherperforming<br />
(mil lb) precious metals; 461 Kellogg Brown 479 & Root 515 (KBR) 570 has developed 625 the KBR<br />
SAMPLE TABLE<br />
Zeolite <strong>Catalysts</strong> Demand<br />
$/lb Advanced Ammonia Process, 0.86which 0.88 uses a ruthenium 0.80 catalyst 0.82 on a proprietary 0.87<br />
Zeolite <strong>Catalysts</strong> Demand 397 423 412 470 545<br />
Petroleum Refining 390 413 395 443 504<br />
Chemicals & Polymers © Copyright by <strong>The</strong> <strong>Freedonia</strong> 7<strong>Group</strong>, Inc. 10 17 27 41<br />
% zeolites 22.3 19.1 15.4 14.2 13.2<br />
Total Catalyst Demand 1780 2220 2670 3310 4120<br />
© Copyright by <strong>The</strong> <strong>Freedonia</strong> <strong>Group</strong>, Inc.<br />
8<br />
<strong>Catalysts</strong> #1494<br />
<strong>Freedonia</strong> Industry Study
Industry Structure<br />
Sample page from<br />
<strong>Freedonia</strong> Industry Study<br />
Gain #1117 a better Fractional understanding Horsepower of your Motors<br />
competition and analyze your<br />
company's position in the industry with<br />
information about:<br />
• market share<br />
INDUSTRY STRUCTURE<br />
• competitive strategies<br />
- product differentiation<br />
- research & new product development<br />
- market focus<br />
- low-cost leadership<br />
- catalyst services<br />
• mergers, acquisitions & divestitures<br />
• manufacturing<br />
• marketing & distribution<br />
• cooperative agreements<br />
Research & New Product Development<br />
Growth in the catalyst industry is highly dependent on research and development<br />
(R&D) programs, which are designed to produce new catalysts that provide<br />
increased product yield, fewer undesirable byproducts and reduced process energy<br />
costs. R&D includes everything from developing an initial idea to securing patents<br />
and establishing potential processes and customer benefits.<br />
SAMPLE PAGE<br />
To remain competitive, companies must continually develop new and more<br />
effective catalysts despite necessarily high R&D expenses. <strong>The</strong>se high costs often<br />
threaten the development of low-volume catalysts required in specialty applications<br />
and create significant barriers to companies interested in entering the field.<br />
<strong>The</strong>se expenses have even led to the formation of joint ventures specifically for<br />
R&D. For example, Exxon Mobil and Dow operate a 50/50 joint venture,<br />
Univation Technologies, for the research, development and licensing of technologies<br />
and catalysts for the production of polyethylene.<br />
Although catalyst research activities are distributed among corporations, national<br />
laboratories and universities, the majority of catalyst R&D is conducted by<br />
industry, with national laboratories and universities playing smaller roles. Many<br />
catalyst manufacturers began stepping up R&D efforts in the mid 1990s in order to<br />
capitalize on changing fuel regulations, and others are currently investing in highthroughput<br />
experimentation and chiral chemistry.<br />
Two crucial issues in current catalyst research involve how to make highly<br />
selective catalysts and, subsequently, how to get them on the market in the<br />
shortest possible time. Selectivity is important in reducing the amount of<br />
unwanted byproducts of chemical reactions while optimizing the yield of desired<br />
products. Environmental considerations are becoming increasingly important in<br />
this area as many catalytic byproducts have gained recognition as hazardous<br />
<strong>Catalysts</strong> #1494<br />
Order form on last page<br />
9
Company Profiles<br />
<strong>The</strong> Profiles Section analyzes 44<br />
companies active in the U.S. catalysts<br />
market. <strong>The</strong>se profiles represent a<br />
sampling or cross-section of the types of<br />
companies involved in the industry.<br />
COMPANY PROFILES<br />
Divisions, subsidiaries, joint<br />
ventures, etc., are discussed under<br />
appropriate parent companies.<br />
Sources for profiles included:<br />
• Information provided by<br />
key staff members in the<br />
respective companies<br />
• Annual reports<br />
• 10-K reports<br />
• Security analysts reports<br />
• Corporate product literature<br />
Royal Dutch/Shell <strong>Group</strong> of Companies<br />
30 Carel van Bylandtlaan<br />
2596 HR, <strong>The</strong> Hague<br />
Netherlands<br />
31-70-377-4540<br />
http://www.shell.com<br />
Criterion Catalyst & Technology Company<br />
16825 Northchase Drive, Suite 1000<br />
Houston, TX 77060<br />
281-874-2600<br />
http://www.criterioncatalysts.com<br />
Sales: $149.1 billion (2000)<br />
SAMPLE PAGE<br />
US Sales: $26.1 billion (2000)<br />
Employment: 90,000 (2000)<br />
US Catalyst Sales: $150 million<br />
Key Products: hydroprocessing, reforming and oxidation catalysts<br />
<strong>The</strong> Royal Dutch/Shell <strong>Group</strong> of Companies, which is owned by Royal Dutch<br />
Petroleum Company (60 percent) and the Shell Transport & Trading Company<br />
plc (40 percent), is engaged in the oil, natural gas, chemicals, coal and metals<br />
businesses throughout the world. <strong>The</strong> Company operates in five primary<br />
segments: Exploration and Production; Downstream Gas and Power Generation;<br />
Oil Products; Chemicals; and Corporate and Other.<br />
<strong>The</strong> Company is among the leading suppliers of catalysts to the US market with<br />
about six percent of total sales in the year 2000. <strong>The</strong> Company is the leading<br />
supplier of hydroprocessing catalysts through its Criterion subsidiary and also<br />
© Copyright by <strong>The</strong> <strong>Freedonia</strong> <strong>Group</strong>, Inc.<br />
<strong>Catalysts</strong> #1494<br />
10<br />
<strong>Freedonia</strong> Industry Study
Companies<br />
Profiled<br />
Air Products and Chemicals Incorporated<br />
Akzo Nobel NV<br />
MAKFining<br />
Albemarle Corporation<br />
Alcoa Incorporated<br />
Adcats<br />
Arch Chemicals Incorporated<br />
Avantium Technologies<br />
Combicat<br />
BASF AG<br />
Bayer AG<br />
Borealis AS<br />
Boulder Scientific Company<br />
BP plc<br />
ChevronTexaco Corporation<br />
Advanced Refining Technologies<br />
Crompton Corporation<br />
CK Witco Corporation<br />
Degussa Corporation<br />
Aztec Peroxides Incorporated<br />
E.ON AG<br />
Laporte plc<br />
Dow Chemical Company<br />
Union Carbide Corporation<br />
Univation Technologies LLC<br />
DuPont (EI) de Nemours<br />
Eastman Chemical Company<br />
Engelhard Corporation<br />
Exxon Mobil Corporation<br />
MAKFining<br />
Univation Technologies LLC<br />
FMC Corporation<br />
GenTek Incorporated<br />
Grace (WR) & Company<br />
Advanced Refining Technologies<br />
Davison Chemicals<br />
Haldor Topsoe A/S<br />
Honeywell International Incorporated<br />
AlliedSignal Incorporated<br />
Imperial Chemical Industries plc<br />
Synetix<br />
Institut Francais du Petrole<br />
Procatalyse North America<br />
Japan Energy Corporation<br />
Johnson Matthey plc<br />
mg technologies ag<br />
Zimmer AG<br />
Millennium Chemicals Incorporated<br />
Equistar Chemicals LP<br />
Novolen<br />
Mitsui Chemicals Incorporated<br />
Nippon Shokubai Company Limited<br />
OM <strong>Group</strong> Incorporated<br />
Perstorp AB<br />
Pharmacia Corporation<br />
Monsanto Enviro-Chem Systems Incorporated<br />
Philipp Brothers Chemicals Incorporated<br />
Phillips Petroleum Company<br />
PQ Corporation<br />
Zeolyst International<br />
Rhodia SA<br />
Rohm and Haas Company<br />
Royal Dutch/Shell <strong>Group</strong> of Companies<br />
Basell NV<br />
CRI International Incorporated<br />
Criterion Catalyst & Technology Company<br />
Montell Polyolefins BV<br />
Zeolyst International<br />
Sud-Chemie <strong>Group</strong><br />
United <strong>Catalysts</strong> Incorporated<br />
Total Fina Elf SA<br />
Atofina Chemicals Incorporated<br />
MAKFining<br />
UOP LLC<br />
<strong>Catalysts</strong> #1494<br />
Order form on last page<br />
11
Forecasting Methodology<br />
<strong>Freedonia</strong> does not just collect and reprint<br />
data; <strong>Freedonia</strong> develops data. Our analysts<br />
thoroughly investigate an industry by<br />
extensively interviewing key industry<br />
participants and analyzing information<br />
from sources such as associations, government<br />
and trade literature. Once this<br />
research is complete, <strong>Freedonia</strong> establishes<br />
one set of forecasts. All writing, editing<br />
and forecasting is done in-house to assure<br />
quality and consistency. In cases where<br />
data does not exist, <strong>Freedonia</strong> develops the<br />
data based on input/output ratios, bills of<br />
materials and flow charts. <strong>The</strong> following<br />
chart summarizes <strong>Freedonia</strong>'s methodology:<br />
<strong>The</strong> <strong>Freedonia</strong><br />
Economics <strong>Group</strong><br />
Consistent framework<br />
of economic indicators on . . .<br />
• Nondurable Goods Shipments<br />
• Gasoline Production<br />
• Gross Domestic Product (GDP)<br />
. . . and many others<br />
<strong>Freedonia</strong><br />
In-house Research<br />
• Quantitative forecasting<br />
• Industry structure & market<br />
share analyses<br />
• Product analyses & forecasts<br />
Methodology for<br />
<strong>Catalysts</strong><br />
Extensive Interviews<br />
• Key participants<br />
• Industry experts<br />
• End-users<br />
Proprietary<br />
Electronic Database<br />
• Trade publications<br />
• Government reports<br />
• Corporate literature<br />
• Online databases<br />
. . . and many others<br />
12<br />
<strong>Catalysts</strong> #1494<br />
<strong>Freedonia</strong> Industry Study
About<br />
<strong>The</strong> <strong>Freedonia</strong> <strong>Group</strong><br />
<strong>The</strong> <strong>Freedonia</strong> <strong>Group</strong>, Inc. is a leading international industry study/<br />
database company.<br />
Since 1985, <strong>Freedonia</strong> has published over 1,600 titles covering areas such<br />
as chemicals, coatings and adhesives, building materials, plastics, industrial<br />
components and equipment, health care, packaging, household goods,<br />
security, and many other industries.<br />
<strong>Freedonia</strong> has produced a wide variety of titles, including:<br />
• Waxes<br />
• World Industrial Gases<br />
• Solvents: Green & Conventional<br />
• Activated Carbon<br />
Because <strong>Freedonia</strong> is a reliable information source, our forecasts are cited<br />
in numerous publications such as <strong>The</strong> Wall Street Journal, Chemical Week,<br />
Chemical Market Reporter and Oil and Gas Journal.<br />
Advantages<br />
of <strong>Freedonia</strong> Reports<br />
In-house operations<br />
Because all of our staff work at the same location, interaction<br />
between analysts and departments provides a strong system<br />
of checks and balances.<br />
Consistency<br />
Our Economics <strong>Group</strong> develops indicators that are used by<br />
all analysts. <strong>The</strong>refore, every <strong>Freedonia</strong> study is based on a consistent<br />
set of economic assumptions (GDP, gasoline production, nondurable<br />
goods shipments, etc.)<br />
Reliable forecasts<br />
Because all of our forecasts consider the environment in<br />
which a product or industry is operating, as well as threats<br />
and opportunities to the market, <strong>Freedonia</strong> forecasts are<br />
reliable indicators of future performance.<br />
One-on-one interviews<br />
All studies are produced by conducting interviews with key industry<br />
participants and end-users.<br />
Proprietary electronic database<br />
<strong>Freedonia</strong>’s analysts can tap into an extensive in-house electronic<br />
database containing corporate literature (including private company<br />
information), trade publications, government reports and many<br />
other sources of information.<br />
<strong>Catalysts</strong> #1494<br />
Order form on last page<br />
13
About Our Customers<br />
<strong>Freedonia</strong>'s clients include major US and international companies in<br />
the manufacturing, services, consulting and financial sectors.<br />
Typical purchasers of <strong>Freedonia</strong> studies :<br />
• Key Executives<br />
• Corporate Planners<br />
• Market Researchers<br />
• Financial Analysts<br />
• Information Centers<br />
• New Product Developers<br />
• Merger & Acquisition Specialists<br />
Since 1985 we have provided research to customers ranging in size<br />
from global conglomerates to one person consulting firms. More than<br />
90% of the industrial companies in the Fortune 500 use <strong>Freedonia</strong><br />
research to help with their strategic planning.<br />
Some of <strong>Freedonia</strong>'s customers in the catalysts market include: Akzo<br />
Nobel, Dow Chemical Company, Engelhard Corporation,<br />
Honeywell International and Total Fina Elf.<br />
14<br />
<strong>Catalysts</strong> #1494<br />
<strong>Freedonia</strong> Industry Study
Other Titles<br />
From <strong>Freedonia</strong><br />
For more information about<br />
these or other <strong>Freedonia</strong> titles,<br />
please contact us at:<br />
<strong>The</strong> <strong>Freedonia</strong> <strong>Group</strong>, Inc.<br />
Phone: (440) 684-9600<br />
(800) 927-5900<br />
Fax: (440) 646-0484<br />
Waxes<br />
Wax demand in the US will expand 4% annually<br />
through 2005, supported by modest volume<br />
gains and an ongoing shift away from commodity<br />
waxes toward more expensive synthetic types.<br />
Fischer-Tropsch waxes offer particularly attractive<br />
growth opportunities in the paper, adhesives<br />
and coatings markets where they are used in specialty<br />
wax blends. This study analyzes the $1.3<br />
billion US wax industry to 2005 and 2010 by<br />
type and market. It also presents market share<br />
data and profiles major companies.<br />
#1504. . . . . . . . . 12/01. . . . . . . . . . $3,700<br />
Water Management Chemicals<br />
<strong>The</strong> US market for water management chemicals<br />
will grow 5% annually through 2005, driven by a<br />
shift in the product mix toward higher-value formulations.<br />
Increased water recycling in manufacturing<br />
and electric utilities will favor corrosion<br />
inhibitors, coagulants and flocculants, oxidizers<br />
and biocides, and chelating agents. This study<br />
analyzes the $3.4 billion US water management<br />
chemical industry to 2005 and 2010 by product,<br />
application and market. It also details market<br />
share and profiles key companies.<br />
#1499. . . . . . . . . 1/02. . . . . . . . . . $3,700<br />
World Industrial Gases<br />
World demand for industrial gases will grow 7%<br />
per year through 2005. Nitrogen and oxygen will<br />
remain the largest volume gases, though hydrogen,<br />
argon and specialty gases will post the most<br />
rapid gains. Metal manufacturing and fabrication<br />
will continue as the largest volume market while<br />
the electronics segment exhibits the strongest<br />
growth. This study analyzes the US$17.8 billion<br />
world industrial gas industry by market, type, region<br />
and for 14 countries. It also details market<br />
share and profiles key firms.<br />
#1489. . . . . . . . . 11/01. . . . . . . . . . $4,500<br />
Acrylic Acid & Derivatives<br />
US demand for acrylic acid and derivatives will<br />
advance 4.2% per year through 2005. Good<br />
prospects for acrylic acid polymers include adult<br />
incontinence superabsorbent polymers and water<br />
treatment detergent polymers. Opportunities for<br />
acrylate esters include radiation cured acrylic<br />
coatings and pressure sensitive acrylic adhesives.<br />
This study analyzes the $1.2 billion US acrylic<br />
acid and derivatives industry to 2005 and 2010<br />
by type and market. It also presents market<br />
share data and profiles leading producers.<br />
#1488. . . . . . . . . 11/01. . . . . . . . . . $3,500<br />
World Fluorochemicals<br />
World fluorochemicals demand will grow 3.4%<br />
annually through 2005, a marked improvement<br />
over the 1990s pace when the ban on CFCs had<br />
the most effect. Robust gains in HFCs will partially<br />
offset declines in CFCs, and stellar growth<br />
in fluoropolymers and specialty fluorochemicals<br />
will provide an added boost. This study analyzes<br />
the US$8 billion world fluorochemicals industry<br />
to 2005 and 2010 by product, market, region<br />
and for 13 countries. It also presents market<br />
share data and profiles key firms.<br />
#1434. . . . . . . . . 7/01. . . . . . . . . . $4,500<br />
Solvents: Green & Conventional<br />
Following a lengthy period of decline, demand<br />
for solvents in the US will exhibit positive annual<br />
growth through 2005. While demand for<br />
conventional solvents will be flat, green solvents<br />
will post robust advances, capturing 20% of the<br />
market by 2005. Cleaning products and transportation<br />
will be the fastest growing markets.<br />
This study analyzes the $3.3 billion US solvents<br />
industry to 2005 and 2010 by product, function<br />
and market. It also presents market share data<br />
and profiles leading companies.<br />
#1418. . . . . . . . . 5/01. . . . . . . . . . $3,700<br />
Activated Carbon<br />
Market value for US activated carbon demand<br />
will grow over 6% annually, with gains primarily<br />
attributable to tightening water and air pollution<br />
laws and new applications. Liquid phase uses<br />
(e.g., water treatment) will remain the largest<br />
outlet while gas phase applications (e.g., air purification,<br />
emission canisters) grow faster. This<br />
study analyzes the 364 million pound US activated<br />
carbon industry to 2004 and 2009 by type<br />
and application. <strong>The</strong> study also reviews trade,<br />
evaluates market share and profiles key firms.<br />
#1355. . . . . . . . . 11/00. . . . . . . . . . $3,500<br />
<strong>Catalysts</strong> #1494<br />
Order form on last page<br />
15
How to Order<br />
For more information about our products,<br />
please call the <strong>Freedonia</strong> Customer Service<br />
Department at (440) 684-9600 or<br />
(800) 927-5900 or fax (440) 646-0484.<br />
Corporate Use Licenses<br />
Now every decision maker in your organization<br />
can act on the key intelligence found in<br />
all <strong>Freedonia</strong> studies. For an additional<br />
$2,000, you receive unlimited use of an electronic<br />
version (PDF) of the study. Place it on<br />
your Intranet, e-mail it to coworkers around<br />
the world, or print it as many times as you<br />
like! Order it today.<br />
Ordering Information<br />
Fill out the coupon below and mail it to <strong>The</strong> <strong>Freedonia</strong> <strong>Group</strong>, or<br />
send your order by fax (440) 646-0484, or E-mail to<br />
info@freedoniagroup.com<br />
Handling and Shipping is FREE<br />
<strong>The</strong>re is NO charge for handling and shipping. In the US we ship via<br />
UPS. Outside the US, we provide free airmail service. If you would<br />
like express delivery, we provide this to you at cost.<br />
Save Fifteen Percent<br />
If you order three (3) different titles at the same time, you can receive a<br />
discount of 15 percent. If your order is accompanied by a check, you may<br />
take a 5 percent cash discount (discounts do not apply to corporate use<br />
licenses).<br />
Use Credit Card<br />
You may charge your order to either Visa, MasterCard or American<br />
Express. Please include your credit card account number, expiration<br />
date and your signature.<br />
Orders Outside of the US<br />
Checks must be paid in US funds and drawn against a US bank. Wire<br />
transfers should be sent to: Fifth Third Bank, Cincinnati, Ohio; <strong>The</strong><br />
<strong>Freedonia</strong> <strong>Group</strong>, Inc.; SWIFT #FTBCUS3C; ABA #042000314;<br />
Account #830-51814 (please include study number and/or invoice<br />
number with all wire transfers).<br />
Additional Copies<br />
Additional copies are available to original purchasers at $400 per title.<br />
Online Access<br />
<strong>The</strong> complete text and tables from our studies and reports can be found<br />
on our website www.freedoniagroup.com and through major commercial<br />
online vendors.<br />
<strong>Freedonia</strong> Custom Research<br />
Need analysis on a topic not covered by <strong>Freedonia</strong> Industry Studies Call Customer Service for details on <strong>Freedonia</strong> Custom Research.<br />
THE FREEDONIA GROUP, INC.<br />
767 Beta Drive<br />
Cleveland, OH 44143-2326 USA<br />
Phone: (440) 684-9600 • (800) 927-5900<br />
Fax: (440) 646-0484<br />
Name:<br />
Title:<br />
TITLE<br />
PRICE<br />
#1494 <strong>Catalysts</strong> $3,700<br />
Corporate Use License (add to study price) + $2,000<br />
Additional Print Copies @ $400 Each<br />
Company:<br />
Division:<br />
Street:<br />
(no PO Box please)<br />
City/State/Zip:<br />
Please check method of payment:<br />
Total: $<br />
Enclosed is my check (5% discount) drawn on a US bank and payable to <strong>The</strong> <strong>Freedonia</strong><br />
<strong>Group</strong>, Inc., in US funds. (Ohio residents add 7% sales tax).<br />
Bill my company MasterCard Visa American Express<br />
Country:<br />
Phone:<br />
Fax:<br />
MO.<br />
YR.<br />
Email:<br />
F-SM.1494<br />
SHIPPING and HANDLING charges are FREE via UPS<br />
(USA only) or airmail. Express delivery available at cost.<br />
Please inquire.<br />
Credit Card #<br />
Signature:<br />
Expiration Date