women panchayat memb.. - Volunteers for Rural India
women panchayat memb.. - Volunteers for Rural India
women panchayat memb.. - Volunteers for Rural India

Create successful ePaper yourself
Turn your PDF publications into a flip-book with our unique Google optimized e-Paper software.
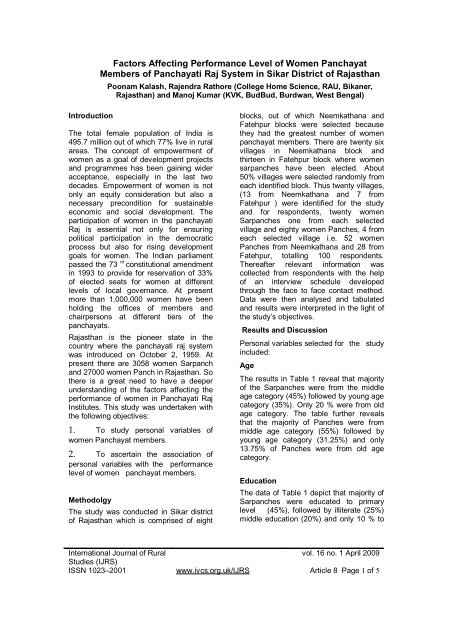
Factors Affecting Per<strong>for</strong>mance Level of Women Panchayat<br />
Members of Panchayati Raj System in Sikar District of Rajasthan<br />
Poonam Kalash, Rajendra Rathore (College Home Science, RAU, Bikaner,<br />
Rajasthan) and Manoj Kumar (KVK, BudBud, Burdwan, West Bengal)<br />
Introduction<br />
The total female population of <strong>India</strong> is<br />
495.7 million out of which 77% live in rural<br />
areas. The concept of empowerment of<br />
<strong>women</strong> as a goal of development projects<br />
and programmes has been gaining wider<br />
acceptance, especially in the last two<br />
decades. Empowerment of <strong>women</strong> is not<br />
only an equity consideration but also a<br />
necessary precondition <strong>for</strong> sustainable<br />
economic and social development. The<br />
participation of <strong>women</strong> in the <strong>panchayat</strong>i<br />
Raj is essential not only <strong>for</strong> ensuring<br />
political participation in the democratic<br />
process but also <strong>for</strong> rising development<br />
goals <strong>for</strong> <strong>women</strong>. The <strong>India</strong>n parliament<br />
passed the 73 rd constitutional amendment<br />
in 1993 to provide <strong>for</strong> reservation of 33%<br />
of elected seats <strong>for</strong> <strong>women</strong> at different<br />
levels of local governance. At present<br />
more than 1,000,000 <strong>women</strong> have been<br />
holding the offices of <strong>memb</strong>ers and<br />
chairpersons at different tiers of the<br />
<strong>panchayat</strong>s.<br />
Rajasthan is the pioneer state in the<br />
country where the <strong>panchayat</strong>i raj system<br />
was introduced on October 2, 1959. At<br />
present there are 3058 <strong>women</strong> Sarpanch<br />
and 27000 <strong>women</strong> Panch in Rajasthan. So<br />
there is a great need to have a deeper<br />
understanding of the factors affecting the<br />
per<strong>for</strong>mance of <strong>women</strong> in Panchayati Raj<br />
Institutes. This study was undertaken with<br />
the following objectives:<br />
1. To study personal variables of<br />
<strong>women</strong> Panchayat <strong>memb</strong>ers.<br />
2. To ascertain the association of<br />
personal variables with the per<strong>for</strong>mance<br />
level of <strong>women</strong> <strong>panchayat</strong> <strong>memb</strong>ers.<br />
Methodolgy<br />
The study was conducted in Sikar district<br />
of Rajasthan which is comprised of eight<br />
blocks, out of which Neemkathana and<br />
Fatehpur blocks were selected because<br />
they had the greatest number of <strong>women</strong><br />
<strong>panchayat</strong> <strong>memb</strong>ers. There are twenty six<br />
villages in Neemkathana block and<br />
thirteen in Fatehpur block where <strong>women</strong><br />
sarpanches have been elected. About<br />
50% villages were selected randomly from<br />
each identified block. Thus twenty villages,<br />
(13 from Neemkathana and 7 from<br />
Fatehpur ) were identified <strong>for</strong> the study<br />
and <strong>for</strong> respondents, twenty <strong>women</strong><br />
Sarpanches one from each selected<br />
village and eighty <strong>women</strong> Panches, 4 from<br />
each selected village i.e. 52 <strong>women</strong><br />
Panches from Neemkathana and 28 from<br />
Fatehpur, totalling 100 respondents.<br />
Thereafter relevant in<strong>for</strong>mation was<br />
collected from respondents with the help<br />
of an interview schedule developed<br />
through the face to face contact method.<br />
Data were then analysed and tabulated<br />
and results were interpreted in the light of<br />
the study’s objectives.<br />
Results and Discussion<br />
Personal variables selected <strong>for</strong> the study<br />
included:<br />
Age<br />
The results in Table 1 reveal that majority<br />
of the Sarpanches were from the middle<br />
age category (45%) followed by young age<br />
category (35%). Only 20 % were from old<br />
age category. The table further reveals<br />
that the majority of Panches were from<br />
middle age category (55%) followed by<br />
young age category (31.25%) and only<br />
13.75% of Panches were from old age<br />
category.<br />
Education<br />
The data of Table 1 depict that majority of<br />
Sarpanches were educated to primary<br />
level (45%), followed by illiterate (25%)<br />
middle education (20%) and only 10 % to<br />
International Journal of <strong>Rural</strong><br />
vol. 16 no. 1 April 2009<br />
Studies (IJRS)<br />
ISSN 1023–2001 www.ivcs.org.uk/IJRS Article 8 Page 1 of 5
high school level. The table further reveals<br />
that more than 50 % of Panches were<br />
educated to primary level (52.5%) followed<br />
by illiterate (23.75%) and middle education<br />
(13.75%). Only 10% had been educated to<br />
school level and none had had a college<br />
or post-graduate education. Similar<br />
findings were also reported by Malagi and<br />
Pujar (1996).<br />
Caste<br />
Table 1 shows that less than 50% of the<br />
sarpanches were from schedule<br />
caste/tribe (45%) followed by other<br />
backward castes (30%) and 25% general<br />
caste. Most panches were from other<br />
backward castes (42.5%) followed by<br />
schedule caste/tribe (31.25%) and less<br />
than 30 per cent from general castes<br />
(26.25%).<br />
Table 1. In<strong>for</strong>mation regarding profile of the respondent<br />
Categories<br />
Age<br />
Education<br />
Caste<br />
Family type<br />
Annual Income Group<br />
Mass media exposure<br />
Urban contact<br />
Social participation<br />
Variables<br />
Sarpanch<br />
(n=20)<br />
N = 100<br />
Panch (n=80)<br />
f % f %<br />
Young 7 35 25 31.25<br />
Middle 9 45 44 55<br />
Old 4 20 11 13.75<br />
Illiterate 5 25 19 23.75<br />
Primary 9 45 42 52.5<br />
Middle 4 20 11 13.75<br />
High school 2 10 8 10<br />
Graduate and - - - -<br />
above<br />
General 5 25 21 26.25<br />
SC/ST 9 45 25.25 31.25<br />
OBC 6 30 34 42.5<br />
Nuclear 9 45 37 46.25<br />
Joint 11 55 43 53.75<br />
Low 6 30 39 48.75<br />
Middle 7 35 17 21.25<br />
High 3 15 10 12.5<br />
Low 13 65 54 67.5<br />
Medium 4 20 21 26.5<br />
High 3 15 5 6.25<br />
Low 18 90 46 57.5<br />
Medium 2 10 29 36.25<br />
High - - 5 6.25<br />
Nil 3 15 13 13.25<br />
One 14 70 56 70<br />
More than one 2 10 7 8.75<br />
Office bearer 1 5 4 5<br />
Family type<br />
International Journal of <strong>Rural</strong><br />
vol. 16 no. 1 April 2009<br />
Studies (IJRS)<br />
ISSN 1023–2001 www.ivcs.org.uk/IJRS Article 8 Page 2 of 5
Table 1 reveals that more than 55%<br />
sarpanches belonged to a joint family<br />
system and 45% to a nuclear family<br />
system. Most of the panches belonged<br />
to a joint family (43%) or a nuclear family<br />
(37%).These findings are in con<strong>for</strong>mity<br />
with the findings of the Kachhwa<br />
(2003).<br />
Annual income<br />
The majority of Sarpanches belonged to<br />
the medium income group (35%) followed<br />
by low income group (30%).Only 15%<br />
belonged to the high Income group. The<br />
majority of panches belonged to the lowincome<br />
group (48.75%) followed by<br />
medium income group (21.25%) and high<br />
category of income (12.3%).<br />
Mass Media Exposure<br />
Table 1 shows that most sarpanches had<br />
a low level of mass media exposure (65%)<br />
followed by medium level of mass media<br />
exposure (20%). Only 15% had a high<br />
level of mass media exposure. Most<br />
panches had a low level of mass media<br />
exposure (67.5%), followed by medium<br />
level of mass media exposure (26.28%).<br />
Less than 10% panches had a high level<br />
of mass media exposure (6.25%).This<br />
finding is in con<strong>for</strong>mity with the findings of<br />
Sentthamarai et al. (1997).<br />
Urban contact<br />
Table 1 indicates that most sarpanches<br />
had a low level of urban contact (90%)<br />
followed by medium level (10%).None<br />
were found in the high level of urban<br />
contact. Most panches had a low level of<br />
urban contact (57.5%) followed by<br />
medium level (36.25%) and only 6.25%<br />
with a high level of urban contact.<br />
Social participation<br />
The majority of sarpanches were <strong>memb</strong>ers<br />
of one organization (70%) followed<br />
by no participation category (15%) and<br />
more than one organization category<br />
(10%). Only 5% were found in the<br />
category office bearer. Most panches<br />
were <strong>memb</strong>ers of one organization (70%)<br />
followed by no participation category<br />
(13.25%) and more than one organization<br />
category (8.75%). Only 5% panches were<br />
office bearers. The finding is in<br />
accordance with the findings of<br />
Senthamarai et al. (1997).<br />
Association of the personal variables<br />
with the per<strong>for</strong>mance level of<br />
<strong>women</strong> <strong>panchayat</strong> <strong>memb</strong>ers<br />
In order to measure the association of<br />
per<strong>for</strong>mance level of <strong>women</strong> <strong>panchayat</strong><br />
<strong>memb</strong>ers and related<br />
independent variables, the chi-square test<br />
was computed and results have been<br />
presented in Table 2.<br />
Table 2. Association of the selected independent variables with the per<strong>for</strong>mance level<br />
of <strong>women</strong> <strong>panchayat</strong> <strong>memb</strong>ers<br />
N=100<br />
S. No.<br />
Independent variables Chi-square (x 2 )<br />
1. Age 4.37*<br />
2. Education 7.39**<br />
3. Caste 1.25 NS<br />
4. Family Type 9.5**<br />
5. Income 0.13 NS<br />
6. Mass Media Exposure 9.13**<br />
7. Social participation 9.52**<br />
8. Urban contact 7.45*<br />
International Journal of <strong>Rural</strong><br />
vol. 16 no. 1 April 2009<br />
Studies (IJRS)<br />
ISSN 1023–2001 www.ivcs.org.uk/IJRS Article 8 Page 3 of 5
NS = Non significant<br />
* = Significant at 5% level<br />
** = Highly significant at 1% level<br />
Age<br />
The data shows that the calculated chi<br />
square value (4.37) is higher than the<br />
tabulated value leading to a null<br />
hypothesis. “There is no association<br />
between per<strong>for</strong>mance level of <strong>women</strong><br />
<strong>panchayat</strong> <strong>memb</strong>ers and age of<br />
respondents.” , is rejected . It means<br />
there is significant association between<br />
per<strong>for</strong>mance level of <strong>women</strong> <strong>panchayat</strong><br />
<strong>memb</strong>ers and age.<br />
Education<br />
The calculated chi square value (7.39) is<br />
higher than the tabulated value at 1% level<br />
of significance thus again, a null<br />
hypothesis "There is no association<br />
between per<strong>for</strong>mance level of <strong>women</strong><br />
<strong>panchayat</strong> <strong>memb</strong>ers and education” is<br />
rejected. It means there is a highly<br />
significant association between<br />
per<strong>for</strong>mance levels of <strong>women</strong> <strong>panchayat</strong><br />
<strong>memb</strong>ers and education..<br />
Caste<br />
The data shows that the calculated chi<br />
square value (1.25) is lower than the<br />
tabulated value thus another null<br />
hypothesis. “There is no association<br />
between per<strong>for</strong>mance levels of <strong>women</strong><br />
<strong>panchayat</strong> <strong>memb</strong>ers and caste” is<br />
accepted. It means there is no significant<br />
association between per<strong>for</strong>mance levels of<br />
<strong>women</strong> <strong>panchayat</strong> <strong>memb</strong>ers and caste.<br />
Family type<br />
The calculated chi square value (9.5) is<br />
higher than the tabulated value thus a null<br />
hypothesis. "There is no association<br />
between per<strong>for</strong>mance levels of <strong>women</strong><br />
<strong>panchayat</strong> <strong>memb</strong>ers and family type” is<br />
rejected. It means there is a highly<br />
significant association between<br />
per<strong>for</strong>mance levela of <strong>women</strong> <strong>panchayat</strong><br />
<strong>memb</strong>ers and family type.<br />
Income<br />
The calculated chi square value (0.13) is<br />
lower than the tabulated value giving a<br />
null hypothesis. “There is no significant<br />
association between per<strong>for</strong>mance levels of<br />
<strong>women</strong> <strong>panchayat</strong> <strong>memb</strong>ers and income”<br />
is accepted. It means there is no<br />
association between per<strong>for</strong>mance levels of<br />
<strong>women</strong> <strong>panchayat</strong> <strong>memb</strong>ers and annual<br />
income. This may be because elected<br />
<strong>women</strong> <strong>panchayat</strong> <strong>memb</strong>ers derive equal<br />
authority by virtue of their posts.<br />
Mass media exposure<br />
The calculated chi square value (9.13) is<br />
higher than the tabulated value at 1% level<br />
of significance thus another null<br />
hypothesis. "There is no association<br />
between per<strong>for</strong>mance levels of <strong>women</strong><br />
<strong>panchayat</strong> <strong>memb</strong>ers and mass media<br />
exposure” is rejected. It means there is a<br />
highly significant association between<br />
per<strong>for</strong>mance levels of <strong>women</strong> <strong>panchayat</strong><br />
<strong>memb</strong>ers and mass media exposure.<br />
Social participation<br />
The calculated chi square value (9.52 ) is<br />
higher than the tabulated value at 1% level<br />
of significance thus a null hypothesis.<br />
'There is no association between<br />
per<strong>for</strong>mance levels of <strong>women</strong> <strong>panchayat</strong><br />
<strong>memb</strong>ers and social participation” is<br />
rejected. It means there is a highly<br />
significant association between<br />
per<strong>for</strong>mance levela of <strong>women</strong> <strong>panchayat</strong><br />
<strong>memb</strong>ers and social participation.<br />
Urban contact<br />
The calculated chi square value (7.45) is<br />
higher than the tabulated value giving a<br />
null hypothesis. "There is no association<br />
between per<strong>for</strong>mance levels of <strong>women</strong><br />
<strong>panchayat</strong> <strong>memb</strong>ers and urban contact” is<br />
rejected. It means there is a significant<br />
association between per<strong>for</strong>mance levels of<br />
<strong>women</strong> <strong>panchayat</strong> <strong>memb</strong>ers and urban<br />
contact.<br />
Conclusion<br />
Age, education, family type, mass media<br />
exposure, social participation and urban<br />
International Journal of <strong>Rural</strong><br />
vol. 16 no. 1 April 2009<br />
Studies (IJRS)<br />
ISSN 1023–2001 www.ivcs.org.uk/IJRS Article 8 Page 4 of 5
contact all have significant associations<br />
with the per<strong>for</strong>mance of <strong>women</strong> <strong>panchayat</strong><br />
<strong>memb</strong>ers. However, caste and income<br />
have no significant association with<br />
per<strong>for</strong>mance levels of <strong>women</strong> <strong>panchayat</strong><br />
<strong>memb</strong>ers.<br />
References<br />
Malagi, U. and Pujar, A. (1996). "Home<br />
Science Training at Krishi Vigyan<br />
Kendra, Hanumanamatti", Agril. Ext.<br />
Review, 8 (1) : 23-24.<br />
Kachhawa, D. (2003). "Empowerment of Tribal<br />
Farm Women through Self Help Group<br />
under NGO's in Udaipur District of<br />
Rajasthan". M.Sc. Thesis, Department of<br />
Extension Education, MUPAT, Udaipur.<br />
Senthamarai, G. Mandharan, M. and Paul Man<br />
Singh, J.J. (1997). "Socio-personal and<br />
psychological characteristics of farm<br />
<strong>women</strong>, Journal of Extension Education<br />
8(5) : 1607-1608<br />
International Journal of <strong>Rural</strong><br />
vol. 16 no. 1 April 2009<br />
Studies (IJRS)<br />
ISSN 1023–2001 www.ivcs.org.uk/IJRS Article 8 Page 5 of 5