2. Gender participation and role of women in livestock management ...
2. Gender participation and role of women in livestock management ...
2. Gender participation and role of women in livestock management ...

Create successful ePaper yourself
Turn your PDF publications into a flip-book with our unique Google optimized e-Paper software.
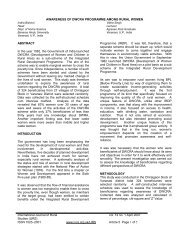
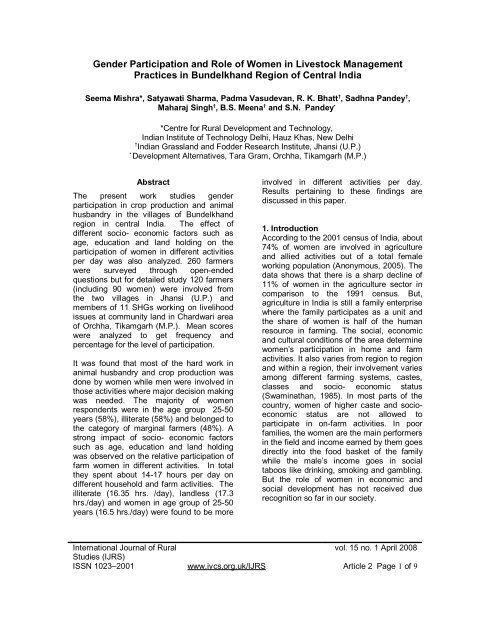
<strong>2.</strong>2 Data Collection260 farmers, 80-80 from selected villages<strong>and</strong> 100 from SHGs, were surveyed <strong>and</strong> dueto <strong>in</strong>complete <strong>in</strong>formation <strong>and</strong> <strong>in</strong>consistency<strong>in</strong> data 120 farmers (<strong>in</strong>volv<strong>in</strong>g 90 <strong>women</strong>)were selected for detailed study. Data wascollected through participatory ruralappraisal (PRA), focused group discussion<strong>and</strong> survey by empirical <strong>in</strong>vestigation.Survey was ma<strong>in</strong>ly done on a pre tested <strong>and</strong>modified format by open ended <strong>in</strong>terviewsabout the gender <strong>participation</strong> <strong>of</strong> both males<strong>and</strong> females <strong>in</strong> different on-farm activitiesrelated to crop production <strong>and</strong> <strong>livestock</strong><strong>management</strong>. The impact <strong>of</strong> factors such asage, education <strong>and</strong> l<strong>and</strong> hold<strong>in</strong>g on relativetime spent <strong>in</strong> different daily chores <strong>and</strong> onfarm activities particularly by <strong>women</strong> wasalso documented. The age <strong>of</strong> respondentswas studied at three levels - 50 yrs while the education levelwas distributed as illiterate, primary level<strong>and</strong> middle level or above. On the basis <strong>of</strong>their l<strong>and</strong> hold<strong>in</strong>gs, farmers were classifiedas big (> 6 ha), small (1-2 ha), marg<strong>in</strong>alfarmers (
In this study the association between socioeconomicfactors <strong>and</strong> <strong>participation</strong> <strong>of</strong> 90<strong>women</strong> from a total sample <strong>of</strong> 120 wasevaluated <strong>in</strong> different farm activities (Table3). The percent composition <strong>of</strong> farm<strong>women</strong><strong>in</strong> different categories <strong>of</strong> age, education <strong>and</strong>l<strong>and</strong> hold<strong>in</strong>g is presented <strong>in</strong> Table 3. Of the<strong>women</strong> surveyed, 23%, 58% <strong>and</strong> 20% were<strong>of</strong> < 25 years, between 25 - 50 years <strong>and</strong> >50 years <strong>of</strong> age, respectively. The majoritywere illiterate (58%), 31% had studied up toprimary level <strong>and</strong> 11% were educated up tomiddle level. On the basis <strong>of</strong> l<strong>and</strong> hold<strong>in</strong>g,the percentage <strong>of</strong> farm<strong>women</strong> <strong>in</strong> big farmer,small farmer, marg<strong>in</strong>al farmer <strong>and</strong> l<strong>and</strong>lesswere 13%, 22%, 48% <strong>and</strong> 17%,respectively.3.3.1 Age <strong>and</strong> <strong>participation</strong> <strong>in</strong> differentactivitiesThe overall time spent by farm <strong>women</strong> ondomestic <strong>and</strong> farm activities varied from 14-16 hours/day (Table 4). Women <strong>of</strong> themiddle age group (25-50 years) spent most<strong>of</strong> their time perform<strong>in</strong>g activities related tohousehold <strong>and</strong> farm as compared to thosefrom other age groups. Farm<strong>women</strong> below25 years <strong>of</strong> age were generally newlymarried, <strong>in</strong> their reproductive stage <strong>and</strong>because <strong>of</strong> certa<strong>in</strong> social customs, did notparticipate actively <strong>in</strong> farm activities.Similarly, <strong>women</strong> above 50 years <strong>of</strong> age,because <strong>of</strong> health problems <strong>and</strong> other dutiesparticipated less <strong>in</strong> farm activities. Thesef<strong>in</strong>d<strong>in</strong>gs clearly show that the middle agegroup <strong>of</strong> farm<strong>women</strong> devoted more time t<strong>of</strong>arm <strong>and</strong> household activities.3.3.2 Education <strong>and</strong> <strong>participation</strong> <strong>in</strong> differentactivitiesData presented <strong>in</strong> Table 4 <strong>in</strong>dicates thatthere was a strong impact <strong>of</strong> education levelon the performance <strong>of</strong> farm <strong>women</strong> <strong>in</strong>different farm activities. The total time spent<strong>in</strong> household <strong>and</strong> farm activities by illiterate,education up to primary <strong>and</strong> education up tomiddle <strong>and</strong> above <strong>women</strong> was 16.35 hrs./day, 16.05 hrs. /day <strong>and</strong> 15.45 hrs. /day,respectively. Illiterate <strong>women</strong> spentcomparatively more time <strong>in</strong> differentactivities. Women educated up to middle<strong>and</strong> above spent more time <strong>in</strong> householdactivities <strong>and</strong> collection <strong>of</strong> fuel <strong>and</strong> fodderrather than <strong>in</strong> crop production <strong>and</strong> <strong>livestock</strong>care. This shows the ability <strong>of</strong> educated<strong>women</strong> <strong>in</strong> proper <strong>management</strong> <strong>of</strong> differentactivities that also took less time.3.3.3 L<strong>and</strong> hold<strong>in</strong>g <strong>and</strong> <strong>participation</strong> <strong>in</strong>different activitiesOn the basis <strong>of</strong> l<strong>and</strong> hold<strong>in</strong>g, a strongcorrelation was observed <strong>in</strong> their<strong>participation</strong> <strong>in</strong> different household <strong>and</strong> farmactivities (Table 4). L<strong>and</strong>less laborers spentmaximum (17.3 hours/ day) time do<strong>in</strong>gdifferent activities. Their major time wasspent <strong>in</strong> the performance <strong>of</strong> farm <strong>and</strong> animalhusb<strong>and</strong>ry activities rather than household;this was ma<strong>in</strong>ly to generate extra resourcesby participat<strong>in</strong>g <strong>in</strong> <strong>in</strong>come generat<strong>in</strong>gactivities. The big farm<strong>women</strong> were found tospend more time (6.50 hours/day) <strong>in</strong>household activities because for farm <strong>and</strong>animal husb<strong>and</strong>ry work, they totally dependupon l<strong>and</strong>less laborers <strong>and</strong> marg<strong>in</strong>alfarmers. The major time spent by big farm<strong>women</strong> <strong>in</strong> agriculture activities was <strong>in</strong>w<strong>in</strong>now<strong>in</strong>g, clear<strong>in</strong>g <strong>and</strong> storage <strong>of</strong> gra<strong>in</strong>s<strong>and</strong> seeds. The small <strong>and</strong> marg<strong>in</strong>al farm<strong>women</strong> comparatively spent more time <strong>in</strong>animal husb<strong>and</strong>ry, collection <strong>of</strong> fuel <strong>and</strong>fodder than big farm <strong>women</strong>, ma<strong>in</strong>ly to savemoney be<strong>in</strong>g spent hir<strong>in</strong>g labour.ConclusionIt can be concluded from the study that<strong>women</strong> were the ma<strong>in</strong> performers <strong>in</strong> cropproduction as well as animal husb<strong>and</strong>ryactivities <strong>in</strong> the area <strong>of</strong> study. However, fordecision mak<strong>in</strong>g on farm activities, it wasma<strong>in</strong>ly men who were <strong>in</strong>volved. For effective<strong>and</strong> beneficial <strong>participation</strong> <strong>of</strong> <strong>women</strong> <strong>in</strong> anyactivity, it is imperative to enhance the level<strong>of</strong> education for better <strong>management</strong> <strong>and</strong>dispersal <strong>of</strong> knowledge <strong>in</strong> society.AcknowledgementInternational Journal <strong>of</strong> Ruralvol. 15 no. 1 April 2008Studies (IJRS)ISSN 1023–2001 www.ivcs.org.uk/IJRS Article 2 Page 4 <strong>of</strong> 9
The first author is grateful to the Department<strong>of</strong> Science <strong>and</strong> Technology, Govt. <strong>of</strong> Indiafor giv<strong>in</strong>g f<strong>in</strong>ancial support under ‘WomenScientist Fellowship Scheme-B’.Referencesv Anonymous. 2005. The H<strong>in</strong>duBus<strong>in</strong>ess L<strong>in</strong>e, 30 Dec.v Swam<strong>in</strong>athan, M.S. 1985. Impart<strong>in</strong>grural <strong>women</strong> perspective toagriculture research <strong>and</strong>development. Report <strong>of</strong> the ProjectDesign Workshop on Women <strong>in</strong>Farm<strong>in</strong>g Systems, held At theInternational Rice Research Centre,Los Banos, Phillipp<strong>in</strong>es, April 10.International Journal <strong>of</strong> Ruralvol. 15 no. 1 April 2008Studies (IJRS)ISSN 1023–2001 www.ivcs.org.uk/IJRS Article 2 Page 5 <strong>of</strong> 9
Table 1: <strong>Gender</strong> wise <strong>participation</strong> <strong>in</strong> farm activities <strong>of</strong> sample farmers at selected sites <strong>in</strong>Bundelkh<strong>and</strong> region (n=120)Farm ActivitiesRelative <strong>participation</strong> (no. <strong>of</strong> samplefarmers)Female Male Both1. Plough<strong>in</strong>g <strong>of</strong> fields<strong>2.</strong> Sow<strong>in</strong>g <strong>of</strong> seeds3. Weed<strong>in</strong>g4. Harvest<strong>in</strong>g5. Thresh<strong>in</strong>g6. W<strong>in</strong>now<strong>in</strong>g7. Storage <strong>of</strong> gra<strong>in</strong>s <strong>and</strong> fodder8. Collection <strong>of</strong> fodder from fields, communityl<strong>and</strong>9. Procurement <strong>of</strong> feed <strong>and</strong> fodder from market10. Clean<strong>in</strong>g <strong>of</strong> animals <strong>and</strong> shed11. Feed<strong>in</strong>g <strong>of</strong> animals1<strong>2.</strong> Water<strong>in</strong>g13.Graz<strong>in</strong>g14. Milk<strong>in</strong>g15. Milk disposal16. Sale <strong>of</strong> animals17. Purchase <strong>of</strong> animals18. Traditional health care to animals19. Vacc<strong>in</strong>ation <strong>and</strong> visits to animal hospital20. Breed<strong>in</strong>g <strong>of</strong> animals0 (0)86 (72)102 (85)60 (50)20 (17)98 (82)48 (40)105 (88)20 (17)80 (67)95 (79)45 (38)10 (8)55 (46)5 (4)0 (0)0 (0)80 (67)0 (0)0 (0)103 (86)28 (23)0 (0)20 (17)50 (42)5 (4)10 (8)0 (0)8525 (21)10 (8)62(52)95 (79)40 (33)102 (85)115 (96)120 (100)25 (21)120 (100)120 (100)17 (14)16 (13)18 (15)40 (33)50 (42)17 (14)52 (43)15 (13)15 (13)15 (13)15 (13)13 (11)15 (13)25 (21)13 (11)5 (4)0 (0)15 (13)0 (0)0 (0)Figures <strong>in</strong> parenthesis are percentageInternational Journal <strong>of</strong> Ruralvol. 15 no. 1 April 2008Studies (IJRS)ISSN 1023–2001 www.ivcs.org.uk/IJRS Article 1 Page 6 <strong>of</strong> 9
Table -2: Relative <strong>participation</strong> <strong>in</strong> decision mak<strong>in</strong>g on farm activities <strong>of</strong> sample farmers at selectedsites <strong>in</strong> Bundelkh<strong>and</strong> region (n=120)Farm activitiesRelative decision mak<strong>in</strong>g (no.<strong>of</strong> sample farmers)Women Men Both1. Selection <strong>of</strong> crops <strong>of</strong> the season<strong>2.</strong> Selection <strong>and</strong> procurement <strong>of</strong> seeds <strong>of</strong> new varieties3. Selection <strong>of</strong> breed <strong>of</strong> animals4. Storage <strong>of</strong> green fodder for lean period5. Sell<strong>in</strong>g <strong>of</strong> surplus dry fodder6. Procurement <strong>of</strong> dry fodder from market7. Sell<strong>in</strong>g <strong>of</strong> green fodder <strong>in</strong> market8. Procurement <strong>of</strong> fertilizers9. Sell<strong>in</strong>g <strong>of</strong> <strong>livestock</strong>10. Sell<strong>in</strong>g <strong>of</strong> milkFigures <strong>in</strong> parenthesis are percentage30 (25)35 (29)40 (33)105 (88)35 (29)5 (4)54 (45)25 (21)15 (13)56 (47)80 (67)85 (71)80 (67)10 (8)75 (63)112(93)56 (47)95 (79)98 (82)52 (43)10 (8)0 (0)0 (0)5 (4)10 (8)7 (6)10 (8)0 (0)7 (6)12 (10)International Journal <strong>of</strong> Ruralvol. 15 no. 1 April 2008Studies (IJRS)ISSN 1023–2001 www.ivcs.org.uk/IJRS Article 1 Page 7 <strong>of</strong> 9
Table 3: Distribution <strong>of</strong> farm<strong>women</strong> accord<strong>in</strong>g to their socio-economic characteristic at selected sitesCharacterGroup (Age <strong>and</strong>Education)No. <strong>of</strong>respondents*Percent (%)Age< 25 years212325- 50 years5258>50 years1720Total90100EducationIlliterate5258Primary2831Middle <strong>and</strong> above1011Total90100L<strong>and</strong> hold<strong>in</strong>g Big farmers12Small farmers20Marg<strong>in</strong>al farmers43L<strong>and</strong>less15Total90* 90 respondents were <strong>women</strong> <strong>in</strong> sample farmers <strong>of</strong> 120 analyzed13224817100International Journal <strong>of</strong> Ruralvol. 15 no. 1 April 2008Studies (IJRS)ISSN 1023–2001 www.ivcs.org.uk/IJRS Article 1 Page 8 <strong>of</strong> 9
Table 4: Association between different factors <strong>and</strong> <strong>participation</strong> (Average time spent/day <strong>in</strong> hrs.) <strong>in</strong> different activities byFarm<strong>women</strong> at selected sitesActivities Age group Education level L<strong>and</strong> hold<strong>in</strong>g50 years Illiterate Primary Middle<strong>and</strong> aboveBigfarmersSmallfarmersMarg<strong>in</strong>alfarmersL<strong>and</strong>lessfarmersHousehold activities5.30(37.2)4.8(29)3.00(2<strong>2.</strong>0)5.30(3<strong>2.</strong>4)5.00(31.15)5.50(36.0)6.50(46.4)5.40(34)5.0(30.3)4.0(23)Agriculture<strong>2.</strong>50(17.5)3.30(20)3.00(2<strong>2.</strong>0)<strong>2.</strong>40(15.0)<strong>2.</strong>50(15.58)<strong>2.</strong>15(14.1)<strong>2.</strong>8(20.2)<strong>2.</strong>5(16)<strong>2.</strong>5(15.2)3.0(17.3)Animal husb<strong>and</strong>ryCollection <strong>of</strong> fodderCollection <strong>of</strong> fuel<strong>2.</strong>25(15.8)<strong>2.</strong>20(15.43)<strong>2.</strong>00(14.0)3.30(20)<strong>2.</strong>80(18)<strong>2.</strong>30(13)<strong>2.</strong>08(15.1)<strong>2.</strong>80(20.32)<strong>2.</strong>90(21.04)13.7814.25 16.5Total(100)(100) (100)(Figures <strong>in</strong> parenthesis show the % spent time)3.75(23.0)<strong>2.</strong>0(1<strong>2.</strong>23)<strong>2.</strong>90(17.73)16.35(100)3.50(21.8)<strong>2.</strong>30(14.33)<strong>2.</strong>75(17.13)16.05(100)3.0(19.70)<strong>2.</strong>50(16.4)<strong>2.</strong>30(14.84)15.45(100)<strong>2.</strong>5(18.5)1.2(8.6)1.0(7.3)14.0(100)3.5(22)<strong>2.</strong>5(16)<strong>2.</strong>0(12)15.9(100)3.5(21.2)3.0(18.3)<strong>2.</strong>5(15)16.5(100)4.0(23)3.5(20.3)<strong>2.</strong>8(16.5)17.3(100)International Journal <strong>of</strong> Rural Studies (IJRS) vol. 15 no. 1 April 2008ISSN 1023–2001 www.ivcs.org.uk/IJRS Article 1 Page 9 <strong>of</strong> 9