An efficient algorithm for maximal margin clustering - ResearchGate
An efficient algorithm for maximal margin clustering - ResearchGate
An efficient algorithm for maximal margin clustering - ResearchGate

You also want an ePaper? Increase the reach of your titles
YUMPU automatically turns print PDFs into web optimized ePapers that Google loves.
J Glob Optim<br />
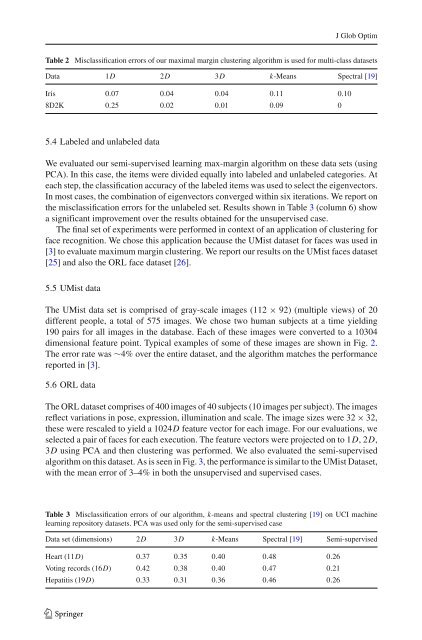
Table 2 Misclassification errors of our <strong>maximal</strong> <strong>margin</strong> <strong>clustering</strong> <strong>algorithm</strong> is used <strong>for</strong> multi-class datasets<br />
Data 1D 2D 3D k-Means Spectral [19]<br />
Iris 0.07 0.04 0.04 0.11 0.10<br />
8D2K 0.25 0.02 0.01 0.09 0<br />
5.4 Labeled and unlabeled data<br />
We evaluated our semi-supervised learning max-<strong>margin</strong> <strong>algorithm</strong> on these data sets (using<br />
PCA). In this case, the items were divided equally into labeled and unlabeled categories. At<br />
each step, the classification accuracy of the labeled items was used to select the eigenvectors.<br />
In most cases, the combination of eigenvectors converged within six iterations. We report on<br />
the misclassification errors <strong>for</strong> the unlabeled set. Results shown in Table 3 (column 6) show<br />
a significant improvement over the results obtained <strong>for</strong> the unsupervised case.<br />
The final set of experiments were per<strong>for</strong>med in context of an application of <strong>clustering</strong> <strong>for</strong><br />
face recognition. We chose this application because the UMist dataset <strong>for</strong> faces was used in<br />
[3] to evaluate maximum <strong>margin</strong> <strong>clustering</strong>. We report our results on the UMist faces dataset<br />
[25] and also the ORL face dataset [26].<br />
5.5 UMist data<br />
The UMist data set is comprised of gray-scale images (112 × 92) (multiple views) of 20<br />
different people, a total of 575 images. We chose two human subjects at a time yielding<br />
190 pairs <strong>for</strong> all images in the database. Each of these images were converted to a 10304<br />
dimensional feature point. Typical examples of some of these images are shown in Fig. 2.<br />
The error rate was ∼4% over the entire dataset, and the <strong>algorithm</strong> matches the per<strong>for</strong>mance<br />
reportedin[3].<br />
5.6 ORL data<br />
The ORL dataset comprises of 400 images of 40 subjects (10 images per subject). The images<br />
reflect variations in pose, expression, illumination and scale. The image sizes were 32 × 32,<br />
these were rescaled to yield a 1024D feature vector <strong>for</strong> each image. For our evaluations, we<br />
selected a pair of faces <strong>for</strong> each execution. The feature vectors were projected on to 1D,2D,<br />
3D using PCA and then <strong>clustering</strong> was per<strong>for</strong>med. We also evaluated the semi-supervised<br />
<strong>algorithm</strong> on this dataset. As is seen in Fig. 3, the per<strong>for</strong>mance is similar to the UMist Dataset,<br />
with the mean error of 3–4% in both the unsupervised and supervised cases.<br />
Table 3 Misclassification errors of our <strong>algorithm</strong>, k-means and spectral <strong>clustering</strong> [19] on UCI machine<br />
learning repository datasets. PCA was used only <strong>for</strong> the semi-supervised case<br />
Data set (dimensions) 2D 3D k-Means Spectral [19] Semi-supervised<br />
Heart (11D) 0.37 0.35 0.40 0.48 0.26<br />
Voting records (16D) 0.42 0.38 0.40 0.47 0.21<br />
Hepatitis (19D) 0.33 0.31 0.36 0.46 0.26<br />
123