Visual Data Mining of Web Navigational Data - Make Final Year ...
Visual Data Mining of Web Navigational Data - Make Final Year ...
Visual Data Mining of Web Navigational Data - Make Final Year ...

You also want an ePaper? Increase the reach of your titles
YUMPU automatically turns print PDFs into web optimized ePapers that Google loves.
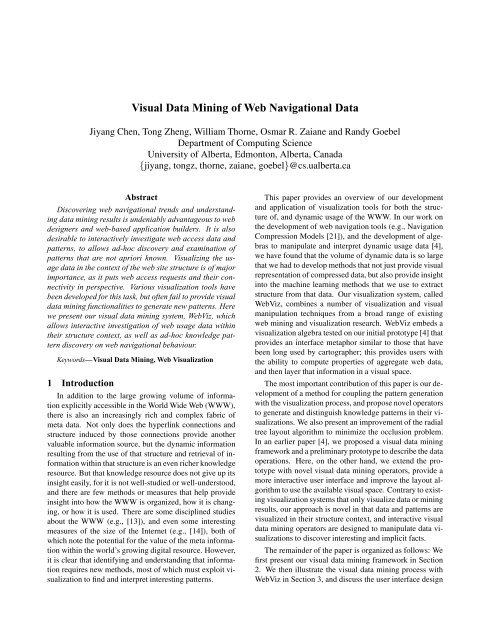
<strong>Visual</strong> <strong>Data</strong> <strong>Mining</strong> <strong>of</strong> <strong>Web</strong> <strong>Navigational</strong> <strong>Data</strong><br />
Jiyang Chen, Tong Zheng, William Thorne, Osmar R. Zaiane and Randy Goebel<br />
Department <strong>of</strong> Computing Science<br />
University <strong>of</strong> Alberta, Edmonton, Alberta, Canada<br />
{jiyang, tongz, thorne, zaiane, goebel}@cs.ualberta.ca<br />
Abstract<br />
Discovering web navigational trends and understanding<br />
data mining results is undeniably advantageous to web<br />
designers and web-based application builders. It is also<br />
desirable to interactively investigate web access data and<br />
patterns, to allows ad-hoc discovery and examination <strong>of</strong><br />
patterns that are not apriori known. <strong>Visual</strong>izing the usage<br />
data in the context <strong>of</strong> the web site structure is <strong>of</strong> major<br />
importance, as it puts web access requests and their connectivity<br />
in perspective. Various visualization tools have<br />
been developed for this task, but <strong>of</strong>ten fail to provide visual<br />
data mining functionalities to generate new patterns. Here<br />
we present our visual data mining system, <strong>Web</strong>Viz, which<br />
allows interactive investigation <strong>of</strong> web usage data within<br />
their structure context, as well as ad-hoc knowledge pattern<br />
discovery on web navigational behaviour.<br />
Keywords—<strong>Visual</strong> <strong>Data</strong> <strong>Mining</strong>, <strong>Web</strong> <strong>Visual</strong>ization<br />
1 Introduction<br />
In addition to the large growing volume <strong>of</strong> information<br />
explicitly accessible in the World Wide <strong>Web</strong> (WWW),<br />
there is also an increasingly rich and complex fabric <strong>of</strong><br />
meta data. Not only does the hyperlink connections and<br />
structure induced by those connections provide another<br />
valuable information source, but the dynamic information<br />
resulting from the use <strong>of</strong> that structure and retrieval <strong>of</strong> information<br />
within that structure is an even richer knowledge<br />
resource. But that knowledge resource does not give up its<br />
insight easily, for it is not well-studied or well-understood,<br />
and there are few methods or measures that help provide<br />
insight into how the WWW is organized, how it is changing,<br />
or how it is used. There are some disciplined studies<br />
about the WWW (e.g., [13]), and even some interesting<br />
measures <strong>of</strong> the size <strong>of</strong> the Internet (e.g., [14]), both <strong>of</strong><br />
which note the potential for the value <strong>of</strong> the meta information<br />
within the world’s growing digital resource. However,<br />
it is clear that identifying and understanding that information<br />
requires new methods, most <strong>of</strong> which must exploit visualization<br />
to find and interpret interesting patterns.<br />
This paper provides an overview <strong>of</strong> our development<br />
and application <strong>of</strong> visualization tools for both the structure<br />
<strong>of</strong>, and dynamic usage <strong>of</strong> the WWW. In our work on<br />
the development <strong>of</strong> web navigation tools (e.g., Navigation<br />
Compression Models [21]), and the development <strong>of</strong> algebras<br />
to manipulate and interpret dynamic usage data [4],<br />
we have found that the volume <strong>of</strong> dynamic data is so large<br />
that we had to develop methods that not just provide visual<br />
representation <strong>of</strong> compressed data, but also provide insight<br />
into the machine learning methods that we use to extract<br />
structure from that data. Our visualization system, called<br />
<strong>Web</strong>Viz, combines a number <strong>of</strong> visualization and visual<br />
manipulation techniques from a broad range <strong>of</strong> existing<br />
web mining and visualization research. <strong>Web</strong>Viz embeds a<br />
visualization algebra tested on our initial prototype [4] that<br />
provides an interface metaphor similar to those that have<br />
been long used by cartographer; this provides users with<br />
the ability to compute properties <strong>of</strong> aggregate web data,<br />
and then layer that information in a visual space.<br />
The most important contribution <strong>of</strong> this paper is our development<br />
<strong>of</strong> a method for coupling the pattern generation<br />
with the visualization process, and propose novel operators<br />
to generate and distinguish knowledge patterns in their visualizations.<br />
We also present an improvement <strong>of</strong> the radial<br />
tree layout algorithm to minimize the occlusion problem.<br />
In an earlier paper [4], we proposed a visual data mining<br />
framework and a preliminary prototype to describe the data<br />
operations. Here, on the other hand, we extend the prototype<br />
with novel visual data mining operators, provide a<br />
more interactive user interface and improve the layout algorithm<br />
to use the available visual space. Contrary to existing<br />
visualization systems that only visualize data or mining<br />
results, our approach is novel in that data and patterns are<br />
visualized in their structure context, and interactive visual<br />
data mining operators are designed to manipulate data visualizations<br />
to discover interesting and implicit facts.<br />
The remainder <strong>of</strong> the paper is organized as follows: We<br />
first present our visual data mining framework in Section<br />
2. We then illustrate the visual data mining process with<br />
<strong>Web</strong>Viz in Section 3, and discuss the user interface design
and implementation issues in Section 4 and Section 5. <strong>Final</strong>ly<br />
we discuss pertinent related work in Section 6 before<br />
concluding in Section 7.<br />
2 The <strong>Visual</strong> <strong>Data</strong> <strong>Mining</strong> Framework<br />
As distinct from the definition in [1], which describes<br />
visual data mining as a step <strong>of</strong> the Knowledge Discovery<br />
and <strong>Data</strong> <strong>Mining</strong> (KDD) process, we define <strong>Visual</strong><br />
<strong>Data</strong> <strong>Mining</strong> as a supplement for the KDD process: visual<br />
data mining combines data mining methods and computeraided,<br />
interactive visual techniques in order to discover<br />
novel and interpretable patterns with the help <strong>of</strong> the human<br />
perception abilities. <strong>Visual</strong> data mining is not a required<br />
step, but can help data interpretation and mining in three<br />
different aspects <strong>of</strong> the KDD process: data integration, data<br />
mining, and pattern evaluation. <strong>Visual</strong> data mining can be<br />
seen as a visual hypothesis generation and verification process:<br />
visualizations allow the user to gain insight into the<br />
data, formulate new hypotheses, then verify them via visual<br />
data mining methods.<br />
In addition to visualizing data from web access logs<br />
and patterns derived from web mining processes, the main<br />
motivation guiding the design <strong>of</strong> our system is to provide<br />
means to interactively manipulate visualization objects to<br />
perform ad-hoc visual data mining and interpretation <strong>of</strong> the<br />
discoveries. A prototype framework <strong>Web</strong>KVDS and a web<br />
mining operator algebra was proposed in [4]. <strong>Web</strong>Viz is<br />
based on <strong>Web</strong>KVDS but implements more interactive visual<br />
functionalities and adds new operators to the algebra<br />
for visual data mining.<br />
In our framework, the object used for both visualizing<br />
web usage information and expressing visual data mining<br />
operations is a web graph. A web graph is a multi-tier object<br />
that combines all relevant information, including the<br />
web site structure data, usage data, and knowledge patterns.<br />
The first tier, which we call web image, is a tree representation<br />
<strong>of</strong> the web site structure and is visualized as the<br />
background <strong>of</strong> the graph, also referred to as “bare graph.”<br />
Each other tier, called an information layer or pattern layer,<br />
is a coherent collection <strong>of</strong> web data abstractions that can<br />
be laid over its context, which is the web image. These<br />
layers represent either pre-processed web usage statistics<br />
(e.g., page visits), or discovered patterns (e.g., association<br />
rules).<br />
Combining layers with the web image means laying<br />
web usage data onto their structure context, and results<br />
in a corresponding web graph. The visualization <strong>of</strong> these<br />
data layers maps usage data to visual cues such as colour,<br />
size, shape <strong>of</strong> the nodes, as well as colour and thickness <strong>of</strong><br />
links. The web image, representing the web connectivity<br />
structure, is always used as the background <strong>of</strong> the layers,<br />
allowing the localization <strong>of</strong> any information vis-à-vis their<br />
web context. By separating web data and mining results<br />
into different information layers, we are able to render each<br />
type <strong>of</strong> the usage data and pattern using different visual<br />
cues. Since each layer can be inhibited or rendered when<br />
the web graph is displayed, the user can select individual<br />
interesting layers to visualize and hide the others. Furthermore,<br />
showing several information layers that are mapped<br />
to different visual cues at a same time helps understand the<br />
implicit relations between usage data attributes.<br />
We believe the idea <strong>of</strong> visualizing data and patterns in<br />
distinct layers on top <strong>of</strong> a representation <strong>of</strong> the structure <strong>of</strong><br />
the web is useful, because it allows the display <strong>of</strong> information<br />
in context, which provides support for data interpretation<br />
and pattern discovery in web domain.<br />
3 <strong>Visual</strong> <strong>Web</strong> <strong>Data</strong> <strong>Mining</strong> with <strong>Web</strong>Viz<br />
Knowledge patterns are sometimes too complex and abstract<br />
for people to understand, even with the assistance <strong>of</strong><br />
visualization tools. <strong>Visual</strong> data mining tackles this task by<br />
enabling interactive human involvement with data mining<br />
methods to exploit visual perception. In <strong>Web</strong>Viz, the web<br />
usage data and navigational patterns can be interpreted and<br />
manipulated in the visual context <strong>of</strong> the web connectivity<br />
structure, which is constructed from web access records.<br />
More importantly, we define visual data mining operators<br />
to interactively discover novel visual patterns from existing<br />
data and pattern layers.<br />
3.1 <strong>Visual</strong>izing <strong>Web</strong> Usage <strong>Data</strong> and Patterns<br />
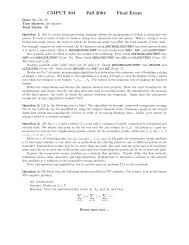
We adapt the disk tree [6] or radial tree representation<br />
to visualize the web image (Figure 1 (a)), in which a node<br />
indicates a page and an edge represents the hyperlink that<br />
connects two pages; the tree root, a node located in the center<br />
<strong>of</strong> the image, is a selected starting page for the rendering<br />
algorithm. The radial tree visualization is a concentric<br />
circular hierarchical layout with a root node at the center.<br />
The nodes in an outer circle are children <strong>of</strong> those <strong>of</strong> the<br />
inner circle. We chose the disk tree representation because<br />
the screen space is used more efficiently than other layout<br />
methods, but we have also improved the algorithm for node<br />
layout on the concentric perimeter to minimize the occlusion<br />
problem. This is discussed in Section 5.<br />
In the web domain, there are many possible data layers<br />
that can be extracted from the web access log dataset. We<br />
apply the methods <strong>of</strong> our previous work [21] to generate<br />
the usage data record and user sessions from web access<br />
logs. As a default, <strong>Web</strong>Viz uses node size to represent<br />
the page visit count, node colour to indicate the average<br />
page view time, edge thickness to show the hyperlink usage<br />
count, and edge colour to represent the usage count<br />
percentage <strong>of</strong> a hyperlink (out <strong>of</strong> total count <strong>of</strong> the hyperlinks<br />
that share the same start page). Figure 1 (b) shows an<br />
example <strong>of</strong> the web graph with several information layers.<br />
In addition to information layers that are extracted from<br />
web access logs, pattern layers, as outputs <strong>of</strong> different data
(a) <strong>Web</strong> Image (b) <strong>Web</strong> Graph with Information Layers (c) <strong>Web</strong> Graph with Pattern Layer<br />
Figure 1: <strong>Visual</strong>izing <strong>Web</strong> Usage <strong>Data</strong> and Pattern: (a) visualizes the web structure using a radial tree representation. (b)<br />
superposes web usage on visualization <strong>of</strong> web structure. (c) visualizes the association rule layer on the web graph.<br />
mining modules, can be visualized over the web structure<br />
as well, such as classes <strong>of</strong> pages, or clusters <strong>of</strong> pages or<br />
links. Association rules, which describe relations between<br />
items in a database <strong>of</strong> transactions, can be used to discover<br />
relationships between web pages or usage paths that are<br />
frequently accessed in a user session in the web context,<br />
e.g., an association rule A → B indicates the behaviour<br />
pattern <strong>of</strong> who visit page B through page A. We use the<br />
method proposed in [7] to discover navigational association<br />
rules from user sessions. Figure 1 (c) shows a web<br />
graph with the association rule pattern layer, mapped to visual<br />
cues as edge colours and size arrow heads. For each<br />
rule, the colour <strong>of</strong> the edge indicates the confidence value<br />
<strong>of</strong> the rule and the size <strong>of</strong> the arrow head represents the<br />
support value <strong>of</strong> the rule. For rules that have multiple<br />
antecedent or consequent items, edges between any two<br />
pages are connected and display the same value. To provide<br />
more information <strong>of</strong> involved pages <strong>of</strong> the rule, one<br />
colour is used to draw both the antecedent and consequent<br />
nodes. The size <strong>of</strong> the node represents the visit frequency<br />
<strong>of</strong> the corresponding page.<br />
3.2 <strong>Visual</strong> <strong>Data</strong> <strong>Mining</strong> with <strong>Web</strong>Viz Operators<br />
<strong>Visual</strong> exploration methods provide a way to help humans<br />
interpret data and understand their meaning. However,<br />
visual data mining approaches discover interesting<br />
patterns based on existing data visualizations. We proposed<br />
a prototype framework in [4], and defined an algebra<br />
<strong>of</strong> visual data mining operators:<br />
• Operator ADD sums the layer content for several<br />
graphs and displays the result for summary analysis.<br />
• Operator MINUS generates the value difference between<br />
the same layer <strong>of</strong> different graphs and is<br />
mostly used to compare visualizations <strong>of</strong> different<br />
time periods.<br />
• Operator COMMON selects the intersection <strong>of</strong><br />
graphs and allow the user to combine information<br />
from different layers.<br />
• Operator EXCEPT is the opposite <strong>of</strong> COMMON and<br />
represents the structure difference between graphs.<br />
• Operator MINUS IN and MINUS OUT subtracts<br />
values across different information layers.<br />
Details <strong>of</strong> these operators can be found in [4]. In <strong>Web</strong>-<br />
Viz, We have implemented all the operators listed above, as<br />
well as several new operators that we believe will provide<br />
better visual data mining.<br />
Two new operators are CONNECT-TO and CONNECT-<br />
FROM, which manipulate the visualization based on web<br />
connectivity structure. They are used to identify and visualize<br />
nodes and edges that connect to (from) the visualized<br />
objects in the current displayed graph. For website analysis,<br />
it is important to check pages that are popular with<br />
respect to content and visit frequency, as well as pages<br />
that lead or follow these popular pages in a navigation session.<br />
The two operators are designed to emphasize important<br />
pages, which identify important content pages that are<br />
heavily visited, as well as core pages, which connect important<br />
pages. These notions are analogous to Authorities<br />
and Hubs [11] except that we consider click-stream visitation<br />
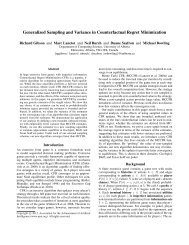
in addition to static links. An example <strong>of</strong> CONNECT-<br />
TO operator is shown in Figure 2. In the example, we first<br />
use filtering methods to produce a visualization for pages<br />
that have more than 500 visits in one particular month, then<br />
apply the CONNECT-TO operator to visualize the pages<br />
and links that lead the user to those pages in web navigation.<br />
Most <strong>of</strong> the pages that lead to highly visited pages are
Original web graph<br />
for one month.<br />
<strong>Visual</strong>ization after we filter out all<br />
nodes that have lower than 500 click<br />
count.<br />
<strong>Visual</strong>ization <strong>of</strong> pages and hyperlinks<br />
that leads to those popular pages using<br />
the CONNECT−TO operator.<br />
Figure 2: Using CONNECT-TO operator to find “core pages” and “important pages”: first use filtering methods to produce<br />
a visualization for pages that have more than 500 visits in one particular month, then apply the CONNECT-TO operator to<br />
visualize the pages and links that lead the user to those pages in web navigation.<br />
usually popular themselves. However, we may find some<br />
unexpected routes that surprisingly lead the navigation to<br />
“hot” pages or, in contrast, find routes that fail to do the<br />
job as designed. Such discovery can certainly help web<br />
administrators and designers improve the quality <strong>of</strong> their<br />
web sites.<br />
Information layers in <strong>Web</strong>Viz are extracted from web<br />
usage data. However, interpreting only usage data is not<br />
sufficient to discover all the implicit information. For example,<br />
page visit count and hyperlink usage data can be<br />
extracted and displayed, but information about web site<br />
entry page (where people enter the site and start the navigation)<br />
and exit pages (where people end the session and<br />
leave) are implicit but can not be discovered from what is<br />
visualized. Therefore, we develop a new operator VIR-<br />
TUAL to add new layers, where “virtual” means “not from<br />
extracted data.” Using <strong>Web</strong>Viz, one can provide an expression<br />
to describe how to generate a new layer from provided<br />
data. After the user-defined operator is applied, the<br />
result is recorded as a new layer and mapped to a visual<br />
cue. The resulting layer can also be used as a normal layer<br />
for other operators in another “VIRTUAL” operation expression.<br />
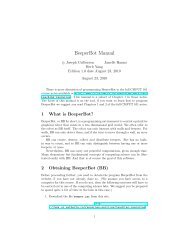
Figure 3 shows an example that generates virtual<br />
web site entry and exit layers. In the example, we apply<br />
two “VIRTUAL” operations to create layers that record the<br />
frequency <strong>of</strong> pages used as site entry or exit. Two expressions<br />
(Figure 3) are used to describe the operations. The<br />
results are mapped to node size as visual cues. From those<br />
visualizations, we find that the entry and exit points are<br />
quite similar; in other words, pages that start a navigation<br />
are typically the last page <strong>of</strong> other navigations. However,<br />
these two layers are not identical; we can still find some<br />
differences at the top and bottom <strong>of</strong> the disktree circle.<br />
Overall, operator VIRTUAL allows users to create their<br />
own operators, and define data mining algorithms as operators<br />
to create new layers. For example, after incorporating<br />
data mining packages with <strong>Web</strong>Viz, it is possible to define<br />
a virtual operator to cluster nodes based on a usage data<br />
layer <strong>of</strong> web pages, then map the result labels to different<br />
colours to display the clusters on the web structure. The<br />
cluster layer can be further used in other manipulations or<br />
“VIRTUAL” operations.<br />
The <strong>Web</strong>Viz operators are not just advanced data filtering<br />
methods, which select objects to visualize according<br />
to their attribute values. In <strong>Web</strong>Viz, some operators,<br />
e.g. CONNECT-TO / FROM, select objects based on their<br />
structural connectivity; some operators, e.g. ADD / MI-<br />
NUS, manipulate layer values and rebuild the visualization;<br />
some operators, e.g. VIRTUAL, create new data layers<br />
based on existing ones by any user-defined method.<br />
These characteristics are not included in any filtering methods.<br />
Therefore, by combining <strong>Web</strong>Viz operators together<br />
with visual exploration methods, our approach helps a user<br />
understand the data and its visualization, and further generate<br />
more specific and meaningful graphs in an interactive<br />
manner to better comprehend and interpret the navigational<br />
behaviour on a web site.<br />
4 User Interface<br />
We combined and implemented several interactive exploration<br />
methods that existing web visualization tools provide,<br />
such as zooming, rotation, filtering, search and legend<br />
edit. The user interface (UI) consisted <strong>of</strong> one graphical<br />
view window and three operational menus. It was designed
Original web graph<br />
for one month.<br />
Substract sum <strong>of</strong> the usage <strong>of</strong> all<br />
incoming link from the visit count to<br />
generate virtual Entry layer:<br />
VisitCount − sum(InEdges−>LinkUsage)<br />
Layer is represented by node size.<br />
Substract sum <strong>of</strong> the usage <strong>of</strong> all<br />
outgoing link from the visit count to<br />
generate virtual Exit layer:<br />
VisitCount − sum(OutEdges−>LinkUsage)<br />
Layer is represented by node size.<br />
Figure 3: Create and Compare Virtual Site Entry and Exit Layers: apply two “VIRTUAL” operations to create layers that<br />
record the frequency <strong>of</strong> pages used as site entry or exit. Two expressions are used to describe the operations. Results are<br />
mapped to node size.<br />
to help the user to interpret and discover web usage data<br />
and patterns.<br />
Figure 4 shows the graphical view with menus. A radial<br />
tree representing the web structure and visual cues representing<br />
information layers are visualized in the left window.<br />
A brief description and graph ID is shown on the left<br />
top corner. The status bar shows the connection status with<br />
a data server, and the information <strong>of</strong> the currently selected<br />
object. The loading bar is located in the right bottom <strong>of</strong><br />
the window, and indicates progress <strong>of</strong> loading remote data<br />
from the server. We classify <strong>Web</strong>Viz functionalities into<br />
three categories and display them in three tabs:<br />
• <strong>Visual</strong> Tab: A user can click on the legend to insert,<br />
delete or modify the value range and select preferred<br />
colour, change visual cue-layer mapping, or select<br />
layers to visualize.<br />
• Operator Tab: <strong>Visual</strong> data mining operators are<br />
listed. A user can click any <strong>of</strong> the buttons and corresponding<br />
menus will pop-up to <strong>of</strong>fer more detailed<br />
selection options.<br />
• Information Tab: The context window for zooming<br />
is at the top <strong>of</strong> this tab. An user can click on the<br />
context window to change the position <strong>of</strong> the radial<br />
tree drawn in the graphical view window. The center<br />
window in the info tab displays the result <strong>of</strong> node<br />
searching. The URLs <strong>of</strong> search results are displayed<br />
here and corresponding nodes in the graphical view<br />
window will display as big yellow dots (e.g., the root<br />
node in Figure 4). The window at the bottom <strong>of</strong> the<br />
tab shows the detailed information about the selected<br />
object.<br />
We also provide several mouse-controlled interaction functions.<br />
For example, users can adjust the mouse wheel to<br />
zoom in or zoom out, right click to bring out a menu <strong>of</strong><br />
common functionalities, or left click to select a node or an<br />
edge.<br />
5 Implementation<br />
<strong>Web</strong>Viz is implemented in Java and is designed for use<br />
within a client-server model. The server holds all usage<br />
data, web structure data, discovered patterns and meta files.<br />
A Java applet client can connect to the server, and select<br />
the meta description to load data for visual data mining.<br />
By modifying specific meta files, users can personalize<br />
their own representation preferences without impacting<br />
others or changing the source. After the data is loaded, the<br />
user can apply interactive operators to generate interesting<br />
patterns based on their understanding <strong>of</strong> the visualization,<br />
then record the result on the server for future reference. A<br />
client demo is available online as a Java Applet Application<br />
in [18].<br />
5.1 System Performance<br />
The web usage and structural data we used are generated<br />
from monthly server-produced access logs <strong>of</strong> our department<br />
website. The data preparation [21] consists <strong>of</strong><br />
crawling the website structure, cleaning irrelevant records,<br />
and breaking the access log into user sessions. In order<br />
to cut usage records into sessions, we identify users by<br />
their authentication or cookie value, then exclude all other
A<br />
Graphical View <strong>Visual</strong> Tab Operator Tab Context Tab<br />
Figure 4: Snapshot <strong>of</strong> <strong>Web</strong>Viz System and Functionality Tabs<br />
records without both authentication and cookie. The session<br />
timeout is set to be 30 minutes. A constraint-based<br />
frequent itemset discovery algorithm [7] is applied on these<br />
navigational sessions to generate focused associations between<br />
web pages.<br />
<strong>Web</strong>Viz is efficient in handling large data. It usually<br />
takes the system less than five seconds to generate a disk<br />
tree <strong>of</strong> our complete department site, which contains more<br />
than 100,000 web pages. The node query functionality can<br />
also be done in seconds. For data sets that have more than<br />
millions <strong>of</strong> nodes, <strong>Web</strong>Viz users can apply filtering operations<br />
as well as reasonably set the root and depth <strong>of</strong> the<br />
disktree to achieve fast visualization.<br />
5.2 Improvements to the Disktree Layout Algorithm<br />
The WWW is made up <strong>of</strong> web pages and hyperlinks.<br />
Since one page usually connects to many other pages, the<br />
structure is more like a connected graph than a hierarchical<br />
tree. In order to visualize the web structure, the Disktree<br />
algorithm [6] addresses the problem by only showing one<br />
link leading into a page: the algorithm selects a “parent”<br />
for a certain page from the pages that connect to it. The<br />
original disktree algorithm used Breadth First Search and<br />
selected the first link that appeared in the data scan. The<br />
Usage Based Search [4] improved that algorithm by selecting<br />
the link with the highest visit frequency. Both <strong>of</strong> these<br />
algorithms are provided in <strong>Web</strong>Viz.<br />
While web structure is converted into a tree by the Disktree<br />
algorithm, web pages do not have any preferred positions<br />
in a visual space. To visualize the structure, the<br />
disktree method puts the root node in the center then draw<br />
nodes in different radius around the root node. Children<br />
nodes <strong>of</strong> the root are drawn in the first level, children <strong>of</strong><br />
those nodes are located in the next level and so on. For<br />
each level, locations <strong>of</strong> nodes are decided by the total number<br />
<strong>of</strong> nodes <strong>of</strong> that level n, on an angle that determined<br />
by 360o<br />
n<br />
. However, when a node has many more children<br />
than other nodes on the same level, this method may cause<br />
severe occlusion problems, e.g., in Figure 4, the number<br />
<strong>of</strong> children <strong>of</strong> node A is more than half <strong>of</strong> the nodes on<br />
the second level. If angles <strong>of</strong> the nodes on the first level<br />
were distributed by the original method, edges from A to<br />
its children would overlap with other nodes. In order to<br />
minimize occlusions, we have implemented an alternative<br />
layout method for the disktree structure. Instead <strong>of</strong> calculating<br />
angles for each level, we distribute the 360 degree<br />
among those “dead-end” nodes, which are either located in<br />
the outmost level or have no children. Then we recursively<br />
compute the angle for nodes <strong>of</strong> inside levels until we reach<br />
the root using the formula: A P = Amin+Amax<br />
2<br />
, where A P<br />
represents the angle for the parent, A min and A max represent<br />
the minimum and maximum angle <strong>of</strong> its child nodes.<br />
Our new layout method assigns more visual space to bigger<br />
subtrees and effectively solves the occlusion problem<br />
<strong>of</strong> visualizing the tree structure.<br />
6 Related Work<br />
As defined in [1], visual data mining uses visualization<br />
as a communication channel between the computer and the<br />
user, to produce novel and interpretable patterns. There are<br />
three classes <strong>of</strong> visual data mining.
• <strong>Visual</strong>ization <strong>of</strong> data mining results. Extracted patterns<br />
are visualized to make them more interpretable.<br />
• <strong>Visual</strong>ization <strong>of</strong> the data mining process. The process<br />
<strong>of</strong> a mining algorithm can be visualized to help<br />
the discovery.<br />
• <strong>Visual</strong>ization <strong>of</strong> the data. <strong>Data</strong> is visualized before a<br />
mining algorithm is applied.<br />
While there are many systems [6, 15, 16, 19, 20] that focus<br />
on visualizing data mining results and the source data,<br />
Ankerst et al. [2, 3] developed the PBC system to visualize<br />
decision tree construction and the data classification process.<br />
J. Han et al. proposed the RuleViz model [10] and<br />
developed the DTViz [9] and CVizT [8] systems to visualize<br />
the decision tree and classification rule construction<br />
process to use visual space in a more efficient way.<br />
In the WWW domain, visual data mining approaches<br />
concentrate on representing the relationship between web<br />
usage data and web structure. Ed Chi et al. [6] proposed<br />
the Disktree representation to display the usage data and<br />
structure information. The graph has been used to visualize<br />
web site evolution, web usage trends over time, and evaluation<br />
<strong>of</strong> information “foraging” [5]. The <strong>Web</strong>KIV [15]<br />
system implemented the disktree representation to compare<br />
web navigational patterns and defined a three dimensional<br />
scale to describe the web visualization task. A visual<br />
web mining prototype framework was designed in [4]<br />
to describe the object manipulation for visual data mining<br />
purposes. Youssefi et al. [19] implement a visual web mining<br />
system using 3D representation, but severe occlusion<br />
problems make the approach impractical. A recent visual<br />
data mining system, <strong>Web</strong>Patterns [16], focuses on visualizing<br />
web usage associations, sequences, and network analysis.<br />
Most <strong>of</strong> these systems apply the idea <strong>of</strong> visualizing<br />
usage data using visual cues <strong>of</strong> the structure object, however,<br />
more interactive operations can be added to describe<br />
various possible visual data mining manipulations.<br />
<strong>Web</strong> structure visualization is paramount for a visual<br />
web mining system to provide a concise overview and<br />
background for usage data details. One <strong>of</strong> the most popular<br />
methods to visualize web structure is Chi’s radial disktree<br />
representation [6]. Since the radial tree layout uses<br />
screen space more efficiently than other layout methods,<br />
many systems [4, 5, 15, 16] adapted the disktree method<br />
to visualize web structure. Other similar approaches include<br />
the ConeTree [17] and the Hyperbolic tree [12]. As<br />
we have discussed in Section 5, a hierarchical tree representation<br />
drops many hyperlinks in order to transform the<br />
web connectivity graph into a tree, which can suffer object<br />
occlusion when dealing with large numbers <strong>of</strong> nodes.<br />
7 Conclusions<br />
We present our visual data mining approaches to interpret<br />
the data we extracted from web access logs. We extend<br />
our visual data mining prototype framework to visualize<br />
and mine web usage data to understand web page access<br />
behaviours vis-à-vis the connectivity structure. We<br />
describe the concepts <strong>of</strong> web image, information layers<br />
and web graphs, and present the idea <strong>of</strong> mapping data and<br />
pattern to visual cues as distinct layers on top <strong>of</strong> a radial<br />
tree representation <strong>of</strong> the web structure, which allows incontext<br />
information display. We further provide visual data<br />
exploration and mining operators in our <strong>Web</strong>Viz system for<br />
data interpretation and knowledge pattern discovery. Our<br />
visual data mining system can visualize multi-layer web<br />
graphs and, with the help <strong>of</strong> these operators, provides a<br />
powerful tool for interactive visual web mining.<br />
Acknowledgments<br />
Our work is supported by the Canadian Natural Sciences<br />
and Engineering Research Council (NSERC), by the<br />
Alberta Ingenuity Centre for Machine Learning (AICML),<br />
and by the Alberta Informatics Circle <strong>of</strong> Research Excellence<br />
(iCORE).<br />
References<br />
[1] M. Ankerst. <strong>Visual</strong> <strong>Data</strong> <strong>Mining</strong>. Ph.D Thesis. Institute<br />
for Computer Science, University <strong>of</strong> Munich,<br />
2000.<br />
[2] M. Ankerst, C. Elsen, M. Ester, and H. Kriegel. <strong>Visual</strong><br />
classification: An interactive approach to decision<br />
tree construction. In ACM SIGKDD 1999, pages<br />
392–396.<br />
[3] M. Ankerst, M. Ester, and H. Kriegel. Towards an effective<br />
cooperation <strong>of</strong> the user and the computer for<br />
classification. In ACM SIGKDD 2000, pages 179–<br />
188.<br />
[4] J. Chen, L. Sun, O. R. Zaïane, and R. Goebel. <strong>Visual</strong>izing<br />
and discovering web navigational patterns. In<br />
Seventh ACM SIGMOD International Workshop on<br />
the <strong>Web</strong> and <strong>Data</strong>bases (<strong>Web</strong>DB 2004), pages 13–18.<br />
[5] Ed H. Chi. Improving web usability through visualization.<br />
IEEE Internet Computing, 6(2):64–71,<br />
March/April 2002.<br />
[6] Ed H. Chi, J. Pitkow, J. Mackinlay, P. Pirolli, R. Gossweiler,<br />
and S. K. Card. <strong>Visual</strong>izing the evolution <strong>of</strong><br />
web ecologies. In Proceeding <strong>of</strong> CHI, 1998.<br />
[7] M. El-Hajj and O. R. Zaïane. Non recursive generation<br />
<strong>of</strong> frequent k-itemsets from frequent pattern tree
epresentations. In Proc. <strong>of</strong> 5th International Conference<br />
on <strong>Data</strong> Warehousing and Knowledge Discovery,<br />
September 2003.<br />
[8] J. Han and N. Cercone. Interactive construction <strong>of</strong><br />
classification rules. In PAKDD 2002, pages 529–534.<br />
[9] J. Han and N. Cercone. Interactive construction <strong>of</strong><br />
decision trees. In PAKDD 2001, pages 575–580.<br />
[10] J. Han and N. Cercone. Ruleviz: A model for visualizing<br />
knowledge discovery process. In ACM<br />
SIGKDD 2000, pages 223–242.<br />
[11] J. Kleinberg. Authoritative sources in a hyperlinked<br />
environment. Journal <strong>of</strong> the ACM, 46(5):604–632,<br />
1999.<br />
[12] J. Lamping, R.Rao, and P.Pirolli. A focus+context<br />
technique based on hyperbolic gemetry for visualizing<br />
large hierarchies. In ACM SIGCHI, pages 401–<br />
408, May 1995.<br />
[13] S. Lawrence and C.L. Giles. Accessibility <strong>of</strong> information<br />
on the web. Intelligence, 11(1):32–39, 2000.<br />
Reprinted from Nature, 400, 107-109, 1999.<br />
[14] The internet mapping project.<br />
http://www.cheswick.com/ches/map/index.html<br />
http://research.lumeta.com/ches/map/gallery/index.html.<br />
[15] Y. Niu, T. Zheng, J. Chen, and R. Goebel. <strong>Web</strong>kiv:<br />
<strong>Visual</strong>izing structure and navigation for web mining<br />
applications. In Proceedings <strong>of</strong> IEEE <strong>Web</strong> Intelligence<br />
Conference (WIC), 2003.<br />
[16] C. Oosthuizen, J. Wesson, and C. Cilliers. <strong>Visual</strong> web<br />
mining <strong>of</strong> organizational web sites. In IV ’06: Proceedings<br />
<strong>of</strong> the conference on Information <strong>Visual</strong>ization,<br />
pages 395–401.<br />
[17] G. Robertson, J. Mackinlay, and S. Card. Cone trees:<br />
Animated 3d visualizations <strong>of</strong> hierarchical information.<br />
In Proc. <strong>of</strong> ACM SIGCHI conference on Human<br />
Factors in Computing Systems ’91, pages 189–194.<br />
[18] <strong>Web</strong>Viz: http://kingman.cs.ualberta.ca/research/demos/<br />
content/webviz/demo/src/front/<strong>Web</strong>VizClientApplet.html.<br />
[19] A. Youssefi, D.Duke, M.Zaki, and E.Glinert. Toward<br />
visual web mining. In Proceeding <strong>of</strong> <strong>Visual</strong><br />
<strong>Data</strong> <strong>Mining</strong> at IEEE Intl Conference on <strong>Data</strong> <strong>Mining</strong><br />
(ICDM), Florida, 2003.<br />
[20] K. Zhao, B. Liu, T. M. Tirpak, and W. Xiao. A visual<br />
data mining framework for convenient identification<br />
<strong>of</strong> useful knowledge. In ICDM ’05, pages 530–537.<br />
[21] T. Zheng, Y. Niu, and R. Goebel. <strong>Web</strong>frame: In pursuit<br />
<strong>of</strong> computationally and cognitively efficient web<br />
mining. In PAKDD 2002, pages 264–275.