Visual Data Mining of Web Navigational Data - Make Final Year ...
Visual Data Mining of Web Navigational Data - Make Final Year ...
Visual Data Mining of Web Navigational Data - Make Final Year ...

You also want an ePaper? Increase the reach of your titles
YUMPU automatically turns print PDFs into web optimized ePapers that Google loves.
A<br />
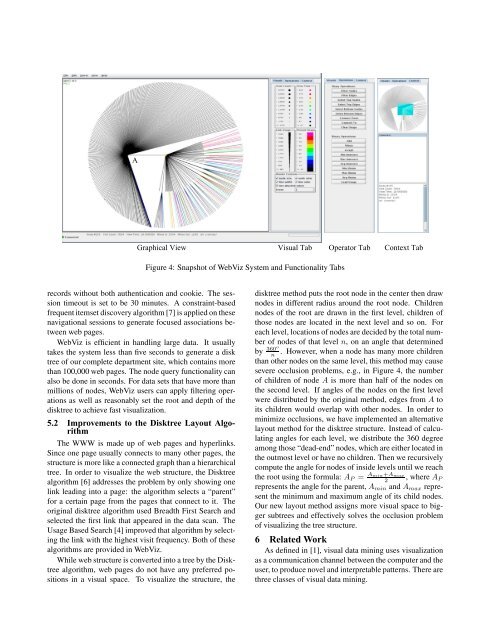
Graphical View <strong>Visual</strong> Tab Operator Tab Context Tab<br />
Figure 4: Snapshot <strong>of</strong> <strong>Web</strong>Viz System and Functionality Tabs<br />
records without both authentication and cookie. The session<br />
timeout is set to be 30 minutes. A constraint-based<br />
frequent itemset discovery algorithm [7] is applied on these<br />
navigational sessions to generate focused associations between<br />
web pages.<br />
<strong>Web</strong>Viz is efficient in handling large data. It usually<br />
takes the system less than five seconds to generate a disk<br />
tree <strong>of</strong> our complete department site, which contains more<br />
than 100,000 web pages. The node query functionality can<br />
also be done in seconds. For data sets that have more than<br />
millions <strong>of</strong> nodes, <strong>Web</strong>Viz users can apply filtering operations<br />
as well as reasonably set the root and depth <strong>of</strong> the<br />
disktree to achieve fast visualization.<br />
5.2 Improvements to the Disktree Layout Algorithm<br />
The WWW is made up <strong>of</strong> web pages and hyperlinks.<br />
Since one page usually connects to many other pages, the<br />
structure is more like a connected graph than a hierarchical<br />
tree. In order to visualize the web structure, the Disktree<br />
algorithm [6] addresses the problem by only showing one<br />
link leading into a page: the algorithm selects a “parent”<br />
for a certain page from the pages that connect to it. The<br />
original disktree algorithm used Breadth First Search and<br />
selected the first link that appeared in the data scan. The<br />
Usage Based Search [4] improved that algorithm by selecting<br />
the link with the highest visit frequency. Both <strong>of</strong> these<br />
algorithms are provided in <strong>Web</strong>Viz.<br />
While web structure is converted into a tree by the Disktree<br />
algorithm, web pages do not have any preferred positions<br />
in a visual space. To visualize the structure, the<br />
disktree method puts the root node in the center then draw<br />
nodes in different radius around the root node. Children<br />
nodes <strong>of</strong> the root are drawn in the first level, children <strong>of</strong><br />
those nodes are located in the next level and so on. For<br />
each level, locations <strong>of</strong> nodes are decided by the total number<br />
<strong>of</strong> nodes <strong>of</strong> that level n, on an angle that determined<br />
by 360o<br />
n<br />
. However, when a node has many more children<br />
than other nodes on the same level, this method may cause<br />
severe occlusion problems, e.g., in Figure 4, the number<br />
<strong>of</strong> children <strong>of</strong> node A is more than half <strong>of</strong> the nodes on<br />
the second level. If angles <strong>of</strong> the nodes on the first level<br />
were distributed by the original method, edges from A to<br />
its children would overlap with other nodes. In order to<br />
minimize occlusions, we have implemented an alternative<br />
layout method for the disktree structure. Instead <strong>of</strong> calculating<br />
angles for each level, we distribute the 360 degree<br />
among those “dead-end” nodes, which are either located in<br />
the outmost level or have no children. Then we recursively<br />
compute the angle for nodes <strong>of</strong> inside levels until we reach<br />
the root using the formula: A P = Amin+Amax<br />
2<br />
, where A P<br />
represents the angle for the parent, A min and A max represent<br />
the minimum and maximum angle <strong>of</strong> its child nodes.<br />
Our new layout method assigns more visual space to bigger<br />
subtrees and effectively solves the occlusion problem<br />
<strong>of</strong> visualizing the tree structure.<br />
6 Related Work<br />
As defined in [1], visual data mining uses visualization<br />
as a communication channel between the computer and the<br />
user, to produce novel and interpretable patterns. There are<br />
three classes <strong>of</strong> visual data mining.