Visual Data Mining of Web Navigational Data - Make Final Year ...
Visual Data Mining of Web Navigational Data - Make Final Year ...
Visual Data Mining of Web Navigational Data - Make Final Year ...

You also want an ePaper? Increase the reach of your titles
YUMPU automatically turns print PDFs into web optimized ePapers that Google loves.
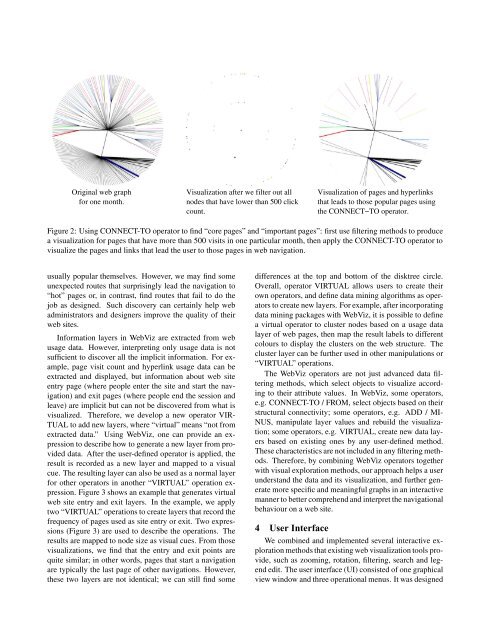
Original web graph<br />
for one month.<br />
<strong>Visual</strong>ization after we filter out all<br />
nodes that have lower than 500 click<br />
count.<br />
<strong>Visual</strong>ization <strong>of</strong> pages and hyperlinks<br />
that leads to those popular pages using<br />
the CONNECT−TO operator.<br />
Figure 2: Using CONNECT-TO operator to find “core pages” and “important pages”: first use filtering methods to produce<br />
a visualization for pages that have more than 500 visits in one particular month, then apply the CONNECT-TO operator to<br />
visualize the pages and links that lead the user to those pages in web navigation.<br />
usually popular themselves. However, we may find some<br />
unexpected routes that surprisingly lead the navigation to<br />
“hot” pages or, in contrast, find routes that fail to do the<br />
job as designed. Such discovery can certainly help web<br />
administrators and designers improve the quality <strong>of</strong> their<br />
web sites.<br />
Information layers in <strong>Web</strong>Viz are extracted from web<br />
usage data. However, interpreting only usage data is not<br />
sufficient to discover all the implicit information. For example,<br />
page visit count and hyperlink usage data can be<br />
extracted and displayed, but information about web site<br />
entry page (where people enter the site and start the navigation)<br />
and exit pages (where people end the session and<br />
leave) are implicit but can not be discovered from what is<br />
visualized. Therefore, we develop a new operator VIR-<br />
TUAL to add new layers, where “virtual” means “not from<br />
extracted data.” Using <strong>Web</strong>Viz, one can provide an expression<br />
to describe how to generate a new layer from provided<br />
data. After the user-defined operator is applied, the<br />
result is recorded as a new layer and mapped to a visual<br />
cue. The resulting layer can also be used as a normal layer<br />
for other operators in another “VIRTUAL” operation expression.<br />
Figure 3 shows an example that generates virtual<br />
web site entry and exit layers. In the example, we apply<br />
two “VIRTUAL” operations to create layers that record the<br />
frequency <strong>of</strong> pages used as site entry or exit. Two expressions<br />
(Figure 3) are used to describe the operations. The<br />
results are mapped to node size as visual cues. From those<br />
visualizations, we find that the entry and exit points are<br />
quite similar; in other words, pages that start a navigation<br />
are typically the last page <strong>of</strong> other navigations. However,<br />
these two layers are not identical; we can still find some<br />
differences at the top and bottom <strong>of</strong> the disktree circle.<br />
Overall, operator VIRTUAL allows users to create their<br />
own operators, and define data mining algorithms as operators<br />
to create new layers. For example, after incorporating<br />
data mining packages with <strong>Web</strong>Viz, it is possible to define<br />
a virtual operator to cluster nodes based on a usage data<br />
layer <strong>of</strong> web pages, then map the result labels to different<br />
colours to display the clusters on the web structure. The<br />
cluster layer can be further used in other manipulations or<br />
“VIRTUAL” operations.<br />
The <strong>Web</strong>Viz operators are not just advanced data filtering<br />
methods, which select objects to visualize according<br />
to their attribute values. In <strong>Web</strong>Viz, some operators,<br />
e.g. CONNECT-TO / FROM, select objects based on their<br />
structural connectivity; some operators, e.g. ADD / MI-<br />
NUS, manipulate layer values and rebuild the visualization;<br />
some operators, e.g. VIRTUAL, create new data layers<br />
based on existing ones by any user-defined method.<br />
These characteristics are not included in any filtering methods.<br />
Therefore, by combining <strong>Web</strong>Viz operators together<br />
with visual exploration methods, our approach helps a user<br />
understand the data and its visualization, and further generate<br />
more specific and meaningful graphs in an interactive<br />
manner to better comprehend and interpret the navigational<br />
behaviour on a web site.<br />
4 User Interface<br />
We combined and implemented several interactive exploration<br />
methods that existing web visualization tools provide,<br />
such as zooming, rotation, filtering, search and legend<br />
edit. The user interface (UI) consisted <strong>of</strong> one graphical<br />
view window and three operational menus. It was designed