annual report 2011
annual report 2011
annual report 2011

Create successful ePaper yourself
Turn your PDF publications into a flip-book with our unique Google optimized e-Paper software.
<strong>annual</strong> <strong>report</strong> <strong>2011</strong>
IOOF | <strong>annual</strong> <strong>report</strong> <strong>2011</strong><br />
Contents<br />
Our major brands 1<br />
About IOOF 2<br />
Our financial performance 4<br />
Chairman’s statement 6<br />
Managing Director’s overview 7<br />
Divisional overview 9<br />
Directors’ profiles 12<br />
Corporate governance 15<br />
Working at IOOF 18<br />
IOOF supporting the community 19<br />
Financials 21<br />
This <strong>report</strong> is dated 29 September <strong>2011</strong>
IOOF | <strong>annual</strong> <strong>report</strong> <strong>2011</strong><br />
Our major brands<br />
(as at the date of this <strong>report</strong>)<br />
Financial advice and distribution<br />
Platform management and administration<br />
Investment management<br />
Trustee services<br />
page 1
IOOF | <strong>annual</strong> <strong>report</strong> <strong>2011</strong><br />
About IOOF<br />
For over 165 years, IOOF has accompanied Australians’<br />
journey towards a secure and rewarding financial future.<br />
How big are we<br />
As at 30 June <strong>2011</strong><br />
Market capitalisation: $1.5 billion<br />
Number of employees: 984<br />
FUMAS<br />
$106.2 billion<br />
Number of clients approx 700,000<br />
Number of financial advisers: approx 650<br />
page 2
IOOF | <strong>annual</strong> <strong>report</strong> <strong>2011</strong><br />
IOOF is one of Australia’s largest independent financial services<br />
companies offering financial advice and distribution, platform<br />
management and administration, investment management and<br />
trustee services.<br />
IOOF’s products and services are designed to accompany the lives of around 700,000<br />
Australians from wealth accumulation into retirement and across to the next generation.<br />
IOOF is listed on the Australian Securities Exchange (ASX:IFL).<br />
At 30 June <strong>2011</strong>, IOOF Holdings Limited (IOOF) had $106.2 billion in Funds Under<br />
Management, Administration, Advice and Supervision.<br />
IOOF’s business today is vastly different to that which debuted on the Australian Stock<br />
Exchange in 2003, and completely unrecognisable from its humble beginnings as a<br />
Friendly Society in 1846.<br />
IOOF has been helping Australians for over 165 years.<br />
What does IOOF do<br />
IOOF provides a range of wealth management solutions for Australians, including:<br />
Financial advice and distribution services via our extensive network of financial<br />
advisers and stockbrokers. IOOF advises retail clients on investment strategies, wealth<br />
protection and accumulation, stockbroking and retirement planning. Together with our<br />
referral partners, IOOF services thousands of clients to make us one of Australia’s leading<br />
financial planning groups.<br />
Platform management and administration for advisers, their clients and hundreds of<br />
employers in Australia. Our platforms allow clients, employers and advisers to manage a<br />
wide range of superannuation and investment options, including managed funds and<br />
direct shares.<br />
Investment management products that are designed to suit any investor’s needs.<br />
IOOF offers multi-manager products that are easy to understand with well-rounded<br />
investment options across a range of asset classes. Through Perennial Investment<br />
Partners, Australia’s leading boutique investment house, investors can access<br />
investments in Australian shares, international shares, Australian listed property, global<br />
listed property, fixed interest and cash.<br />
Trustee services including Estate Planning and Corporate Trust services. Australian<br />
Executor Trustees (AET) team of estate planning lawyers, prepare estate plans, Wills,<br />
powers of attorney and manage deceased estates on behalf of their clients. AET is<br />
also a specialist in the provision of personal trusts. The AET Corporate Trust team<br />
act as custodian for managed investment schemes, trustee or security trustee for<br />
securitisation and structured finance transactions, and trustee for note and other<br />
debt issues.<br />
page 3
IOOF | <strong>annual</strong> <strong>report</strong> <strong>2011</strong><br />
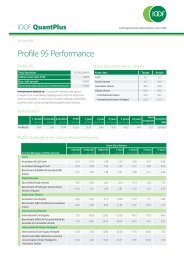
Our financial performance<br />
Funds by segment<br />
$28.3b<br />
$30.2b<br />
Trustee and estate services<br />
$23.6b<br />
$24.2b<br />
Platform management and administration<br />
$17.3b<br />
$18.7b<br />
Financial advice and distribution<br />
$29.9b<br />
$33.1b<br />
Investment management<br />
2009/10 2010/11<br />
Where we make our money<br />
Trustee and estate services 4%<br />
Investment management 30%<br />
Financial advice and<br />
distribution 6%<br />
Platform management<br />
and administration 60%<br />
page 4
IOOF | <strong>annual</strong> <strong>report</strong> <strong>2011</strong><br />
Understanding the data<br />
behind our performance<br />
The key drivers affecting the financial<br />
performance for the financial year<br />
ended 30 June <strong>2011</strong> were: increased<br />
revenues arising from improved Funds<br />
Under Management and Administration;<br />
Advice and Supervision (FUMAS); and<br />
lower operating expenditure given the<br />
realisation of productivity gains from the<br />
group’s business simplification program.<br />
The major influences on FUMAS are<br />
expanded upon below. Operating<br />
expenditure improvements have been<br />
achieved due to concerted efforts to<br />
reduce the scale of the group’s product<br />
offering thereby simplifying processes<br />
and reducing the labour cost needed<br />
to support them. Additionally, this has<br />
allowed business to be conducted at<br />
fewer geographic centres at a lower cost<br />
from major service suppliers and lower<br />
reliance on paper based communication<br />
with key stakeholders.<br />
Funds under management<br />
and administration, advice<br />
and supervision (FUMAS)<br />
Influences on the growth of FUMAS<br />
include:<br />
Market performance<br />
The largest contributor to the increase<br />
in FUMAS was the performance of the<br />
markets in which IOOF FUMAS was<br />
invested, in particular equities, fixed<br />
interest and property. IOOF revenue<br />
will grow or reduce with the positive or<br />
negative impact of market valuations on<br />
average FUMAS for the current <strong>report</strong>ing<br />
period relative to the average FUMAS<br />
from the prior period.<br />
Number of investors<br />
The number of investors in IOOF products<br />
affects the level of FUMAS and therefore<br />
IOOF’s performance. Investments can<br />
be placed into IOOF products through<br />
superannuation funds, via independent<br />
and aligned financial advisers or directly<br />
with IOOF. Funds can be invested into<br />
IOOF platforms or into external platforms<br />
that include IOOF products.<br />
Number of advisers<br />
Independent and aligned financial<br />
advisers are a key source of investment<br />
funds as they provide a sales distribution<br />
network for IOOF products. The number<br />
of advisers supporting IOOF products,<br />
therefore, influences the growth in<br />
FUMAS.<br />
Investment performance<br />
Good investment performance attracts<br />
funds. Individual fund performance is<br />
disclosed on the IOOF website at<br />
www.ioof.com.au<br />
Shareholder value<br />
Shareholder value can be measured by:<br />
Total shareholder return<br />
Total shareholder return (TSR) measures<br />
the change in share value over a specified<br />
period together with the return by way<br />
of dividends received. IOOF’s TSR for<br />
the year to 30 June <strong>2011</strong> was 17%. TSR<br />
since the merger with Australian Wealth<br />
Management on 30 April 2009 to 30 June<br />
<strong>2011</strong> is 84%.<br />
Earnings per share<br />
Basic earnings per share were 43.1 cents<br />
per share compared to 33.7 cents per<br />
share for last year. Diluted earnings per<br />
share were 42.9 cents per share compared<br />
to 33.6 cents per share for last year, noting<br />
that due to a change in accounting<br />
policies the figures for the prior year have<br />
been restated.<br />
On an underlying pre amortisation<br />
earnings basis, where the impact<br />
of certain non operational and / or<br />
accounting adjustments is removed, basic<br />
earnings per share were 48.4 cents per<br />
share compared to 42.4 cents per share<br />
for last year. This reflected increased<br />
underlying pre amortisation earnings and<br />
a reasonably stable weighted average<br />
number of issued shares.<br />
Franking credits<br />
The balance of the franking account at<br />
30 June <strong>2011</strong> of $14.0 million will support<br />
the payment of fully franked dividends as<br />
recommended by Directors.<br />
page 5
IOOF | <strong>annual</strong> <strong>report</strong> <strong>2011</strong><br />
Chairman’s statement<br />
Ian Blair<br />
IOOF <strong>report</strong>ed another<br />
impressive result<br />
I am pleased to <strong>report</strong> that IOOF <strong>report</strong>ed<br />
another impressive statutory Net Profit after<br />
Tax of $99.5 million and an Underlying Net<br />
Profit after Tax and pre-amortisation result<br />
of $111.5 million.<br />
Our business simplification strategy is<br />
paying dividends.<br />
Despite the difficult global market<br />
conditions, the money IOOF manages on<br />
behalf of its clients increased 7 per cent for<br />
the year to $106.2 billion.<br />
Corporate governance and<br />
Regulatory changes<br />
Our industry continues to be the subject of<br />
regulatory change following a number of<br />
reviews in prior years. In their current format,<br />
the recommendations should not impact<br />
IOOF in a meaningful way. In fact, in some<br />
instances there will be no change for IOOF<br />
as some of the processes recommended<br />
have been standard practice for quite<br />
some time.<br />
As Directors, we continue to take the view<br />
that governance is not just a matter for the<br />
Board, but for the organisation as a whole,<br />
and risk control is very much part of the<br />
culture at IOOF.<br />
Final dividend of 22 cents<br />
per share paid in October<br />
During the year, the Directors were pleased<br />
to declare an interim dividend of 21 cents<br />
which was paid on 23 March <strong>2011</strong> and a<br />
final dividend of 22 cents with a payment<br />
date of 20 October <strong>2011</strong>. This takes the total<br />
dividend paid to shareholders, to 43 cents<br />
per share for the year under review.<br />
These dividends are at the top end of our<br />
stated dividend policy of 60-90 per cent of<br />
Underlying Net Profit After Tax.<br />
The IOOF Foundation<br />
On page 19 of the <strong>annual</strong> <strong>report</strong> we<br />
feature the IOOF Foundation who assist<br />
Disadvantaged Families, Aged Care groups<br />
and Disadvantaged Youth. These have<br />
been the areas of community interest to<br />
IOOF since it was established as a Friendly<br />
Society in 1846. We are all very proud of<br />
the Foundation, and thank the directors<br />
Ken Barry, Ron Bunton, Angelika Dischen,<br />
Elizabeth Alexander and Susan Heron who<br />
freely give their time to this wonderful<br />
organisation.<br />
Directors<br />
There have been a couple of important<br />
changes in the makeup of the board since<br />
I last <strong>report</strong>ed to you.<br />
Retirement of Jim Pfeiffer<br />
At the end of the financial year, and after<br />
six years of service to IOOF, Jim Pfeiffer<br />
decided to retire from the Board. Jim has<br />
been a member of the IOOF Board since<br />
October 2005. During this time, Jim has held<br />
positions on the Risk and Compliance and<br />
Audit Committees of the IOOF Holdings<br />
Board and a number of its subsidiary<br />
companies.<br />
On behalf of the board, I would like to<br />
thank Jim for the significant and important<br />
contribution he has made to the growth<br />
and development of IOOF throughout his<br />
tenure with the group and wish him well in<br />
his retirement and community activities.<br />
Appointment of Kevin White<br />
We recently announced that Kevin White<br />
has accepted our invitation to join the<br />
board. Until recently, Kevin has been CEO<br />
of WHK Group Ltd. He retired on 30 June<br />
after 15 years in that role. Kevin will bring his<br />
considerable skills to the board along with<br />
his deep experience in the Financial Advice<br />
and Planning industry.<br />
I would like to take this opportunity to<br />
personally thank my fellow directors<br />
for their service this year. In difficult<br />
market conditions there is a heightened<br />
responsibility placed on directors, especially<br />
in a company where we are the custodian<br />
of so many people’s money.<br />
I also wish to thank the Managing Director,<br />
Leadership Group and our employees for<br />
their continuing hard work – something<br />
that is evident from the strong result<br />
achieved this financial year.<br />
Much of the past few years have been spent<br />
consolidating and simplifying our business<br />
in preparation for future growth. Despite<br />
the volatility in global markets, I remain<br />
optimistic about the future prosperity<br />
for IOOF.<br />
Ian Blair<br />
Chairman<br />
page 6
IOOF | <strong>annual</strong> <strong>report</strong> <strong>2011</strong><br />
Managing Director’s overview<br />
Chris Kelaher<br />
The 2010/11 financial year saw IOOF <strong>report</strong> an underlying net profit after tax of $111.5 million,<br />
a 15 per cent improvement on the prior year, and a statutory net profit after tax of $99.5 million.<br />
The money we manage on behalf of our<br />
clients increased $7.1 billion to $106.2<br />
billion. Pleasingly, the growth we have<br />
experienced in flows to our flagship<br />
platforms continues to be ahead of<br />
industry growth.<br />
I am pleased to <strong>report</strong> that we have made excellent progress on this program as<br />
demonstrated by the diagram below:<br />
Business Simplification Program<br />
Originally<br />
Jun <strong>2011</strong><br />
Dec <strong>2011</strong>*<br />
Beyond <strong>2011</strong><br />
One of our flagship platforms, IOOF<br />
Pursuit, recently passed $2 billion in Funds<br />
Under Advice, having launched in 2006.<br />
The last $1 billion has come in just<br />
18 months.<br />
I am proud of the fact that we were able<br />
to <strong>report</strong> record profits and an increase<br />
in client monies, while delivering on our<br />
business simplification strategy.<br />
Last year I introduced the Business<br />
Simplification Program to shareholders.<br />
Under that program, the number<br />
of superannuation and investment<br />
platforms, and IT systems would be<br />
consolidated, and our overall property<br />
footprint would be reduced by the end<br />
of December <strong>2011</strong>.<br />
The program has allowed IOOF to reduce<br />
risk in its business as well as enhance<br />
efficiencies. This is a significant long<br />
term benefit for members and<br />
shareholders alike.<br />
Platforms<br />
IT admin systems<br />
RSE licenses<br />
Corporate offices<br />
8<br />
8<br />
3<br />
16<br />
* Indicative timetable subject to change<br />
Achievements this year have included:<br />
• Consolidating several floors in two<br />
different Melbourne properties into<br />
one contemporary office, spanning<br />
one floor.<br />
• Outsourcing the management of<br />
two IT administration systems to IBM,<br />
reducing risk and freeing up resources<br />
for other IT projects.<br />
• Reduction of group structure, with<br />
10 fewer companies at the date of<br />
this <strong>report</strong>.<br />
5<br />
5<br />
3<br />
12<br />
3<br />
4<br />
1<br />
10<br />
Rationalisation<br />
based on<br />
commercial<br />
and strategic<br />
intent<br />
• These changes have come at an<br />
opportune time. Fewer products and<br />
fewer systems changes facilitates<br />
IOOF’s timely response to any<br />
regulatory change that we may see<br />
in future years. Now that the majority<br />
of the work is behind us, we are well<br />
positioned for future growth.<br />
page 7
IOOF | <strong>annual</strong> <strong>report</strong> <strong>2011</strong><br />
IOOF remains well positioned for any change in the regulatory environment.<br />
In a <strong>report</strong> on the Future of Financial Advice Reforms, an industry body, the Financial Planning Association of Australia wrote:<br />
“Organisations which own both platforms and dealer groups are unlikely to be affected other than marginally…”<br />
Source: FoFA Reforms Summary of Recommendations, Financial Planning Association of Australia, 20 December 2010<br />
IOOF is one such organisation.<br />
A vertically integrated company has a number of businesses providing a different service in the same industry, but they are united<br />
through a common owner. IOOF has four distinct divisions that reflect all aspects of wealth management in Australia:<br />
Division<br />
Financial advice<br />
and distribution<br />
Platform management<br />
and administration<br />
Investment<br />
management<br />
Trustee<br />
DKN expands our<br />
distribution capabilities<br />
We see the financial advice & distribution<br />
division as pivotal to the success of<br />
the vertically integrated model that<br />
we operate. That is why in June we<br />
announced to the Australian Securities<br />
Exchange that we would acquire the<br />
financial advice group, DKN. IOOF has had<br />
a long association with DKN, courtesy of<br />
a substantial shareholding in the group<br />
along with the fact that I have been a<br />
director of the group since 2009.<br />
With the addition of DKN, the number<br />
of financial planners IOOF has providing<br />
advice to Australians about their financial<br />
future will increase to over 1000.<br />
Further investment in IT<br />
and a reduction in costs<br />
IOOF’s continued focus on costs has seen<br />
a 4 per cent fall in IOOF’s cost to income<br />
ratio to 51 per cent on an underlying basis<br />
excluding Ord Minnett and benefit funds.<br />
This reduction in costs has been coupled<br />
with a continued investment in IOOF’s IT<br />
systems.<br />
Outlook<br />
Volatile conditions in global markets<br />
have necessarily meant that providing<br />
financial forecasts is most difficult.<br />
Nevertheless IOOF is well positioned to<br />
successfully navigate its way through<br />
these challenging times.<br />
Off the back of this strong result, and<br />
courtesy of its strong balance sheet and<br />
simplified operating model, IOOF is ready<br />
for further new growth.<br />
Chris Kelaher<br />
Managing Director<br />
page 8
IOOF | <strong>annual</strong> <strong>report</strong> <strong>2011</strong><br />
Divisional updates<br />
Financial advice and distribution<br />
$’m 2010/<strong>2011</strong> 2009/2010 * Change on prior year (%)<br />
Revenue 129.0 122.9 13.55%<br />
UNPAT pre amortisation 7.8 7.8 -<br />
Average FUA ($’b) 18.6 16.5 12.73%<br />
* the 2009/10 period has been reclassified to confirm with this year’s presentation<br />
About the division<br />
Financial Advice and distribution is represented by well known brands Bridges Financial Services, Wealth Managers, Ord Minnett<br />
Stockbrokers and Consultum Financial Advisers.<br />
More than 650 advisers and associated stockbrokers provide advice to retail and institutional clients on retirement planning, wealth<br />
accumulation and investment strategies.<br />
Activities<br />
• Remain well positioned to take advantage of further flight to quality in clients and planners as a result of FoFA regulatory reforms.<br />
• Development of our customised software offering for advisers and clients.<br />
• Improved netflow into platforms.<br />
Platform administration<br />
$’m 2010/<strong>2011</strong> 2009/2010 Change on prior year (%)<br />
Revenue 352.9 351.5 0%<br />
UNPAT pre amortisation 76.9 67.8 13.42%<br />
Average FUA ($’b) 24.3 24.3 0%<br />
About the division<br />
IOOF’s platforms allow clients, employers and advisers to manage a wide range of superannuation and investment options, including<br />
managed funds and direct shares. Our flagship platforms include Pursuit, Spectrum Super and The Portfolio Service.<br />
Activities<br />
• Reduced the number of platform administration systems under the Business Simplification Program.<br />
• Flagship platforms experienced further growth during 2010/<strong>2011</strong>.<br />
• Two of our platforms, Pursuit and Austchoice retained their 5 star superannuation fund rating by Canstar Cannex, in its<br />
superannuation star ratings <strong>report</strong>.<br />
page 9
IOOF | <strong>annual</strong> <strong>report</strong> <strong>2011</strong><br />
Investment management<br />
$’m 2010/<strong>2011</strong> 2009/2010 * Change on prior year (%)<br />
Revenue 132.4 128.1 3.35%<br />
UNPAT pre amortisation 37.5 33.5 11.94%<br />
Average FUA ($’b) 32.0 29.6 8.11%<br />
* the 2009/10 period has been reclassified to conform with this year’s presentation<br />
About the division<br />
IOOF offers multi-manager products that are easy to understand with well-rounded investment options across a range of asset<br />
classes. Through Perennial Investment Partners, Australia’s leading boutique investment house, investors can access investments in<br />
Australian shares, international shares, Australian listed property, global listed property, fixed interest and cash.<br />
Activities<br />
Multimanager<br />
• Improved rating from Lonsec Research. Funds now have a “Recommended” rating.<br />
• Initiated Chant West rating of IOOF multimanager funds. Awarded a (4) four Apples rating on multimanager funds.<br />
• Merger of United and Multimix sector funds completed.<br />
• Integration of United and Multi Mix diversified funds nearing completion.<br />
Perennial Investment Partners Limited<br />
• The Australian Catholic Super Superannuation and Retirement Fund awarded Perennial a $100 million global equities mandate.<br />
• Perennial received a number of awards this year. Most notably:<br />
––<br />
Winner: 2010 Golden Bull Fixed Interest Award<br />
––<br />
Finalist: 2010 Golden Bull Australian Listed Property Securities Award<br />
––<br />
Winner: Money Management/Lonsec Fund Manager of the Year <strong>2011</strong> Australian Equities (Small Caps)<br />
––<br />
Winner: Morningstar 2010 Fund Manager of the Year, Domestic Equities - Small Caps Australia.<br />
Lonsec<br />
The Lonsec Limited (Lonsec) ABN 56 061 751 102 rating (assigned December 2010) presented in this document is limited to general advice and based solely on consideration<br />
of the investment merits of the financial product(s). It is not a recommendation to purchase, sell or hold the relevant product(s), and you should seek independent financial<br />
advice before investing in this product(s). The rating is subject to change without notice and Lonsec assumes no obligation to update this document following publication.<br />
Lonsec receives a fee from the fund manager for researching the product(s) using comprehensive and objective criteria.<br />
page 10
IOOF | <strong>annual</strong> <strong>report</strong> <strong>2011</strong><br />
Trustee services<br />
$’m 2010/<strong>2011</strong> 2009/2010 Change on prior year (%)<br />
Revenue 20.8 20.4 1.96%<br />
UNPAT pre amortisation 4.9 4.7 4.26%<br />
Average FUA ($’b) 28.0 30.2 (7.29%)<br />
About the division<br />
The Trustee division includes Estate Planning and corporate trust services, operating under the brand, Australian Executor Trustees.<br />
The team of estate planning lawyers, prepare estate plans, Wills, powers of attorney and manage deceased estates on behalf of their<br />
clients. AET is also a specialist in the provision of personal trusts.<br />
The Corporate Trust team act as custodian for managed investment schemes, trustee or security trustee for securitisation and<br />
structured finance transactions, and trustee for note and other debt issues.<br />
Activities<br />
• In current flat market conditions, Corporate Trust activity remained broadly in line with forecast activity, which was a positive.<br />
The focus during the year has been on process efficiency gains.<br />
• AET Super Solutions was rebranded AET Superannuation and launched a new SMSF offering.<br />
• Private Client was also rebranded Estates and Trustee Services and adopted a “partnering” strategy which has seen tremendous<br />
growth in compensation trust appointments (now over $200 million).<br />
• The Estate Panning arm also launched a new service, AET National, offering remote access to regional dealer group offices for<br />
estate planning services.<br />
page 11
IOOF | <strong>annual</strong> <strong>report</strong> <strong>2011</strong><br />
Directors<br />
(as at the date of this <strong>report</strong>)<br />
Ian Blair<br />
OAM, MMgt, FCA<br />
Chairman – Independent Non-Executive<br />
Director<br />
Ian has been a Non-Executive Director<br />
of IOOF Holdings Ltd since 2002 and<br />
Chairman since 2005.<br />
He has extensive experience in the<br />
fields of finance, accounting, audit and<br />
taxation with accounting firm Deloitte<br />
Touche Tohmatsu, including five years as<br />
Managing Partner and CEO between 1989<br />
and 1997.<br />
Other current Directorships<br />
• Capral Ltd (Director since 2006).<br />
Special responsibilities<br />
• Group Chairman of IOOF Holdings Ltd.<br />
• Chairman of the Remuneration and<br />
Nominations Committee.<br />
• Ex officio member of all Board<br />
Committees.<br />
Dr Roger Sexton<br />
B.Ec. (Hons), M.Ec. Ph.D (Econ), FAICD,<br />
FAIM. S.FFin, C. P Mgr, C.Univ<br />
Deputy Chairman – Independent<br />
Non-Executive Director<br />
Roger has been a Non-Executive Director<br />
of IOOF Holdings Ltd since 2002.<br />
Roger has over twenty years experience<br />
in senior management in finance and<br />
the investment banking industry and<br />
a specialist in the areas of corporate<br />
reconstruction, mergers and acquisitions,<br />
and asset management.<br />
Other current Directorships<br />
• TWT Group Limited<br />
(Director since 2008).<br />
Special responsibilities<br />
• Member of the Remuneration and<br />
Nominations Committee.<br />
• Member of the Audit Committee.<br />
Christopher Kelaher<br />
B.Ec, LL.B, F Fin<br />
Managing Director<br />
Experience and expertise<br />
Chris was appointed as Managing<br />
Director of IOOF Holdings Ltd following<br />
the merger of IOOF and Australian<br />
Wealth Management Limited, having<br />
previously served as Managing Director of<br />
antecedent companies Australian Wealth<br />
Management Ltd and Select Managed<br />
Funds Ltd since 1997.<br />
Chris has more than 20 years experience<br />
in investment management and business<br />
development.<br />
During his time at Citicorp, Mr Kelaher was<br />
responsible for business management,<br />
strategic marketing and sales growth in<br />
Australia. He also performed an important<br />
role in the establishment of Citicorp<br />
Investment Management/Global Asset<br />
Management in Australia and establishing<br />
its New Zealand business.<br />
Other current Directorships<br />
• DKN Financial Group Ltd<br />
(Director since 2004).<br />
Special responsibilities<br />
• Managing Director of IOOF.<br />
page 12
IOOF | <strong>annual</strong> <strong>report</strong> <strong>2011</strong><br />
Ian Griffiths<br />
C.Acc, DipAll, MIIA<br />
Non-Executive Director<br />
Ian was appointed a Non-Executive<br />
Director of IOOF Holdings Ltd upon<br />
the merger with Australian Wealth<br />
Management in April 2009.<br />
Ian has more than 30 years experience<br />
in the financial and superannuation<br />
industries, having commenced his career<br />
in superannuation administration and<br />
business consulting with AMP in 1972.<br />
He has extensive industry knowledge and<br />
skills, particularly in operations, mergers<br />
and acquisitions.<br />
Special responsibilities<br />
• Member of the Remuneration and<br />
Nominations Committee.<br />
• Member of the Audit Committee.<br />
Jane Harvey<br />
B.Com, MBA, FCA, FAICD<br />
Independent Non-Executive Director<br />
Jane has been a Non-Executive Director<br />
of IOOF Holdings Ltd since 2005.<br />
Jane has more than 30 years experience<br />
in financial and advisory services,<br />
governance and risk management.<br />
Ms Harvey was formerly a Partner at<br />
PricewaterhouseCoopers.<br />
Special responsibilities<br />
• Chairman of the Audit Committee.<br />
• Member of the Risk and Compliance<br />
Committee.<br />
Mr G Venardos<br />
BComm, FCA, FCIS, FAICD, FTIA<br />
Independent Non-Executive Director<br />
George was appointed as a Non-<br />
Executive Director of IOOF Holdings Ltd<br />
in April 2009, following the merger with<br />
Australian Wealth Management Limited.<br />
He has more than thirty years experience<br />
in financial services with senior<br />
executive experience in finance, IT, funds<br />
management, reinsurance and corporate<br />
services.<br />
George’s former roles include that of<br />
Group Chief Financial Officer of Insurance<br />
Australia Group Ltd (from 1998 to 2008),<br />
Chairman Finance and Accounting<br />
Committee of The Insurance Council of<br />
Australia (from 1998 to 2008) and Group<br />
Director of Finance of Legal and General<br />
Australia (from 1986 to 1998).<br />
Other current Directorships<br />
• Bluglass Ltd (Non-executive Chairman<br />
from 2008).<br />
• Ardent Leisure Ltd (Director<br />
from 2009).<br />
Special responsibilities<br />
• Chairman of the Risk and Compliance<br />
Committee.<br />
• Member of the Remuneration and<br />
Nominations Committee.<br />
page 13
IOOF | <strong>annual</strong> <strong>report</strong> <strong>2011</strong><br />
IOOF’s future is focused on<br />
adviser driven growth...<br />
page 14
IOOF | <strong>annual</strong> <strong>report</strong> <strong>2011</strong><br />
Corporate Governance<br />
The Board of Directors and management of IOOF recognise the importance of good corporate<br />
governance and are committed to maintaining high governance standards within the Group. This is an<br />
organisational priority since IOOF is both a listed company and an entity operating within the highly<br />
regulated financial services sector, overseen by APRA, ASIC, the ASX and AUSTRAC.<br />
The Board is responsible to its<br />
shareholders for the performance of the<br />
Company. The Board’s focus is to enhance<br />
the interests of shareholders and key<br />
stakeholders (eg employees, regulators,<br />
etc).<br />
A summary of the Company’s policies<br />
and procedures in relation to governance<br />
is available in the corporate governance<br />
section of the Company’s website:<br />
www.ioof.com.au<br />
The Company’s corporate governance<br />
policies and practices are reviewed<br />
at least <strong>annual</strong>ly and will continue<br />
to develop and improve through<br />
benchmarking against best practice<br />
corporate governance.<br />
Principle 1: Lay solid<br />
foundations for<br />
management and<br />
over sight<br />
The Board is constituted and empowered<br />
under its Constitution and the<br />
requirements of the Corporations Act<br />
2001. The Board has delegated some of<br />
their powers to Board Committees and<br />
Management including:<br />
• overseeing strategic objectives and<br />
direction of the company<br />
• setting and monitoring <strong>annual</strong><br />
operating plans<br />
• monitoring financial objectives<br />
• ongoing assessment and monitoring<br />
of performance<br />
• determining group financial strategy<br />
and policies<br />
• managing and monitoring risk and<br />
compliance, internal compliance and<br />
control<br />
• reviewing the Company’s code<br />
of conduct and overall corporate<br />
governance to ensure effective<br />
and timely disclosure of policies,<br />
procedures and other relevant data<br />
to the market, shareholders and<br />
customers.<br />
Delegation to Managing<br />
Director<br />
The Board delegates to the Managing<br />
Director responsibility for implementing<br />
the Company’s strategy and managing<br />
day to day operations. Clear lines of<br />
communication have been established<br />
between the Chairman and the<br />
Managing Director to ensure these<br />
responsibilities are understood.<br />
Appointment of Directors<br />
All Directors receive an induction pack on<br />
appointment which sets out the Board’s<br />
responsibilities, the Director’s duties and<br />
the role of the Committees.<br />
Principle 2: Structure the<br />
board to add value<br />
Board independence<br />
A Director of IOOF will be considered<br />
independent where the Director is<br />
independent of Management (ie a<br />
Non-Executive Director), does not hold<br />
a substantial interest in the company<br />
and is free from any business or other<br />
relationship that could materially<br />
interfere with, or could reasonably be<br />
perceived to interfere with, the exercise<br />
of independent judgement. The Board<br />
has made its own assessment to<br />
determine the independence of each<br />
Director and notes that at the date of<br />
this <strong>report</strong> four of the six Directors are<br />
considered independent. The Board<br />
notes the requirement for a majority of<br />
independent Directors.<br />
Composition of Board<br />
At the date of this <strong>report</strong> the Board<br />
comprises five Non-Executive Directors,<br />
four of which are independent and<br />
one Executive Director (Christopher<br />
Kelaher). Mr Ian Griffiths is not considered<br />
independent as he was previously an<br />
executive with the Australian Wealth<br />
Management business within the past<br />
three year period.<br />
A profile of each Director is set out in<br />
the Director’s <strong>report</strong>. The Chairman<br />
is selected by the Board and is an<br />
independent Director. The Chairman<br />
and Managing Director have separate<br />
roles. The Chairman provides leadership<br />
to the Board and is responsible for the<br />
efficient Management of the business<br />
of the Board. The Chairman is either a<br />
member or an ex-officio member of each<br />
Board Committee. The independent<br />
Non-Executive Directors are Messrs Blair,<br />
Venardos, Dr Sexton and Ms Harvey.<br />
As at the date of this <strong>report</strong>, both the<br />
Board and its committees had conducted<br />
a performance evaluation by way of a<br />
self-assessment survey for the period.<br />
page 15
IOOF | <strong>annual</strong> <strong>report</strong> <strong>2011</strong><br />
Remuneration and Nominations<br />
Committee<br />
The Board has established a Group<br />
Remuneration and Nominations<br />
Committee. Terms of Reference<br />
have been formalised which include<br />
responsibility for nominating and,<br />
recommending Independent Directors<br />
and the CEO. The Committee ensures<br />
that the Managing Director’s and<br />
Senior Management remuneration<br />
arrangements are performance based,<br />
correspond to the prevailing market levels<br />
and are consistent with the principles for<br />
sound compensation practices including<br />
Management succession planning and<br />
the approval of all short term and long<br />
term plans across the Group.<br />
The Committee meets at a minimum four<br />
times a year and comprises Mr Blair (Chair)<br />
and Messrs Griffiths and Venardos and Dr<br />
Sexton.<br />
Principle 3: Promote ethical<br />
and responsible decision<br />
making<br />
The Board has developed a Code of<br />
Conduct which is designed to ensure a<br />
high standard of corporate and individual<br />
behaviour. Each employee is to read<br />
and accept the Code of Conduct as part<br />
of their induction and provide <strong>annual</strong><br />
affirmation thereafter.<br />
Directors, executives and all employees<br />
are aware of their responsibilities under<br />
the terms of their appointment or<br />
contract of employment. The Code<br />
provides that Directors and executives<br />
must act honestly, in good faith and in<br />
the best interests of the company; use<br />
due care, skill and diligence in fulfilling<br />
their duties; use the power of their<br />
position; not allow personal interests,<br />
or those of associates, to conflict with<br />
interests of the company; exercise<br />
independent judgement and maintain<br />
confidentiality. A copy of this policy is<br />
available on the company’s website.<br />
Directors, officers and employees are<br />
subject to the Corporations Act 2001 in<br />
relation to restrictions applying to the<br />
acquisition or disposal of securities of<br />
the Company if they are in possession of<br />
insider information. Directors, officers and<br />
employees are restricted from trading in<br />
the Company’s securities during certain<br />
blackout periods.<br />
In addition, Directors have entered into<br />
an agreement with the Company which<br />
requires approval before trading in the<br />
company’s securities and on-going<br />
disclosure to the company of any change<br />
in the Director’s interest in securities<br />
within three business days of the change<br />
occurring.<br />
Principle 4: Safeguard<br />
integrity in financial<br />
<strong>report</strong>ing<br />
The Board of IOOF receives regular<br />
<strong>report</strong>s about the financial condition<br />
and operational performance of IOOF<br />
and its controlled entities. The Managing<br />
Director and Chief Financial Officer<br />
<strong>report</strong> in writing to the Board that the<br />
consolidated financial statements of IOOF<br />
for each half year and full year present a<br />
true and fair view, in all material respects,<br />
of the Group’s financial condition and are<br />
in accordance with accounting standards.<br />
In addition, they <strong>report</strong> on the company’s<br />
risk management system (financial;<br />
strategic and operational) and its<br />
effectiveness. The Board has established<br />
an Audit Committee to provide assistance<br />
to the Board in accordance with<br />
established Terms of Reference.<br />
The Audit Committee meets at least four<br />
times per year. The Committee comprises<br />
Non-Executive Directors with a majority<br />
of Independent Directors. The Chair of<br />
the committee is not the Chairman of<br />
the Board. The principal functions of<br />
the Audit Committee are to review the<br />
half and full year financial <strong>report</strong>, review<br />
accounting policies, appoint the internal<br />
and external auditors and to ensure<br />
the effectiveness of IOOF’s systems of<br />
accounting, internal controls and risk<br />
management. The Board has adopted a<br />
formal policy on the provision of nonaudit<br />
services.<br />
The members of the Audit Committee<br />
are Ms Harvey (Chair), Messrs Griffiths and<br />
Pfeiffer and Dr Sexton.<br />
Principle 5: Make timely<br />
and balanced disclosure<br />
The Board is committed to keeping<br />
its shareholders and the market fully<br />
informed of major developments that<br />
may have an impact on the Company.<br />
Procedures are in place to identify matters<br />
that are likely to have a material effect on<br />
the price of the company’s securities and<br />
to ensure those matters are notified to<br />
the Australian Securities Exchange (ASX)<br />
in accordance with Listing Rule disclosure<br />
requirements.<br />
The company has a continuous<br />
disclosure policy which is circulated to<br />
all employees. The IOOF Continuous<br />
Disclosure Policy is designed to meet<br />
best practice, ensuring all interested<br />
parties have an equal opportunity to<br />
obtain information which is issued by<br />
the Company. The Company Secretary<br />
is responsible for maintaining a register<br />
of information referred to her or the<br />
Managing Director that a Director,<br />
executive or employee has identified as a<br />
potential item for disclosure.<br />
All disclosure is actioned as soon as<br />
advised.<br />
The Company Secretary is responsible for<br />
all communications with the ASX.<br />
A copy of this policy is available on the<br />
company’s website.<br />
page 16
IOOF | <strong>annual</strong> <strong>report</strong> <strong>2011</strong><br />
Principle 6: Respect rights<br />
of shareholders<br />
IOOF recognises the right of shareholders<br />
to be informed of matters, in addition<br />
to those prescribed by law, which affect<br />
their investments in the company. IOOF<br />
communicates shareholder information<br />
and news about the company through<br />
the <strong>annual</strong> <strong>report</strong>, disclosures to the ASX,<br />
ASIC and via the company’s website. The<br />
Board encourages active participation by<br />
shareholders at any company meetings.<br />
IOOF ensures that the Company’s auditor<br />
attends the <strong>annual</strong> general meeting<br />
or other meetings of the Company<br />
and shareholders are afforded the<br />
opportunity of asking the Company’s<br />
auditor questions regarding the conduct<br />
and content of the audit. A shareholder<br />
may submit a question to the auditor<br />
prior to the meeting by emailing the<br />
Company Secretary.<br />
Principle 7: Recognise and<br />
manage risk<br />
The Board recognises that effective<br />
management of risk is an integral part of<br />
sound management and is vital to the<br />
continued growth and success of IOOF.<br />
The Board is ultimately responsible for<br />
the oversight of the IOOF Group’s risk<br />
management and control framework and<br />
has implemented a policy framework<br />
designed to ensure that the Group’s<br />
risks are identified, analysed, evaluated,<br />
monitored and communicated within the<br />
organisation or to any relevant external<br />
party and that adequate controls and<br />
mitigation processes in place function<br />
effectively.<br />
In addition to the Audit Committee,<br />
the Board has established a Risk and<br />
Compliance Committee (RCC), which<br />
is responsible for reviewing all aspects<br />
of risk and compliance on behalf of<br />
the Board. In addition, this Committee<br />
ensures all correspondence and action<br />
plans required by the Company as a<br />
result of reviews by the Company’s<br />
regulators are completed in a timely<br />
manner. The committee comprises three<br />
independent non-executive Directors,<br />
members from the legal, compliance<br />
and internal audit and risk management<br />
team of the business and a representative<br />
from each operating business within<br />
the Group. At this committee the Group<br />
Head of Risk <strong>report</strong>s to the Committee<br />
on the monitoring of risk through the<br />
business and risk <strong>report</strong>ing through the<br />
enterprise-wide framework including<br />
where appropriate, positive assurance.<br />
This Committee meets at least quarterly<br />
and <strong>report</strong>s to the Board and provides<br />
minutes of the Committee meeting and<br />
relevant <strong>report</strong>s to the Audit Committee<br />
to ensure all committees are fully<br />
informed.<br />
The Managing Director and the Chief<br />
Financial Officer <strong>report</strong> in writing to<br />
the Board that to the best of their<br />
knowledge and belief, the statement<br />
given in accordance with best practice<br />
recommendation 4.1 is founded on a<br />
sound system of risk management and<br />
internal compliance and control which is<br />
operating efficiently and effectively in all<br />
material respects in so far as they relate<br />
to financial, strategic and operational<br />
risks. This <strong>report</strong> confirms that the system<br />
which implements the policies adopted<br />
by the Board either directly or through<br />
delegation to Management and that the<br />
Company’s risk management and internal<br />
compliance is operating effectively in all<br />
material respects as at the date of the<br />
<strong>report</strong>, based on the risk management<br />
model adopted by the Board. The<br />
statements provide a reasonable, but not<br />
absolute, level of assurance and do not<br />
imply a guarantee against adverse events<br />
or more volatile outcomes arising in the<br />
future. In addition, the <strong>report</strong> sets out that<br />
risk management and internal compliance<br />
and internal control systems are subject<br />
to periodic declaration by process owners<br />
and review through the Company’s<br />
internal audit process and by regulators.<br />
The Company has established a number<br />
of other policies which include, but are<br />
not limited to, the Delegations Policy, IT<br />
Code of Conduct, Anti-Money Laundering<br />
and Counter-Terrorism Policy, Complaints<br />
and Breach Reporting Policy, Risk<br />
Management Plan and Risk Management<br />
Policy, Capital Adequacy, Outsourcing<br />
Policy and the Fit and Proper Policy.<br />
Principle 8: Remunerate<br />
fairly and responsibly<br />
The remuneration policy objective<br />
of IOOF is to ensure that employee<br />
emoluments properly reflect the person’s<br />
duties and responsibilities and is designed<br />
to attract, retain and motivate executives<br />
of the highest quality and standard.<br />
The level of remuneration of Directors<br />
and Executives is set out in the Director’s<br />
<strong>report</strong> and Notes to the Financial<br />
Report. The Board has established a<br />
Group Remuneration and Nominations<br />
Committee which reviews compensation<br />
arrangements for the Managing Director<br />
and Executives including an assessment<br />
of an individual’s performance, a review of<br />
market rates for similar positions and the<br />
results of the Company during the period.<br />
The Board has an agreed procedure<br />
when sourcing external assistance or<br />
independent advice at the expense of the<br />
company.<br />
This statement is dated<br />
29 September <strong>2011</strong>.<br />
page 17
IOOF | <strong>annual</strong> <strong>report</strong> <strong>2011</strong><br />
Working at IOOF<br />
Diversity in the workplace<br />
IOOF recognises the benefits of diversity<br />
where people from different backgrounds<br />
can bring fresh ideas and perceptions<br />
which makes the way work is undertaken<br />
more efficient and effective and our<br />
company’s products and services are<br />
more valued. Throughout the year,<br />
IOOF adopted a diversity policy and<br />
implemented a diversity plan. The plan<br />
focuses on improving the representation<br />
of:<br />
• Women in senior roles.<br />
• Leadership.<br />
• Aboriginal and Torres Strait Islanders.<br />
• People whose first language was not<br />
English.<br />
• People from lower socio economic<br />
backgrounds.<br />
• Graduates and people with a disability.<br />
With representation in every state of<br />
Australia, IOOF has 984 employees with<br />
female employees representing 53% of<br />
total employees. Of a leadership group of<br />
nine, two are female. IOOF also has one<br />
female at Board level.<br />
In addition, throughout the period a<br />
number of graduates were recruited<br />
with mentoring programs partnering<br />
these appointments. IOOF strives to be<br />
an Employer of Choice by encouraging<br />
workplace diversity, work/life balance<br />
and a satisfying learning environment<br />
to achieve personal and professional<br />
growth.<br />
IOOF is a member of the Diversity Council<br />
of Australia.<br />
Commitment to balance<br />
To assist our people in reaching an<br />
appropriate balance between work and<br />
family we offer a range of programs<br />
and services to all employees. Policies<br />
include Purchased Leave (48/52), flexible<br />
working hours, part-time employment,<br />
community leave, the workplace giving<br />
program, and eight weeks paid parental<br />
leave.<br />
The IOOF iHealth program continues to<br />
receive a positive response and a high<br />
level of attendance by employees. The<br />
program is fully funded by the company<br />
and includes flu vaccinations, skin cancer<br />
checks, healthy heart checks, cholesterol<br />
checks and fitness challenges. Each<br />
program is conducted in the office<br />
during office hours. Therefore, there is<br />
no requirement for employees to take<br />
personal leave or erode their family<br />
time to otherwise attend to a particular<br />
program outside of work hours.<br />
Employee focus groups and<br />
communication surveys encourage the<br />
communication of ideas by employees<br />
to assist in the overall improvement<br />
of the company. The data collected<br />
has provided IOOF with a guideline to<br />
develop and implement HR initiatives<br />
that will further improve our level of<br />
engagement and add to the retention<br />
and attraction strategy of the company.<br />
Ensuring the safety and welfare of our<br />
employees is a commitment we follow<br />
through with Occupational Health and<br />
Safety initiatives and a confidential<br />
employee assistance program.<br />
Development of our<br />
people<br />
Equipping our people with the tools,<br />
knowledge and skills to stay competitive<br />
is an easy investment in our future<br />
success. Promoting career development<br />
and self-learning benefits the company<br />
through increased productivity and<br />
retention of staff. Investment in this area<br />
adds to the value proposition of working<br />
at IOOF.<br />
All employees are encouraged to set<br />
personal development plans with their<br />
managers and to undertake training that<br />
is appropriate for their role and future<br />
career.<br />
IOOF and the environment<br />
The efficient use of resources makes good<br />
business sense, which is why IOOF is<br />
committed to improving our efforts with<br />
the environment.<br />
In <strong>2011</strong>, environmental initiatives<br />
undertaken by IOOF included:<br />
• Continued participation in Earth<br />
Hour, which calls on businesses and<br />
individuals to switch off unnecessary<br />
lights.<br />
• IOOF continued to focus on lowering<br />
energy and paper usage.<br />
• Sydney and Melbourne offices<br />
operate a paper and comingled waste<br />
recycling service, with paper recycling<br />
in other state offices.<br />
• Water saving devices installed in<br />
Sydney and Melbourne offices.<br />
Reducing the amount of office space we<br />
require to operate as part of our Business<br />
Simplification Program has the added<br />
benefit of lowering IOOF’s total carbon<br />
footprint and energy use.<br />
page 18
IOOF | <strong>annual</strong> <strong>report</strong> <strong>2011</strong><br />
IOOF supporting the community<br />
Established as a not for profit organisation<br />
in June 2002, at the time of IOOF’s<br />
demutualisation, the IOOF Foundation<br />
recognises the historical origins of IOOF<br />
and the important role it has played in<br />
the Australian community since 1846.<br />
The IOOF Foundation takes its role as the<br />
charity vehicle for the IOOF Group very<br />
seriously and is dedicated to making an<br />
ongoing commitment to the community<br />
in which we live. The Foundation achieves<br />
this by allocation of time and effort to<br />
research potential grant recipients and<br />
providing grants in line with our grant<br />
policy that supports Australian<br />
not-for-profit organisations that work<br />
in the following areas:<br />
• Disadvantaged families.<br />
• Aged care.<br />
• Disadvantaged children and youth.<br />
When established the IOOF Foundation<br />
received nearly two million shares in<br />
IOOF Holdings to fund its activities, the<br />
Foundation has now gifted over $7m to<br />
over 125 organisations. In 2010-<strong>2011</strong> an<br />
incredible $1,820,170 was granted to<br />
not-for-profit organisations.<br />
Total funds distributed since 2002<br />
Disadvantaged families $ 3,208,096<br />
Aged care $ 1,578,734<br />
Disadvantaged<br />
$ 2,376,525<br />
children & youth<br />
Total $ 7,163,355<br />
2010 – <strong>2011</strong> Grant recipients<br />
Aboriginal Literacy Foundation<br />
The Aboriginal literacy Foundation<br />
provide a range of literacy programs for<br />
disadvantaged and isolated indigenous<br />
children.<br />
Grant $15,000<br />
Bell Shakespeare<br />
Bell Shakespeare National Community<br />
Access Programme seeks to engage<br />
disadvantaged students of all ages and<br />
adults in their education and theatre<br />
programmes.<br />
Grant $50,000<br />
Berry Street<br />
Berry Street’s challenge is to help children<br />
and young people recover from the<br />
devastating impact of family violence,<br />
abuse and neglect.<br />
Grant $38,000<br />
Big Brothers Big Sisters<br />
Big Brothers Big Sisters is a leading long<br />
term mentoring program for vulnerable<br />
young people, in <strong>2011</strong> IOOF are<br />
supporting the eLearning program.<br />
Grant $20,000<br />
Epilepsy Action Australia<br />
Epilepsy Action Australia (EAA) is the<br />
largest epilepsy education and support<br />
service provider for people with epilepsy<br />
and other seizure disorders.<br />
Grant $35,900<br />
Frontier Services<br />
Frontier Services works with people<br />
across 85 per cent of the continent,<br />
in remote areas, with Aboriginal<br />
communities, on isolated properties and<br />
mining sites. The IOOF Foundation grant<br />
will replace eight electric beds at the Old<br />
Timers Home.<br />
Grant $20,800<br />
Good Shepherd Youth & Family<br />
Service<br />
Good Shepherd Youth & Family Service is<br />
a non-profit organisation that has worked<br />
with people to overcome disadvantage<br />
since 1976. IOOF Foundation support the<br />
Drivers Education Program.<br />
Grant $50,000<br />
Reclink<br />
Reclink Australia’s mission is to provide<br />
sport and arts activities to enhance<br />
the lives of people experiencing<br />
disadvantage. The IOOF Foundation<br />
support a range of structured and<br />
informal programs and activities.<br />
Grant $490,000<br />
page 19
IOOF | <strong>annual</strong> <strong>report</strong> <strong>2011</strong><br />
Redkite<br />
Providing real support to children, young<br />
people and their families through cancer<br />
is Redkite’s focus. IOOF Foundation<br />
supports Redkite’s Financial Assistance<br />
Program.<br />
Grant $75,000<br />
Rural Health Education Program<br />
The IOOF Foundation has supported<br />
the Rural Health Education Foundation’s<br />
Improving Indigenous Eye Health project.<br />
Grant $50,000<br />
The Infants Home<br />
The Infants Home provide early<br />
childhood education, early intervention,<br />
and family support services to children<br />
from birth to school age. The IOOF<br />
support the Home-2-School Project.<br />
Grant $52,200<br />
Wesley Mission<br />
Wesley Mission was established in<br />
response to the severe economic<br />
depression and associated poverty. IOOF<br />
Foundation supports the Education-Care<br />
Links.<br />
Grant $110,000<br />
Whitelion<br />
Whitelion supports youth at risk, by<br />
building relationships and creating<br />
opportunities, IOOF support the Young<br />
Women’s Support Service.<br />
Grant $40,000<br />
Additionally, during 2010-11 the IOOF<br />
Foundation made grants to support the<br />
activities of a number of very worthy<br />
Australian organisations. These included:<br />
$<br />
• Brunswick Special School 30,000<br />
• Eloura 37,190<br />
• Flinders Medical Centre 27,500<br />
• Kidney Health Australia 52,000<br />
• Neerim Health 16,000<br />
• Pathways 30,000<br />
• Robinson House 80,000<br />
• St Albans Community Support 2,460<br />
• St Kilda Youth Services 50,000<br />
• The Immigrant Women’s 15,000<br />
• The Mirabel Foundation 35,000<br />
• The Song Room 66,000<br />
• The Royal Womens 33,313<br />
• Urban Seed 91,307<br />
• Vision Australia 22,500<br />
• Yooralla 50,000<br />
• Zoos Victoria 35,000<br />
The IOOF Foundation Board of Trustees<br />
will continue to meet regularly to<br />
review applications, approve further<br />
rounds of grants and to ensure that the<br />
Foundation’s critical community work is<br />
continued into the future.<br />
Wintringham<br />
Wintringham provides an extensive range<br />
of services to elderly homeless men and<br />
women and has done so since 1989. IOOF<br />
supported a recent housing site fit-out.<br />
Grant $100,000<br />
If you are interested in making a donation to the IOOF Foundation or would<br />
like further information on the foundation’s ongoing work, visit the website<br />
www.iooffoundation.org.au<br />
page 20
IOOF | <strong>annual</strong> <strong>report</strong> <strong>2011</strong><br />
Financial <strong>report</strong> for the year<br />
ended 30 June <strong>2011</strong><br />
Contents<br />
Directors’ <strong>report</strong> 22<br />
Remuneration <strong>report</strong> 28<br />
Directors’ declaration 45<br />
Independence declaration 46<br />
Independent auditor’s <strong>report</strong> 47<br />
Statement of comprehensive income 49<br />
Statement of financial position 50<br />
Statement of changes in equity 51<br />
Statement of cash flows 53<br />
Notes to the financial statements 54<br />
Shareholder information 114<br />
Corporate directory 116<br />
page 21
IOOF | <strong>annual</strong> <strong>report</strong> <strong>2011</strong><br />
Directors’ <strong>report</strong><br />
The Directors present their <strong>report</strong> together with the financial<br />
<strong>report</strong> of IOOF Holdings Ltd (the “Company” or “Parent”) and<br />
of the Group, being the Company and its subsidiaries and the<br />
Group’s interest in associates and jointly controlled entities for<br />
the financial year ended 30 June <strong>2011</strong> and the auditor’s <strong>report</strong><br />
thereon.<br />
Directors<br />
The Directors of the Company during or since the end of the<br />
financial year are:<br />
Name<br />
Mr Ian Blair (Chairman)<br />
Mr Christopher Kelaher (Managing Director)<br />
Mr Ian Griffiths<br />
Ms Jane Harvey<br />
Mr James Pfeiffer (retired 30 June <strong>2011</strong>)<br />
Dr Roger Sexton<br />
Mr George Venardos<br />
All Directors held office during and since the end of the<br />
financial year, unless otherwise noted.<br />
Principal activities<br />
The principal continuing activities of the Group during the<br />
financial year consisted of:<br />
• Financial advice and distribution.<br />
• Platform management and superannuation administration.<br />
• Investment management.<br />
• Trustee services including estate planning and<br />
corporate trust.<br />
Review of operations<br />
In accordance with current Australian accounting standards,<br />
the audited financial results of the benefit funds of IOOF<br />
Ltd are included in the consolidated results of the Group.<br />
The inclusion of the benefit funds has a minimal impact on<br />
the profit for the year, but results in offsetting pre-tax profit<br />
and income tax amounts not available to shareholders. The<br />
following table provides a reconciliation between the <strong>report</strong>ed<br />
results of the Group and underlying net profit after tax<br />
(UNPAT) pre-amortisation, with the results of the benefit funds<br />
excluded. In calculating its UNPAT pre amortisation, the Group<br />
reverses the impact on profit of certain, predominantly<br />
non cash, items to enable a better understanding of its<br />
operational result.<br />
Shareholders can receive the more detailed results<br />
presentation by visiting the Company website at<br />
www.ioof.com.au<br />
Note <strong>2011</strong><br />
$’000<br />
Profit attributable to owners of the Company 99,489 77,371<br />
Underlying net profit after tax pre-amortisation (UNPAT) adjustments:<br />
Reverse the impact of:<br />
Amortisation of intangible assets 9 17,980 17,905<br />
Termination payments 9 1,296 7,874<br />
Retention incentive payments 9 208 945<br />
Onerous lease contract expense 9 - 3,082<br />
Amortisation of deferred tax liability recorded on intangible assets 11 (2,966) (3,822)<br />
Profit on disposal of Macarthur Cook investments (inc tax effect) - (1,745)<br />
Profit on life policy transfer 8 (220) -<br />
Reinstatement of Perennial non-controlling interests (3,952) (1,755)<br />
Income tax attributable (385) (2,689)<br />
Underlying net profit after tax (UNPAT) pre-amortisation 111,450 97,166<br />
2010<br />
$’000<br />
The Group’s Funds Under Management, Administration and Supervision (FUMAS) were $106.3 billion as at 30 June <strong>2011</strong>, an increase<br />
of $7.2 billion, from $99.1 billion at 30 June 2010. This movement is primarily a result of increases in the market value of the assets<br />
underpinning FUMAS and positive flows to the Group’s actively marketed products.<br />
Basic earnings per share increased from 33.7 cents per share in the year to 30 June 2010 to 43.1 cents per share for the year to<br />
30 June <strong>2011</strong>.<br />
page 22
IOOF | <strong>annual</strong> <strong>report</strong> <strong>2011</strong><br />
Shareholder returns<br />
<strong>2011</strong> 2010 2009 2008 2007<br />
Profit attributable to owners of the Company ($’000s) * 99,489 77,371 9,044 24,286 26,476<br />
Basic EPS (cents per share) * 43.1 33.7 7.4 35.6 41.5<br />
Diluted EPS (cents per share) * 42.9 33.6 7.3 35.1 40.8<br />
UNPAT 93,470 79,261 49,100 25,900 29,300<br />
UNPAT EPS (cents per share) 40.5 34.5 21.4 37.9 46.8<br />
Dividends paid ($’000s) 89,935 78,197 10,350 22,763 19,153<br />
Dividends per share (cents per share) 39.0 34.0 15.0 33.0 30.0<br />
Share price at start of year $5.99 $4.04 $5.10 $10.19 $8.50<br />
Share price at end of year $6.60 $5.99 $4.04 $5.10 $10.19<br />
UNPAT pre-amortisation 111,450 97,166 59,900 27,400 29,300<br />
Return on equity (non-statutory measure) 12.9% 11.4% 11.3% 14.1% 16.8%<br />
* Profit attributable to owners of the Company for 2007 to <strong>2011</strong> have been calculated in accordance with Australian Accounting Standards (AASBs). These include<br />
restatement for the change in accounting policy for recognition of revaluation adjustments of Perennial share buy-back liabilities to reserves rather than profit or loss.<br />
Returns to shareholders increase through both dividends and capital growth. Dividends for <strong>2011</strong> and prior years were fully franked.<br />
Dividends<br />
In respect of the financial year ended 30 June <strong>2011</strong>, the<br />
Directors declared the payment of a final dividend of 22.0<br />
cents per share franked to 100% at 30% corporate income tax<br />
rate to the holders of fully paid ordinary shares to be paid on<br />
20 October <strong>2011</strong>. The dividend will be paid to all shareholders<br />
recorded on the Register of members on 7 September <strong>2011</strong>.<br />
The Directors declared the payment of an interim dividend of<br />
21.0 cents per share franked to 100% at 30% corporate income<br />
tax rate to the holders of fully paid ordinary shares paid on 23<br />
March <strong>2011</strong>.<br />
In respect of the financial year ended 30 June 2010, a final<br />
dividend of 18.0 cents per share franked to 100% at 30%<br />
corporate income tax rate was paid to the holders of fully paid<br />
ordinary shares on 13 October 2010.<br />
Future developments<br />
The Directors are continuing to examine further growth<br />
strategies to maximise shareholder wealth. The Directors<br />
believe, on reasonable grounds, that to include further<br />
information, other than as disclosed below in events occurring<br />
after balance sheet date, and the expected results of those<br />
operations in subsequent financial years would be likely to<br />
result in unreasonable prejudice to the Group. Accordingly, no<br />
further information has been included in this <strong>report</strong>.<br />
Events occurring after balance sheet date<br />
The Directors have declared the payment of a final dividend<br />
of 22.0 cents per ordinary share franked to 100% based on tax<br />
paid at 30%, to be paid in October <strong>2011</strong>.<br />
On 27 June <strong>2011</strong>, the Company announced that the Company<br />
and Deakin Financial Group (DKN) had entered into an<br />
agreement under which the Company, through a wholly<br />
owned subsidiary, proposes to acquire DKN via a scheme of<br />
arrangement. The arrangement to acquire 100% of shares<br />
not already owned by the Group for $0.80 cash is subject to<br />
DKN shareholder approval and as a result, no amounts have<br />
been recognised in the profit or loss or financial position of<br />
the Group at balance date. If accepted, the total consideration<br />
payable to shareholders is estimated at $94 million.<br />
The funds to be provided by the Company will be sourced<br />
from existing cash reserves and an undrawn facility<br />
arrangement with the Commonwealth Bank of Australia (CBA)<br />
(Loan Facility). The Company and the CBA have entered into a<br />
loan commitment letter and term sheet in relation to the Loan<br />
Facility. Under the Loan Facility, CBA has agreed to provide<br />
funding up to $75 million for the purpose of the Company<br />
satisfying the Group’s obligations under the Scheme (including<br />
the payment of the aggregate scheme consideration).<br />
The right of the Company to access funds under the Loan<br />
Facility is subject to certain conditions which will need<br />
to be satisfied or waived by CBA. The interest and<br />
establishment costs associated with the Loan Facility are<br />
on commercial terms.<br />
page 23
IOOF | <strong>annual</strong> <strong>report</strong> <strong>2011</strong><br />
Directors’ <strong>report</strong> (cont’d)<br />
The Directors are not aware of any other matter or<br />
circumstance not otherwise dealt with in this <strong>report</strong>, or the<br />
accompanying financial statements and notes thereto, that has<br />
arisen since 30 June <strong>2011</strong> that has significantly affected, or may<br />
significantly affect:<br />
a the Group’s operations in future financial years,<br />
b the results of those operations in future financial years, or<br />
a the Group’s state of affairs in future financial years.<br />
Environmental regulation<br />
The Group is not subject to significant environmental<br />
regulation.<br />
Non-audit services<br />
The directors are satisfied that the provision of non-audit<br />
services, during the year, by the auditor (or by another person<br />
or firm on the auditor’s behalf) is compatible with the general<br />
standard of independence for auditors imposed by the<br />
Corporations Act 2001.<br />
• fees earned from non-audit work undertaken by KPMG are<br />
capped at 1.0 times the total audit fee;<br />
• all non-audit services have been reviewed and approved to<br />
ensure that they do not impact the integrity and objectivity<br />
of the auditor; and<br />
• none of the services undermine the general principles<br />
relating to auditor independence as set out in Code<br />
of Conduct APES 110 Code of Ethics for Professional<br />
Accountants issued by the Accounting Professional &<br />
Ethical Standards Board, including reviewing or auditing the<br />
auditor’s own work, acting in a management or decisionmaking<br />
capacity for the Company, acting as advocate for<br />
the Company or jointly sharing economic risks and rewards.<br />
Amount paid/payable<br />
Non-audit service <strong>2011</strong> $ 2010 $<br />
Taxation services 332,880 446,680<br />
Consultancy services 87,292 51,772<br />
Total 420,172 498,452<br />
Lead auditor’s independence declaration<br />
The lead auditor’s independence declaration is included on<br />
page 45 of the Annual Report and forms part of the Directors’<br />
Report for the financial year ended 30 June <strong>2011</strong>.<br />
Rounding off of amounts<br />
The Company is a company of the kind referred to in ASIC<br />
Class Order 98/100, dated 10 July 1998, and in accordance with<br />
that Class Order amounts in the Annual Financial Report are<br />
rounded off to the nearest thousand dollars, unless otherwise<br />
indicated. The amounts disclosed in the Directors’ Report (with<br />
the exception of the Remuneration Report) are rounded off to<br />
the nearest thousand dollars but expressed in whole dollars,<br />
unless otherwise indicated.<br />
Information on Directors<br />
Mr I Blair OAM, MMgt, FCA.<br />
Chairman - Non-Executive Director. Age 64.<br />
Experience and expertise<br />
• Non-Executive Director of IOOF Holdings Ltd since 2002.<br />
• Extensive experience in the fields of finance, accounting,<br />
audit and taxation with accounting firm Deloitte Touche<br />
Tohmatsu. Responsible for management of Deloitte as<br />
Managing Partner and CEO between 1989 and 1997.<br />
Other current directorships<br />
• Capral Ltd (Director since 2006).<br />
Special responsibilities<br />
• Group Chairman of IOOF Holdings Ltd since 2005.<br />
• Ex officio Status of all Board Committees.<br />
• Chairman of the Remuneration and Nominations<br />
Committee.<br />
Shares in IOOF Holdings Ltd (as at the date of<br />
this <strong>report</strong>)<br />
• 9,677 ordinary shares held directly.<br />
• 25,412 ordinary shares held indirectly.<br />
Dr R Sexton AM B.Ec. (Hons), M.Ec. Ph.D (Econ), FAICD, FAIM.<br />
SFFin, C. P Mgr, C.Univ<br />
Deputy Chairman - Non-Executive Director. Age 61.<br />
Experience and expertise<br />
• Non-Executive Director of IOOF Holdings Ltd since 2002.<br />
• Over twenty years experience in senior management<br />
in finance and the investment banking industry and a<br />
specialist in the areas of corporate reconstruction, mergers<br />
and acquisitions, and asset management. Dr Sexton is also a<br />
member of the Australian Accounting Standards Board.<br />
page 24
IOOF | <strong>annual</strong> <strong>report</strong> <strong>2011</strong><br />
Other current directorships<br />
• TWT Group Limited (Director since 2008).<br />
Former directorships in the last 3 years<br />
• Yanghao International Limited (Chairman from 2008 - <strong>2011</strong>).<br />
Special responsibilities<br />
• Member of the Remuneration and Nominations<br />
Committee.<br />
• Member of the Audit Committee.<br />
Shares in IOOF Holdings Ltd (as at the date of<br />
this <strong>report</strong>)<br />
• 22,313 ordinary shares held directly.<br />
• 19,666 ordinary shares held indirectly.<br />
Mr C Kelaher B.Ec, LL.B, F Fin.<br />
Managing Director. Age 56.<br />
Experience and expertise<br />
• Managing Director of IOOF Holdings Ltd and antecedent<br />
companies Australian Wealth Management Ltd and Select<br />
Managed Funds Ltd since 1997.<br />
• More than 20 years experience in investment management<br />
and business development. Mr Kelaher was responsible<br />
for business management, strategic marketing and sales<br />
growth in Australia at Citicorp. He also performed an<br />
important role in the establishment of Citicorp Investment<br />
Management/Global Asset Management in Australia and<br />
establishing its New Zealand business.<br />
Other current directorships<br />
• DKN Financial Group Ltd (Director since 2004).<br />
Former directorships in the last 3 years<br />
• Australian Wealth Management Limited (Managing Director<br />
from 2006 to 2009).<br />
Special responsibilities<br />
• Managing Director of the IOOF Group from 30 April 2009.<br />
Shares in IOOF Holdings Ltd (as at the date of<br />
this <strong>report</strong>)<br />
• 4,244,818 ordinary shares held directly.<br />
Mr I Griffiths C.Acc, DipAll, FAICD.<br />
Non-Executive Director. Age 57.<br />
Experience and expertise<br />
• Non-executive Director of IOOF Holdings Ltd since April<br />
2009.<br />
• More than 30 years experience in the financial and<br />
superannuation industries. A superannuation administration<br />
and business consulting career commencing with AMP<br />
in 1972. He has extensive industry knowledge and skills,<br />
particularly in operations, mergers and acquisitions.<br />
Former directorships in last 3 years<br />
• Australian Wealth Management Limited (Director from 2006<br />
to 2009).<br />
Special responsibilities<br />
• Member of the Remuneration and Nominations<br />
Committee.<br />
• Member of the Audit Committee.<br />
Shares in IOOF Holdings Ltd (as at the date of<br />
this <strong>report</strong>)<br />
• 4,280,280 ordinary shares held directly.<br />
Ms J Harvey B.Com, MBA, FCA, FAICD.<br />
Independent Non-Executive Director. Age 56.<br />
Experience and expertise<br />
• Non-executive Director of IOOF Holdings Ltd since 2005.<br />
• More than 30 years experience in financial and advisory<br />
services, governance and risk management. Ms Harvey is a<br />
member of the Australian Institute of Company Directors<br />
Reporting Working Party and was formerly a Partner at<br />
PricewaterhouseCoopers.<br />
Former directorships in last 3yrs<br />
• Boom Logistics Limited (Director from 2005 to 2009).<br />
Special responsibilities<br />
• Chairman of the Audit Committee.<br />
• Member of the Risk and Compliance Committee.<br />
Shares in IOOF Holdings Ltd (as at the date of<br />
this <strong>report</strong>)<br />
• 10,567 ordinary shares held indirectly.<br />
page 25
IOOF | <strong>annual</strong> <strong>report</strong> <strong>2011</strong><br />
Directors’ <strong>report</strong> (cont’d)<br />
Mr J Pfeiffer BA, LLB.<br />
Independent Non-Executive Director. Age 64.<br />
Experience and expertise<br />
• Non-Executive Director of IOOF Holdings Ltd since 2005.<br />
• Experience in both corporate governance and risk<br />
management. Former Partner of Freehills for 25 years<br />
practising in the areas of corporate/commercial law.<br />
Special responsibilities<br />
• Member of the Risk and Compliance Committee.<br />
• Member of the Audit Committee.<br />
Shares in IOOF Holdings Ltd (as at the date of<br />
this <strong>report</strong>)<br />
• 32,796 ordinary shares held indirectly.<br />
Mr G Venardos BComm, FCA, FCIS, FAICD, FTIA.<br />
Independent Non-Executive Director. Age 53.<br />
Experience and expertise<br />
• Non-Executive Director of IOOF Holdings Ltd since April<br />
2009.<br />
• More than thirty years experience in financial services<br />
with senior executive experience in finance, IT, funds<br />
management, reinsurance and corporate services. His<br />
former roles include that of Group Chief Financial Officer<br />
of Insurance Australia Group Ltd (from 1998 to 2008),<br />
Chairman Finance and Accounting Committee of The<br />
Insurance Council of Australia (from 1998 to 2008) and<br />
Group Director of Finance of Legal and General Australia<br />
(from 1986 to 1998).<br />
Other current directorships<br />
• Bluglass Ltd (Non-executive Chairman from 2008).<br />
• Ardent Leisure Group Ltd (Director from 2009).<br />
Former directorships in last 3yrs<br />
• Director of Australian Wealth Management Limited (from<br />
2008 to April 2009).<br />
• Director of IAG Finance (New Zealand) Ltd (from 2004 to<br />
2008).<br />
Special responsibilities<br />
• Chairman of the Risk and Compliance Committee.<br />
• Member of the Remuneration and Nominations<br />
Committee.<br />
Shares in IOOF Holdings Ltd (as at the date of<br />
this <strong>report</strong>)<br />
• 20,013 ordinary shares held directly.<br />
Company secretary<br />
Ms Danielle Corcoran was appointed to the position of<br />
Company Secretary on 14 May 2009. Ms Corcoran previously<br />
held the position of Company Secretary of Australian Wealth<br />
Management Limited prior to its acquisition by the Company<br />
and prior to that she held similar positions with other listed<br />
companies. Ms Corcoran is also Head of Human Resources for<br />
the Group.<br />
Directors’ meetings<br />
Director Directors Meetings Committee Meetings<br />
Remuneration Committee Audit Committee Risk and Compliance<br />
Committee<br />
Meetings<br />
held<br />
Meetings<br />
attended<br />
Meetings<br />
held<br />
Meetings<br />
attended<br />
Meetings<br />
held<br />
Meetings<br />
attended<br />
Meetings<br />
held<br />
Meetings<br />
attended<br />
I Blair 14 14 5 5 n/a n/a n/a n/a<br />
R Sexton 14 12 5 5 5 4 n/a n/a<br />
I Griffiths 14 13 5 5 5 5 n/a n/a<br />
J Harvey 14 13 n/a n/a 5 5 3 3<br />
C Kelaher 14 14 n/a n/a n/a n/a n/a n/a<br />
J Pfeiffer 14 12 n/a n/a 5 4 3 2<br />
G Venardos 14 13 5 5 n/a n/a 3 3<br />
page 26
IOOF | <strong>annual</strong> <strong>report</strong> <strong>2011</strong><br />
Unexercised options over shares, performance rights and deferred shares<br />
At the date of this <strong>report</strong> unexercised options over shares of the Company under option, deferral arrangements and<br />
performance rights are:<br />
Options Performance rights Deferred shares<br />
Expiry<br />
date<br />
Number of<br />
options<br />
Exercise price<br />
per option $<br />
Vesting<br />
date<br />
Number<br />
of rights<br />
Vesting<br />
date<br />
Number of<br />
shares<br />
27 Nov 11 675,000 9.89 1 Dec 11 41,614 1 Jul 12 55,813<br />
30 Nov 11 134,048 5.52 30 Jun 12 121,313 55,813<br />
2 Aug 12 75,000 3.15 31 Jul 12 2,500<br />
22 Nov 12 134,048 9.99 27 Nov 12 75,000<br />
30 Jun 13 339,122 9.36 1 Dec 12 32,970<br />
2 Aug 13 150,000 5.68 30 Jun 13 5,000<br />
15 Feb 14 53,619 2.98 31 Jul 13 1,250<br />
16 Jun 14 26,809 3.73 23 Nov 13 75,000<br />
2 Aug 14 150,000 7.40 27 Nov 13 37,500<br />
30 Jun 15 1,925,000 6.14 1 Jul 14 75,000<br />
27 Nov 15 316,624 5.20 23 Nov 14 37,500<br />
4 May 16 500,000 7.01 27 Nov 14 37,500<br />
23 Nov 16 300,000 6.93 1 Jul 15 37,500<br />
1 Jul 17 300,000 6.81 23 Nov 15 37,500<br />
5,079,270 1 Jul 16 37,500<br />
654,647<br />
The Board has the discretion to either purchase shares on market<br />
or to issue new shares. Shares allocated on vesting will rank<br />
equally with all other ordinary shares on issue.<br />
All options expire on the earlier of their expiry date or termination<br />
of the employee’s employment. In addition, the ability to exercise<br />
options is conditional on service and performance hurdles as<br />
detailed in section 6 of the Remuneration Report.<br />
These options, performance rights and deferred shares do<br />
not entitle the holder to participate in any share issue of the<br />
Company or any other body corporate.<br />
Indemnification and insurance<br />
Rule 84 of the IOOF Holdings Ltd Constitution requires the<br />
Company to indemnify to the extent permitted by law, each<br />
Director and Secretary against liability incurred in, or arising out<br />
of the conduct of the business of the Company or the discharge<br />
of the duties of the Director or Secretary. The Directors and<br />
Secretary named in this Directors Report have the benefit of this<br />
requirement, as do individuals who formerly held one of those<br />
positions.<br />
In accordance with this requirement the Company has entered<br />
into Deeds of Access, Indemnity and Insurance (Deeds of<br />
Indemnity) with each Director. During the financial year, the<br />
IOOF Group paid insurance premiums to insure against amounts<br />
that the IOOF Group may be liable to pay the Directors, and<br />
Secretary pursuant to Rule 84. The insurance policy also insures<br />
the Directors and Secretary of the Company and its controlled<br />
entities, and the general officers of each of the companies in the<br />
Group. Details of the amount of the premium paid in respect<br />
of the insurance contract have not been disclosed as such<br />
disclosure is prohibited under the terms of the contract.<br />
The liabilities insured are legal costs that may be incurred in<br />
defending civil or criminal proceedings that may be brought<br />
against the officers in their capacity as officers of entities in the<br />
Group, and any other payments arising from liabilities incurred<br />
by the officers in connection with such proceedings, other<br />
than where such liabilities arise out of conduct involving a<br />
wilful breach of duty by the officers or the improper use by the<br />
officers of their position or of information to gain advantage<br />
to themselves or someone else or to cause detriment to the<br />
Company.<br />
Proceedings on behalf of the Company<br />
No person has applied to the court under section 237 of the<br />
Corporations Act 2001 for leave to bring proceedings on behalf<br />
of the Company, or to intervene in any proceedings to which the<br />
Company is a party, for the purpose of taking responsibility on<br />
behalf of the Company for all or part of those proceedings.<br />
No proceedings have been brought or intervened in on behalf<br />
of the Company with leave of the Court under section 237 of the<br />
Corporations Act 2001.<br />
page 27
IOOF | <strong>annual</strong> <strong>report</strong> <strong>2011</strong><br />
Remuneration <strong>report</strong><br />
1. Remuneration and Nominations Committee 29<br />
Committee members 29<br />
Role of the Committee 29<br />
2. Key management personnel 29<br />
3. Remuneration policies 30<br />
Executive remuneration 30<br />
Total fixed remuneration 30<br />
Short term incentive opportunity 30<br />
Deferred short term incentives 30<br />
Long term incentives 30<br />
Hedging of unvested securities 31<br />
4. Managing director’s remuneration 31<br />
Terms of appointment 31<br />
Remuneration 31<br />
Performance rights and share options 31<br />
Performance rights – performance hurdles 32<br />
Share options – performance hurdles 32<br />
Change of control and cessation of employment 33<br />
Remuneration for the Year Ended 30 June 2012 33<br />
5. Employment contracts 34<br />
6. Remuneration tables 35<br />
Remuneration components as a percentage of total remuneration 35<br />
Consequences of performance on shareholder wealth 36<br />
Share option component of total remuneration 37<br />
Options and performance rights over equity instruments granted as compensation 37<br />
Options granted since the end of the financial year 38<br />
Exercise of performance rights and options granted as compensation 38<br />
Short Term Incentive (STI) and Long Term Incentive (LTI) equity allocations 38<br />
Analysis of movements in deferred shares 39<br />
Analysis of movements in performance rights 39<br />
Analysis of movements in options 40<br />
7. Non-executive directors’ remuneration 42<br />
Approval of funding for the remuneration 42<br />
Objectives 42<br />
Equity participation 42<br />
Retirement benefits 42<br />
Terms of appointment 43<br />
Remuneration table 43<br />
8. Payments to persons before taking office 44<br />
page 28
IOOF | <strong>annual</strong> <strong>report</strong> <strong>2011</strong><br />
1. Remuneration and Nominations Committee<br />
Committee members<br />
Mr Ian Blair (Chairman)<br />
Mr Ian Griffiths<br />
Mr George Venardos<br />
Dr Roger Sexton<br />
Role of the Committee<br />
The role of the Remuneration and Nominations Committee is to ensure that a coherent reward<br />
framework is in place within the Group. This framework considers the adequacy of remuneration<br />
policy and practices and includes:<br />
a Determination of Managing Director and Senior Executive remuneration arrangements;<br />
b Remuneration policy and structures applicable to Non-Executive Directors;<br />
c Ensuring that succession planning and development plans are in place for Senior Executives;<br />
d On-going review and monitoring of short term and long term incentive schemes;<br />
e Assessment of Managing Directors’ performance against company performance;<br />
f Industrial agreements and the overall compensation arrangements of the Group; and<br />
g Ongoing review of the composition, skill base and performance of the Non-executive<br />
Director component of the Board.<br />
2. Key management personnel<br />
The purpose of the remuneration <strong>report</strong> is to set out the remuneration arrangements for Key Management Personnel (KMP) and the<br />
five most highly paid senior executives of the Group in accordance with AASB 124 Related Party Disclosures and section 300A of the<br />
Corporations Act 2001.<br />
The information provided in this remuneration <strong>report</strong> has been audited as required by section 308(3C) of the Corporations Act 2001<br />
unless otherwise stated.<br />
Name<br />
Position<br />
Non-Executive Directors<br />
Mr Ian Blair<br />
Chairman<br />
Mr Ian Griffiths<br />
Non-Executive Director<br />
Ms Jane Harvey<br />
Non-Executive Director<br />
Mr James Pfeiffer Non-Executive Director (retired 30 June <strong>2011</strong>)<br />
Dr Roger Sexton<br />
Non-Executive Director<br />
Mr George Venardos<br />
Non-Executive Director<br />
Executive Director<br />
Mr Christopher Kelaher<br />
Managing Director<br />
Senior Executives<br />
Mr Stuart Abley<br />
Head of Consultum Financial Services<br />
Mr Michael Carter<br />
Head of Advice Division<br />
Mr David Coulter<br />
Chief Financial Officer<br />
Mr Stephen Merlicek<br />
Chief Investment Officer<br />
Mr Renato Mota<br />
General Manager Distribution<br />
Mr Gary Riordan<br />
Group General Counsel & General Manager Trustee Services<br />
Other Specified Executives (1)<br />
Mr Anthony Patterson<br />
Managing Director – Perennial Investment Partners Ltd<br />
Mr Karl Morris<br />
Executive Chairman of Ord Minnett Group (70% owned subsidiary)<br />
Mr Tim Gunning<br />
Chief Executive Officer of Ord Minnett Group (70% owned subsidiary)<br />
(1) Remuneration <strong>report</strong> disclosures include key management personnel and the five most highly remunerated executives. Other specified executives, as set out in the<br />
table above, are not considered key management personnel. Accordingly these employees have not been included in key management personnel disclosures in<br />
note 33 of the financial <strong>report</strong>.<br />
page 29
IOOF | <strong>annual</strong> <strong>report</strong> <strong>2011</strong><br />
Remuneration <strong>report</strong> (cont’d)<br />
3. Remuneration policies<br />
The objective of these policies is to attract and retain<br />
high calibre talent and to provide both ‘fixed’ and ‘at risk’<br />
remuneration arrangements that reflect their contribution to<br />
the performance of the Company and take into account market<br />
benchmarks and the pay environment, under the direction of<br />
the Remuneration and Nominations Committee, or in the case<br />
of Ord Minnett and Perennial, the separately constituted boards<br />
of these companies.<br />
The Remuneration Committee engages external and<br />
independent remuneration consultants from time to time<br />
to perform reviews and benchmarking exercises to assess<br />
remuneration levels paid to Directors (both Executive and Non-<br />
Executive) and Senior Executives to ensure that the Company<br />
remains competitive with relevant competitors in the financial<br />
services sector, and the broader spectrum of public companies<br />
of similar size, revenue and profitability. Remuneration policies<br />
and arrangements are also reviewed and, where appropriate,<br />
updated to reflect relevant changes in legislation and regulation.<br />
Executive remuneration<br />
Executive remuneration includes a number of components<br />
including total fixed remuneration (TFR), short term incentive<br />
(STI) opportunity, deferred STI (for the Managing Director)<br />
and long term incentives (LTI) in the form of deferred shares,<br />
performance rights and options over ordinary shares. Each of<br />
these forms of remuneration is described in detail below.<br />
Total fixed remuneration<br />
TFR includes a combination of base salary, superannuation<br />
and other fringe benefits that an individual employee could<br />
choose to salary sacrifice (e.g., superannuation, motor vehicle).<br />
TFR is based on what is appropriate to the position, taking into<br />
consideration expertise, accountability, knowledge, experience,<br />
job environment, independence and market competitiveness.<br />
Short term incentive opportunity<br />
The STI is a cash-based incentive forming part of the executive’s<br />
Total Incentive Compensation opportunity, the value of which<br />
is tied to the successful achievement of a set of performance<br />
scorecard objectives (including financial and strategic<br />
objectives) for the <strong>annual</strong> performance period. Select individuals<br />
also had a deferred component to their STI incentive (detailed<br />
further below). STI opportunities vary for each individual. For<br />
the Managing Director, the maximum STI is around 70% of<br />
base salary. The other executives’ maximum STI opportunity is<br />
30% with the exception of Mr Merlicek who has up to 100% if<br />
additional Key Performance Indicators (KPIs) on the performance<br />
of the investment management business are satisfied.<br />
Goals for each participant are drawn from the following<br />
categories:<br />
• Financial measures<br />
Performance measures include Underlying Profit After tax,<br />
Total Shareholder Return and Return on Equity.<br />
• Business excellence<br />
Performance measures for the year ended 30 June <strong>2011</strong><br />
included operational targets such as long-term structural<br />
reductions to the cost base of the Group, balance sheet and<br />
liquidity initiatives and improvements to the performance of<br />
business units.<br />
• Strategy<br />
Implementation of specific longer-term strategic initiatives<br />
including platform consolidation and product rationalisation.<br />
Deferred short term incentives<br />
The deferred element of Managing Director’s Chris Kelaher’s<br />
remuneration is described in detail in the next section of this<br />
<strong>report</strong>.<br />
Long term incentives<br />
The Board considers a long term performance-related incentive<br />
component to be an important element of the executive reward<br />
framework. IOOF utilises equity based incentives in the form of<br />
deferred shares, performance rights and options over ordinary<br />
shares. The purpose of equity based remuneration is to:<br />
• drive medium to long term performance outcomes;<br />
• link the interest of senior management to those of<br />
shareholders;<br />
• provide competitive rewards to attract and retain employees;<br />
• strengthen the link between remuneration and performance;<br />
and<br />
• reward senior management for improvements in the Group’s<br />
performance when measured against a range of factors,<br />
including internal and external measures and measures<br />
against peers.<br />
Early vesting may occur in certain circumstances, subject to the<br />
performance hurdle being achieved:<br />
• On a person/entity acquiring more than 20% of the voting<br />
shares in the Company pursuant to a takeover bid that has<br />
become unconditional;<br />
• On the termination of employment due to death or<br />
permanent disability; or<br />
• In other circumstances where the Board determines<br />
appropriate. (Note: such discretion has never been exercised<br />
by the Board and would require exceptional circumstances).<br />
The LTI element of Managing Director’s Chris Kelaher’s<br />
remuneration is described in detail in the next section of this<br />
<strong>report</strong>.<br />
page 30
IOOF | <strong>annual</strong> <strong>report</strong> <strong>2011</strong><br />
Hedging of unvested securities<br />
The IOOF Securities and Insider Trading Policy contains a<br />
restriction on executives and other employees entering into a<br />
hedging transaction to remove the ‘at risk’ aspect of securities<br />
that have been granted to them as part of their remuneration<br />
package and which have not vested subject to performance<br />
conditions and/or which are still subject to forfeiture<br />
conditions. Employees are provided with a copy of this policy<br />
and are required to provide <strong>annual</strong> certification that they have<br />
complied with the policy. Failure to comply with the policy<br />
could result in disciplinary action, including forfeiture of the<br />
securities, suspension or termination of employment.<br />
4. Managing director’s remuneration<br />
Terms of appointment<br />
Mr Kelaher is employed under an unlimited duration service<br />
agreement. Under that agreement, Mr Kelaher receives fixed<br />
remuneration, a short term incentive component, and an<br />
equity-based long term incentive component, as discussed<br />
below. The fixed and short term incentive components of Mr<br />
Kelaher’s remuneration are subject to <strong>annual</strong> review by the<br />
Board. There are various performance and vesting conditions<br />
attached to the remuneration provided to Mr Kelaher under<br />
the terms of his agreement.<br />
Mr Kelaher can terminate his employment by giving IOOF<br />
three (3) months written notice. The Board can waive<br />
the requirement for him to serve out part or all of the<br />
notice period, although he would be entitled to the fixed<br />
remuneration for that portion of the notice period not served<br />
out. Any unvested incentives at the date of termination would<br />
lapse.<br />
The Company can terminate Mr Kelaher’s employment at<br />
any time by giving twelve (12) months’ written notice, or the<br />
Company can elect to make payment of fixed remuneration in<br />
lieu of part or all of the notice period that he is not required to<br />
serve out. The proportion (if any) of the short-term incentive<br />
and any unvested long-term incentives to which Mr Kelaher<br />
will be entitled in this event is at the discretion of the Board.<br />
In the event Mr Kelaher’s employment is terminated (except<br />
in the circumstances of misconduct), he will be paid an<br />
entitlement equal to twelve (12) months’ fixed remuneration<br />
plus unpaid leave entitlements, and an amount to reflect a<br />
pro-rated entitlement to STI for the period.<br />
Remuneration<br />
The remuneration of Mr Kelaher is set by the Board and<br />
is based on a market review of the level of remuneration<br />
required to attract and retain a high calibre individual suitable<br />
for the role. During the financial year ended 30 June <strong>2011</strong>, Mr<br />
Kelaher received a remuneration package comprising fixed<br />
remuneration of $990,000 including $60,000 Director’s fees<br />
paid directly by DKN Financial Group Limited. Mr Kelaher<br />
was entitled to a total STI opportunity of up to a maximum<br />
of $680,000 based on achievement of superior performance<br />
against set targets determined by the Remuneration and<br />
Nominations Committee. In July <strong>2011</strong> the Remuneration and<br />
Nominations Committee assessed Mr Kelaher’s performance<br />
against those targets and determined an STI amount of<br />
$612,000.<br />
In terms of his remuneration arrangements, the STI<br />
opportunity was settled two thirds by cash and a third in<br />
the form of deferred shares. The number of deferred shares<br />
granted to Mr Kelaher was determined on the basis of the STI<br />
deferral amount divided by the five day Volume Weighted<br />
Average Price up to and including 30 June <strong>2011</strong>, which<br />
was $6.4366. The number of deferred shares to be issued<br />
accordingly is 31,694 (capped at 75,000 <strong>annual</strong>ly) and there is<br />
no consideration payable for the grant of the deferred shares.<br />
The deferred shares are to vest in July 2012 subject to a Board<br />
‘look back’ arrangement.<br />
The Board has determined that the portion of STI that will be<br />
deferred will be subject to Board ‘look back’ arrangements.<br />
This means the Board will conduct a review of Group<br />
performance in June 2012 and assess whether any significant<br />
unexpected or unintended consequences have occurred<br />
that were not foreseen by the Remuneration & Nominations<br />
Committee when it made its decision in July <strong>2011</strong>, and whether<br />
it is still appropriate to award the deferred shares.<br />
During June <strong>2011</strong>, the Remuneration & Nominations<br />
Committee performed a ‘look back’ review in regards to the<br />
24,119 deferred shares issued in July 2010. The Committee<br />
determined that all of the deferred shares were to vest in<br />
accordance with the terms of the arrangement. The 24,119<br />
shares have since been transferred to Mr Kelaher.<br />
Performance rights and share options<br />
As approved at the Annual General Meeting (AGM) of<br />
shareholders on 23 November 2010, Mr Kelaher is entitled<br />
to participate in an LTI program offering a maximum reward<br />
opportunity of 150,000 performance rights and 300,000<br />
options in respect of the 2010/11 and <strong>2011</strong>/12 financial years.<br />
Following shareholder approval, 150,000 performance rights<br />
and 300,000 share options were granted to Mr Kelaher on<br />
23 November 2010 in relation to the 2010/11 financial year.<br />
An additional 150,000 performance rights and 300,000 share<br />
options were granted to Mr Kelaher on 1 July <strong>2011</strong>.<br />
page 31
IOOF | <strong>annual</strong> <strong>report</strong> <strong>2011</strong><br />
Remuneration <strong>report</strong> (cont’d)<br />
The performance rights and share options will be subject to<br />
a three year performance period commencing on the date<br />
of grant. They will vest after the performance period and be<br />
exercisable in the following manner:<br />
• 50% on the third anniversary of the grant date;<br />
• 25% on the fourth anniversary of the grant date; and<br />
• 25% on the fifth anniversary of the grant date.<br />
The exercise period will lapse 12 months after the fifth<br />
anniversary of the relevant grant date.<br />
The Board has the discretion to either purchase shares on<br />
market or to issue new shares.<br />
Performance rights – performance hurdles<br />
The Board has determined that this element of the plan will<br />
not activate unless a minimum average Return on Equity (ROE)<br />
of 5.5% per annum over the performance period has been<br />
achieved. The performance hurdle of the performance rights<br />
will be based on the Company’s Total Shareholder Return (TSR)<br />
relative to a comparator group comprising the ASX200 index<br />
companies over the performance period.<br />
Following a review of the Company’s LTI program during the<br />
2009 financial year, with advice being obtained from external<br />
remuneration consultants, the Board determined that the<br />
comparator group for the 2010 and future grants should be the<br />
ASX200. This comparator group provides an objective measure<br />
of performance across a range of industries and company<br />
types which compete with the Group for capital. The Board<br />
reserves the right to make changes to the peer group to allow<br />
for changing circumstances (e.g. takeover) for peer group<br />
companies.<br />
TSR measures the return to the shareholder over the<br />
performance period in terms of changes in the market value of<br />
the shares plus the value of the dividends paid on the shares.<br />
Performance rights that do not vest will lapse and will not<br />
be retested. Consistent with the Company’s hedging policy,<br />
Mr Kelaher will be prohibited from entering into hedging<br />
arrangements in respect of unvested performance rights.<br />
Upon exercise of the performance rights, shares will be<br />
allocated to Mr Kelaher. Shares allocated to Mr Kelaher will rank<br />
equally with all other ordinary shares on issue. Any dealing<br />
in shares resulting from performance rights that have been<br />
exercised will be subject to IOOF’s Securities and Insider<br />
Trading Policy.<br />
Percentage<br />
The percentage of performance rights that will vest at the<br />
end of the three year performance period each year will be<br />
determined by reference to the level of TSR performance of<br />
the Company over the vesting period compared with the<br />
performance of the comparator group as follows:<br />
Relative TSR performance % of performance rights vesting<br />
At or above 75th percentile 100%<br />
At or above median 50%<br />
Between median and<br />
75th percentile<br />
Below median 0%<br />
Cumulative TSR Performance<br />
250%<br />
200%<br />
150%<br />
100%<br />
50%<br />
0%<br />
Progressive vesting on a straight<br />
line basis, such that 2% of LTI<br />
awards vest for each 1% ranking<br />
increase from 50th percentile.<br />
Dec-09 Jun-10 Dec-10 Jun-11<br />
IOOF<br />
ASX 200 Median<br />
Share options – performance hurdles<br />
The options issued to Mr Kelaher have an exercise price<br />
of $6.93, calculated as the three month Volume Weighted<br />
Average Share Price up to and including the date of grant,<br />
being 23 November 2010.<br />
Shareholders approved that this element of the plan will<br />
not activate unless a minimum average ROE of 5.5% per<br />
annum over the performance period has been achieved.<br />
The performance hurdle for vesting of the options is a predetermined<br />
target growth in Earnings per Share (EPS) over the<br />
performance period.<br />
The EPS target will be compound growth of 10% per annum<br />
in each financial year 2010-11, <strong>2011</strong>-12 and 2012-13 from a base<br />
point of 34 cents per share, being the final actual EPS figure for<br />
financial year 2009/10.<br />
EPS for the purposes of the hurdle will be calculated on the<br />
basis of post-acquisition purchase price allocation UNPAT<br />
divided by average shares on issue during the year.<br />
page 32
IOOF | <strong>annual</strong> <strong>report</strong> <strong>2011</strong><br />
Share options that do not vest will lapse and not be retested. Consistent with the Company’s hedging policy, Mr Kelaher will be<br />
prohibited from entering into hedging arrangements in respect of unvested share options.<br />
Upon exercise of the share options (including payment of the exercise price) Mr Kelaher will be allocated one ordinary share in the<br />
Company for each option exercised. Shares allocated to Mr Kelaher will rank equally with all other ordinary shares on issue. Any dealing<br />
in shares resulting from share options that have been exercised will be subject to IOOF’s Securities and Insider Trading Policy.<br />
UNPAT Earning Per Share<br />
60<br />
55<br />
50<br />
45<br />
40<br />
35<br />
30<br />
25<br />
20<br />
2009/10<br />
2010/11<br />
<strong>2011</strong>/12<br />
2012/13<br />
2009 AGM Approved Targets 2010 AGM Approved Targets ACTUAL UNPAT EPS<br />
Change of control and cessation of employment<br />
The Board has determined that, if there is a change of control,<br />
any unvested LTIs may vest subject to the approval of the<br />
Board. If the Board so determines, any unvested performance<br />
rights and share options may become exercisable.<br />
Except where employment is terminated for serious<br />
misconduct, Mr Kelaher may be entitled to receive any LTIs<br />
that have vested as at the date of termination. On cessation of<br />
employment, unvested LTIs will be dealt with as follows:<br />
Reason for termination<br />
Termination of employment<br />
by IOOF by notice<br />
Termination of employment<br />
by IOOF for cause<br />
Resignation by Mr Kelaher<br />
Dismissal for serious<br />
misconduct (eg fraud)<br />
Treatment of unvested LTIs<br />
The Board has discretion to waive<br />
the performance hurdles or<br />
determine that the proportion (if<br />
any) of unvested LTIs that will vest<br />
Unvested performance rights and<br />
share options are forfeited<br />
The Board has discretion to waive<br />
the performance hurdles or<br />
determine that the proportion (if<br />
any) of unvested LTIs that will vest<br />
Unvested performance rights and<br />
share options are forfeited<br />
Remuneration for the Year Ended 30 June 2012<br />
The Board, on the advice of the Remuneration and<br />
Nominations Committee has increased the Managing<br />
Director’s fixed <strong>annual</strong> remuneration to $1,090,000 (including<br />
$65,000 Directors fees paid from DKN Financial Group Ltd)<br />
for the year to 30 June 2012. The Managing Director’s Short<br />
Term Incentive (STI) opportunity for the year to 30 June 2012<br />
has also been increased to 80% of base remuneration from<br />
$680,000 to $870,000. The STI terms will be the same as for<br />
the 2010/11 year, with specific performance hurdles. The STI<br />
deferral arrangements remain unchanged with two thirds of<br />
the STI award to be paid in cash shortly after the performance<br />
assessment has been completed at year end, and one third will<br />
be used to purchase company shares which will vest in<br />
July 2013 after a “look back” review in June 2013.<br />
page 33
IOOF | <strong>annual</strong> <strong>report</strong> <strong>2011</strong><br />
Remuneration <strong>report</strong> (cont’d)<br />
5. Employment contracts<br />
Remuneration and other terms of employment for the Managing Director, Executive Directors, and Senior Executives are formalised in<br />
employment contracts.<br />
Details of the employment contracts, as applied during the financial year, are as follows:<br />
Executive Term Notice period and termination provisions/ benefits applying during the financial year ending 30 June <strong>2011</strong><br />
C. Kelaher Ongoing The Company may terminate Mr Kelaher’s employment (except for misconduct) with 12 months written notice.<br />
The Company may elect to make a payment in lieu of part or all of this notice period based on 12 months’ ‘total fixed<br />
remuneration’ (incorporating unpaid leave entitlements, and an amount to reflect a pro-rated entitlement to STI for the<br />
period). The Board has discretion regarding treatment of unvested short and long-term incentives.<br />
S. Abley Ongoing The Company may terminate Mr Abley’s employment (except in the event of misconduct) by giving 5 months written<br />
notice.<br />
Mr Abley may terminate his employment by giving 1 months written notice.<br />
M. Carter Ongoing The Company may terminate Mr Carter’s employment (except in the event of misconduct) by giving 6 months written<br />
notice.<br />
Mr Carter may terminate his employment by giving 1 months written notice.<br />
D. Coulter Ongoing The Company may terminate Mr Coulter’s employment (except in the event of misconduct) by giving 6 months written<br />
notice.<br />
Mr Coulter may terminate his employment by giving 1 months written notice.<br />
S. Merlicek Ongoing The Company may terminate Mr Merlicek’s employment (except in the event of misconduct) by giving 6 months written<br />
notice.<br />
Mr Merlicek may terminate his employment by giving 3 months written notice.<br />
R. Mota Ongoing The Company may terminate Mr Mota’s employment (except in the event of misconduct) by giving a maximum of 7<br />
months written notice depending upon the circumstances of termination.<br />
Mr Mota may terminate his employment by giving 5 weeks written notice.<br />
A. Patterson Ongoing The Company may terminate Mr Patterson’s employment (except in the event of misconduct) by giving 6 months written<br />
notice.<br />
Mr Patterson may terminate his employment by providing 3 months notice.<br />
G. Riordan Ongoing The Company may terminate Mr Riordan’s employment (except in the event of misconduct) by giving 6 months written<br />
notice.<br />
Mr Riordan may terminate his employment by providing 6 months written notice.<br />
K. Morris Ongoing The Company may terminate Mr Morris’ employment (except in the event of misconduct) by giving 12 months notice.<br />
Mr Morris may terminate his employment by providing 6 months notice.<br />
T. Gunning Ongoing The Company may terminate Mr Gunning’s employment (except in the event of misconduct) by giving 12 weeks written<br />
notice.<br />
Mr Gunning may terminate his employment by providing 12 weeks written notice.<br />
page 34
IOOF | <strong>annual</strong> <strong>report</strong> <strong>2011</strong><br />
6. Remuneration tables<br />
The following table sets out the remuneration received by the Executive Director, other KMP and named Senior Executives for the<br />
financial year ended 30 June <strong>2011</strong> and the comparative year.<br />
Short term employee benefits<br />
Salary<br />
& fees<br />
Bonus (1)<br />
Nonmonetary<br />
(2)<br />
Postemployment<br />
benefits<br />
Superannuation<br />
Termination<br />
benefits<br />
Other<br />
long-term<br />
benefits<br />
Share-based payment (3)<br />
Options<br />
$ $ $ $ $ $ $ $ $<br />
Executive director<br />
C Kelaher <strong>2011</strong> 914,801 408,000 7,118 15,199 - - 273,956 398,307 2,017,381<br />
2010 885,539 297,000 6,803 14,461 - - 150,476 359,178 1,713,457<br />
Other key management personnel<br />
S Abley <strong>2011</strong> 305,624 60,000 6,474 15,199 - - 134,680 14,529 536,506<br />
2010 297,100 66,852 6,206 14,491 - - - 17,884 402,533<br />
M Carter <strong>2011</strong> 291,376 60,000 12,441 15,199 - - 245,985 - 625,001<br />
2010 280,852 60,179 10,664 9,148 - - 33,653 - 394,496<br />
D Coulter <strong>2011</strong> 294,801 50,000 - 15,199 - - 211,610 - 571,610<br />
2010 286,777 50,000 - 13,223 - - 12,014 - 362,014<br />
S Merlicek (4) <strong>2011</strong> 345,301 80,000 1,868 15,199 - - 134,680 - 577,048<br />
2010 247,949 70,000 5,360 10,512 - - - - 333,821<br />
R Mota <strong>2011</strong> 306,801 60,000 1,868 15,199 - - 134,680 73,517 592,065<br />
2010 298,150 63,784 806 14,350 - - - 97,388 474,478<br />
G Riordan <strong>2011</strong> 368,995 100,000 - 15,230 - - 245,280 - 729,505<br />
2010 346,095 90,000 - 13,905 - - 36,737 - 486,737<br />
Other specified executives<br />
A Patterson <strong>2011</strong> 634,801 560,000 127,501 15,199 - - - - 1,337,501<br />
2010 621,837 200,000 10,664 14,460 - - - - 846,961<br />
K Morris (5) <strong>2011</strong> 1,426,447 - - 25,000 - - - - 1,451,447<br />
2010 1,308,122 - - 23,000 - - - - 1,331,122<br />
T Gunning (6) <strong>2011</strong> 564,447 468,250 - 24,100 - - - - 1,056,797<br />
Shares<br />
Total<br />
Total <strong>2011</strong> 5,453,393 1,846,250 157,269 170,723 - - 1,380,871 486,353 9,494,860<br />
2010 4,572,421 897,815 40,503 127,550 - - 232,880 474,450 6,345,619<br />
(1) The bonus reflects amounts provided under the short-term incentive program in relation to the financial year with the exception of Mr Abley. Mr Abley’s bonus<br />
includes an amount of $20,000 that relates to 2009/10. The bonus for Mr Abley in relation to the 2010/11 financial year is $40,000. This incentive payment amount for<br />
2010/11 has been communicated to all participants with the exception of Mr Patterson which was considered at the August board meeting of Perennial Investment<br />
Partners Ltd, the amount above reflects an estimate only. One third of the bonus awarded to Mr Kelaher has been deferred into shares which will vest in July 2012, this<br />
component of the STI is included as a share-based payment. The expected payment value of the bonuses is the amount shown and includes any amounts that may be<br />
sacrificed into superannuation.<br />
(2) Non-monetary benefits include fringe benefits tax paid and the value of other non-monetary benefits.<br />
(3) Equity compensation includes accruals in relation to the Executive Performance Share Plan and accruals in relation to other grants of performance rights and options<br />
over shares in the Company. The value of the number of shares and options expected to vest has been apportioned over the term from grant date to vesting date.<br />
(4) Mr Merlicek was appointed 1 October 2009 therefore the 2010 comparative remuneration represents nine months of his <strong>annual</strong> salary at that time.<br />
(5) The remuneration for Mr Morris has been included for the comparative period as Mr Morris was in the top 5 most highly remunerated employees for that year.<br />
Mr Morris is employed by the Ord Minnett Group (70% owned subsidiary).<br />
(6) Appointed 17 November 2010 to Ord Minnett Group (70% owned subsidiary).<br />
page 35
IOOF | <strong>annual</strong> <strong>report</strong> <strong>2011</strong><br />
Remuneration <strong>report</strong> (cont’d)<br />
Remuneration components as a percentage of total remuneration<br />
Remuneration components (based on <strong>annual</strong>ised amounts)<br />
Name Fixed Total Incentive Compensation Award Total Remuneration<br />
<strong>2011</strong> 2010 <strong>2011</strong> 2010 <strong>2011</strong> 2010<br />
% % % % % %<br />
C Kelaher 46 53 54 47 100 100<br />
S Abley 61 79 39 21 100 100<br />
M Carter 51 76 49 24 100 100<br />
D Coulter 54 83 46 17 100 100<br />
S Merlicek 63 83 37 17 100 100<br />
R Mota 55 66 45 34 100 100<br />
A Patterson 58 87 42 13 100 100<br />
G Riordan 53 74 47 26 100 100<br />
K Morris 100 100 - - 100 100<br />
T Gunning 56 n/a 44 n/a 100 n/a<br />
Consequences of performance on shareholder wealth<br />
In considering the Group’s performance and benefits for shareholder wealth, the remuneration committee have regard to the<br />
following indices in respect of the current financial year and the previous four financial years.<br />
<strong>2011</strong> 2010 2009 2008 2007<br />
Profit attributable to owners of the Company ($’000s) 99,489 77,371 9,044 24,286 26,476<br />
UNPAT ($’000s) 93,470 79,261 49,100 25,900 29,300<br />
Basic EPS (cents per share) 43.1 33.7 7.4 35.6 41.5<br />
Share price at start of year $5.99 $4.04 $5.10 $10.19 $8.50<br />
Share price at end of year $6.60 $5.99 $4.04 $5.10 $10.19<br />
Change in share price $0.61 $1.95 $(1.06) $(5.09) $1.69<br />
Dividends paid (cents per share) 39.0 34.0 15.0 33.0 30.0<br />
Return on equity (non-statutory measure) 12.9% 11.4% 11.3% 14.1% 16.8%<br />
Total bonuses paid to key management personnel ($’000s) 1,022 995 1,321 945 844<br />
Underlying Profit and STI Payments<br />
UNPAT<br />
100,000<br />
90,000<br />
80,000<br />
70,000<br />
60,000<br />
50,000<br />
40,000<br />
30,000<br />
20,000<br />
10,000<br />
-<br />
<strong>2011</strong> 2010 2009 2008 2007<br />
UNPAT<br />
Aggregate KMP Bonuses<br />
1,400<br />
1,200<br />
1,000<br />
800<br />
600<br />
400<br />
200<br />
-<br />
Bonus amount<br />
STI payments prior to 2009 reflect the lower size and profitability of Group prior to its acquisitions of IOOF Global One (formerly<br />
Skandia) and Australian Wealth Management in 2009. STI payments during that period were provided to a leadership team which<br />
was necessarily of approximately the same size and depth of experience as is currently employed. In 2009, the acquisitions noted<br />
previously precipitated a number of accelerated STI payments as the executive teams from each of the merging entities were reduced<br />
to avoid duplication of roles and allow for realisation of synergies. In the periods post 2009, STI payments broadly conform to the<br />
group’s increased profitability and scale. As is consistent with the Group’s adherence to effective cost management, STI levels from<br />
2010 to <strong>2011</strong> have been constrained and recognise KPIs specific to individuals rather than being rigidly tied to enhanced profitability.<br />
page 36
IOOF | <strong>annual</strong> <strong>report</strong> <strong>2011</strong><br />
Share option component of total remuneration<br />
The following table summarises the percentage of remuneration consisting of rights and options, value of options granted and the<br />
percentage vested and forfeited during the year to Directors and senior management:<br />
Name<br />
Remuneration consisting of<br />
Value at grant date (2) % vested<br />
rights and options (1) in year<br />
% forfeited<br />
in year<br />
Financial years<br />
in which grant<br />
vests<br />
<strong>2011</strong> 2010 <strong>2011</strong> 2010 <strong>2011</strong> <strong>2011</strong><br />
% % $ $ % %<br />
S Abley 28 4 428,090 43,628 - - 2013<br />
M Carter 39 9 535,112 231,000 - - 2013<br />
D Coulter 37 3 428,090 231,000 - - 2013<br />
C Kelaher 33 12 1,240,875 874,276 - - n/a<br />
G Riordan 34 8 535,112 231,000 - - 2013<br />
R Mota 35 21 428,090 70,199 - - 2012<br />
(1) The percentage of the value of remuneration consisting of options, based on the value of the options expensed during the year.<br />
(2) The value at grant date calculated in accordance with AASB 2 Share-based payment of options granted during the year as part of remuneration and accounted for over<br />
the vesting period.<br />
Options and performance rights over equity instruments granted as compensation<br />
Details of options over ordinary shares in the Company that were granted as compensation to each key management person during<br />
the <strong>report</strong>ing period and details on options that vested during the <strong>report</strong>ing period are as follows:<br />
Name<br />
Number of<br />
options granted<br />
during <strong>2011</strong><br />
Grant<br />
date<br />
Fair value per<br />
option at<br />
grant date $<br />
Exercise<br />
price per<br />
option $<br />
Exercise<br />
period<br />
Number of<br />
options vested<br />
during <strong>2011</strong><br />
S Abley (1) 200,000 29-Jul-10 2.517 6.14 1 Jul 13 - 30 Jun 15 nil<br />
M Carter (1) 250,000 29-Jul-10 2.517 6.14 1 Jul 13 - 30 Jun 15 nil<br />
D Coulter (1) 200,000 29-Jul-10 2.517 6.14 1 Jul 13 - 30 Jun 15 nil<br />
C Kelaher (2) 300,000 23-Nov-10 2.383 6.93 23 Nov 13 - 23 Nov 16 nil<br />
S Merlicek (1) 200,000 29-Jul-10 2.517 6.14 1 Jul 13 - 30 Jun 15 nil<br />
R Mota (1) 200,000 29-Jul-10 2.517 6.14 1 Jul 13 - 30 Jun 15 nil<br />
G Riordan (1) 250,000 29-Jul-10 2.517 6.14 1 Jul 13 - 30 Jun 15 nil<br />
(1) The options vest subject to continued employment with the Group.<br />
(2) The granting of an offer of options to Mr Kelaher were approved by shareholders at the 23 November 2010 AGM.<br />
Details on performance rights over ordinary shares in the Company that were granted as compensation to each key management<br />
person during the <strong>report</strong>ing period and details on options that vested during the <strong>report</strong>ing period are as follows:<br />
Name<br />
Number of<br />
rights granted<br />
during <strong>2011</strong><br />
Grant date<br />
Fair value<br />
per right at<br />
grant date $<br />
Vesting dates<br />
Number of<br />
rights vested<br />
during 2010<br />
Performance<br />
hurdles<br />
C Kelaher 150,000 23-Nov-10 3.51 50% - 27 Nov 2012 nil TSR and ROE (1)<br />
25% - 27 Nov 2013<br />
25% - 27 Nov 2014<br />
(1) The Board has determined that this element of the plan will not activate unless a minimum average Return on Equity (ROE) of 5.5% per annum over the performance<br />
period has been achieved. The performance hurdle of the performance rights will be based on the Company’s Total Shareholder Return (TSR) relative to a comparator<br />
group comprising the ASX200 index companies per annum over the performance period. TSR measures the return to the shareholder over the performance period in<br />
terms of changes in the market value of the shares plus the value of the dividends paid on the shares.<br />
page 37
IOOF | <strong>annual</strong> <strong>report</strong> <strong>2011</strong><br />
Remuneration <strong>report</strong> (cont’d)<br />
Options granted since the end of the financial year<br />
In accordance with the approval obtained from shareholders at the November 2010 AGM, Mr Kelaher was issued the <strong>2011</strong>/12 grant of<br />
share options. The exercise price was calculated as the Company’s three month weighted average price up to including the date of<br />
the grant.<br />
The following share options were approved for offer to key management personnel since the end of the financial year. These options<br />
were provided at no cost and are yet to be accepted by the recipients.<br />
Name Arrangement Number of<br />
options granted<br />
Grant date<br />
Exercise price<br />
$<br />
Exercise<br />
period<br />
M Carter Options 200,000 1-Jul-11 6.47 1 Jul 14 - 30 Jun 16<br />
D Coulter Options 200,000 1-Jul-11 6.47 1 Jul 14 - 30 Jun 16<br />
C Kelaher Options 300,000 1-Jul-11 6.81 50% 1 Jul 14 - 1 Jul 17<br />
25% 1 Jul 15 - 1 Jul 17<br />
25% 1 Jul 16 - 1 Jul 17<br />
S Merlicek Options 200,000 1-Jul-11 6.47 1 Jul 14 - 30 Jun 16<br />
R Mota Options 200,000 1-Jul-11 6.47 1 Jul 14 - 30 Jun 16<br />
G Riordan Options 200,000 1-Jul-11 6.47 1 Jul 14 - 30 Jun 16<br />
All options expire on the earlier of their expiry date or termination of the individual’s employment. The performance hurdles of the<br />
options are detailed within the Managing Director’s Remuneration section of the Remuneration Report.<br />
Exercise of performance rights and options granted as compensation<br />
During the <strong>report</strong>ing period, the following shares were issued on the exercise of performance rights and options previously granted as<br />
compensation:<br />
Name Series Grant date Number of<br />
shares issued<br />
Amount paid<br />
per options/ shares<br />
$<br />
M Carter 2009-11 30-Apr-09 134,048 6.34<br />
R Mota (1) 2007-01 1-Dec-07 14,657 nil<br />
G Riordan 2009-11 30-Apr-09 53,619 6.34<br />
(1) Prior to the acquisition of AWM, the performance hurdles for vesting of the performance rights was on the Group’s achievement of pre-determined TSR (30%), cash<br />
EPS (30%) and continued employment with the Group (40%). As a consequence of the acquisition, in accordance with the terms of the Share Plan, the Remuneration<br />
and Nominations Committee exercised its discretion to waive the performance hurdles in respect of unvested performance rights as it is now impractical to measure<br />
performance against the hurdles on the basis established prior to the acquisition. As a result, the vesting conditions were replaced with continued employment with<br />
the Group over the performance period.<br />
There are no amounts unpaid on the shares issued as a result of the exercise of the options in the <strong>2011</strong> financial year.<br />
Short Term Incentive (STI) and Long Term Incentive (LTI) equity allocations<br />
The following table sets out the STI and LTI equity allocation awarded or forfeited in respect of the financial year. Executives (other<br />
than the Managing Director) no longer have a fixed component of STIs or LTIs due to the discretionary nature of payments and equity<br />
allocations. Accordingly there can be no measure of amounts forfeited.<br />
Name STI LTI<br />
Paid Forfeited Paid Forfeited<br />
% % % %<br />
C Kelaher 90 10 n/a n/a<br />
There were no LTI schemes that vested during the period for which performance hurdles were required to be tested.<br />
page 38
IOOF | <strong>annual</strong> <strong>report</strong> <strong>2011</strong><br />
Analysis of movements in deferred shares<br />
Details on deferred ordinary shares in the Company that were granted as compensation to each key management person during the<br />
<strong>report</strong>ing period and details on deferred shares that vested during the <strong>report</strong>ing period are as follows:<br />
Name<br />
Grant<br />
date<br />
Vesting<br />
date<br />
Performance<br />
hurdles<br />
Deferred<br />
shares held<br />
at 1-Jul-10<br />
Granted<br />
Vested and<br />
transferred<br />
Deferred<br />
shares held<br />
at 30-Jun-11<br />
Vested<br />
during<br />
the year<br />
Shares<br />
unvested<br />
at 30-Jun-11<br />
C Kelaher Jul-10 1-Jul-11 None (1) 24,119 - - 24,119 - 24,119<br />
Jul-10 1-Jul-12 None (1) 24,119 - - 24,119 - 24,119<br />
Jul-11 1-Jul-12 None (2) - 31,694 - 31,694 - 31,694<br />
(1) In July 2010 the Remuneration and Nominations Committee assessed Mr Kelaher’s performance against key performance indicators for the 2009-10 financial year and<br />
determined an STI amount of $594,000.<br />
In terms of his remuneration arrangements, the STI opportunity was settled 50% by cash and 50% in the form of deferred shares. The number of deferred shares<br />
granted to Mr Kelaher was determined on the basis of the STI deferral amount divided by the five day Volume Weighted Average Price up to and including 30 June<br />
2010, which was $6.16. The number of deferred shares to be issued accordingly is 48,238 (capped at 75,000 <strong>annual</strong>ly) and there is no consideration payable for the grant<br />
of the deferred shares.<br />
(2) In July <strong>2011</strong>, the Remuneration and Nominations Committee assessed Mr Kelaher’s performance against key performance indicators for the 2010-11 financial year and<br />
determined an STI amount of $612,000.<br />
In terms of his remuneration arrangements, the STI opportunity was settled two thirds by cash and one third in the form of deferred shares. The number of deferred<br />
shares granted to Mr Kelaher was determined on the basis of the STI deferral amount divided by the five day Volume Weighted Average Price up to and including 30<br />
June <strong>2011</strong>, which was $6.4366. The number of deferred shares to be issued accordingly is 31,694 (capped at 75,000 <strong>annual</strong>ly) and there is no consideration payable for<br />
the grant of the deferred shares.<br />
The Board has determined that the portion of STI that will be deferred will be subject to Board ‘look back’ arrangements. This means<br />
the Board will conduct a review of Company performance in June <strong>2011</strong> and assess whether any significant unexpected or unintended<br />
consequences have occurred that were not foreseen by the Remuneration & Nominations Committee when it made its decision in<br />
July 2010, and whether it is still appropriate to award the deferred shares.<br />
Analysis of movements in performance rights<br />
Details on rights over ordinary shares in the Company that were granted as compensation to each key management person during<br />
the <strong>report</strong>ing period and details on rights that vested during the <strong>report</strong>ing period are as follows:<br />
Name<br />
Grant<br />
date<br />
Vesting<br />
date<br />
Performance<br />
hurdles<br />
Rights held<br />
at 1-Jul-10<br />
Granted<br />
Vested and<br />
transferred<br />
Rights held<br />
at 30-Jun-11<br />
Vested<br />
during the<br />
year<br />
Rights<br />
unvested at<br />
30-Jun-11<br />
S Abley Dec-09 1-Dec-12 Service 4,623 - - 4,623 - 4,623<br />
Dec-09 1-Dec-12 Cash EPS (2) 3,467 - - 3,467 - 3,467<br />
Dec-09 1-Dec-12 TSR (3) 3,467 - - 3,467 - 3,467<br />
C Kelaher Nov-09 27-Nov-12 TSR and ROE 75,000 - - 75,000 - 75,000<br />
Nov-09 27-Nov-13 TSR and ROE 37,500 - - 37,500 - 37,500<br />
Nov-09 27-Nov-14 TSR and ROE 37,500 - - 37,500 - 37,500<br />
Nov-10 27-Nov-13 TSR and ROE - 75,000 - 75,000 - 75,000<br />
Nov-10 27-Nov-14 TSR and ROE - 37,500 - 37,500 - 37,500<br />
Nov-10 27-Nov-15 TSR and ROE - 37,500 - 37,500 - 37,500<br />
R Mota Dec-07 1-Dec-10 Service (1) 14,657 - (14,657) - 14,657 -<br />
Dec-08 1-Dec-11 Service (1) 30,497 - - 30,497 - 30,497<br />
Dec-09 1-Dec-12 Service 7,438 - - 7,438 - 7,438<br />
Dec-09 1-Dec-12 Cash EPS (2) 5,579 - - 5,579 - 5,579<br />
Dec-09 1-Dec-12 TSR (3) 5,579 - - 5,579 - 5,579<br />
(1) Prior to the acquisition of AWM, the performance hurdles for vesting of the performance rights was on the Group’s achievement of pre-determined TSR (60%), cash EPS<br />
(20%) and return on equity (20%). As a consequence of the acquisition, in accordance with the terms of the Share Plan, the Remuneration and Nominations Committee<br />
exercised its discretion to waive the performance hurdles in respect of unvested performance rights as it is now impractical to measure performance against the<br />
hurdles on the basis established prior to the acquisition. As a result, the performance rights were deemed to have vested effective 30 April 2009.<br />
(2) The performance rights will vest subject to the achievement of Group shareholder cash EPS in excess of 10% each year over the performance period.<br />
(3) The performance rights will vest subject to the achievement of a pre-determined level of Company TSR relative to a comparator group comprising the<br />
ASX200 index companies.<br />
page 39
IOOF | <strong>annual</strong> <strong>report</strong> <strong>2011</strong><br />
Remuneration <strong>report</strong> (cont’d)<br />
Analysis of movements in options<br />
Details on options over ordinary shares in the Company that were granted as compensation to each key management person during<br />
the <strong>report</strong>ing period and details on options that vested during the <strong>report</strong>ing period are as follows.<br />
Name Series Exercise<br />
price<br />
Options<br />
held at<br />
1-Jul-10<br />
Granted<br />
Forfeited<br />
or lapsed<br />
Exercised<br />
Options<br />
held at<br />
30-Jun-11<br />
Vested<br />
during<br />
the year<br />
Options<br />
unvested at<br />
30-Jun-11<br />
Vested and<br />
exercisable<br />
at 30-Jun-11<br />
Key management personnel<br />
S Abley 2010-04 $6.14 - 200,000 - - 200,000 - 200,000 -<br />
M Carter 2009-06 $9.70 6,702 - (6,702) - - - - -<br />
2009-08 $9.36 13,404 - - - 13,404 4,021 - 13,404<br />
2009-11 $6.34 134,048 - - (134,048) - - - -<br />
2010-03 $7.01 100,000 - - - 100,000 - 100,000 -<br />
2010-04 $6.14 - 250,000 - - 250,000 - 250,000 -<br />
D Coulter 2010-03 $7.01 100,000 - - - 100,000 - 100,000 -<br />
2010-04 $6.14 - 200,000 - - 200,000 - 200,000 -<br />
C Kelaher 2009-09 $9.99 134,048 - - - 134,048 - - 134,048<br />
2009-16 $5.20 316,624 - - - 316,624 - 316,624 -<br />
2010-05 $6.93 - 300,000 - - 300,000 - 300,000 -<br />
S Merlicek 2010-04 $6.14 - 200,000 - - 200,000 - 200,000 -<br />
R Mota 2010-04 $6.14 - 200,000 - - 200,000 - 200,000 -<br />
G Riordan 2009-05 $9.18 40,214 - (40,214) - - - - -<br />
2009-08 $9.36 53,619 - - - 53,619 - - 53,619<br />
2009-11 $6.34 53,619 - - (53,619) - - - -<br />
2010-03 $7.01 100,000 - - - 100,000 - 100,000 -<br />
2010-04 $6.14 - 250,000 - - 250,000 - 250,000 -<br />
1,052,278 1,600,000 (46,916) (187,667) 2,417,695 4,021 2,216,624 201,071<br />
page 40
IOOF | <strong>annual</strong> <strong>report</strong> <strong>2011</strong><br />
Each of the relevant details of the options series is as follows:<br />
Series Grant date Exercise period Vesting date Performance hurdles<br />
2009-05 30-Apr-09 Apr 09 - Jan 11 30-Apr-09 Service (1)<br />
2009-06 30-Apr-09 Apr 09 - Mar 11<br />
2009-08 30-Apr-09 Apr 09 - Jun 13<br />
2009-11 30-Apr-09 Jun 09 - Jul 11<br />
2009-09 30-Apr-09 Apr 09 - Nov 12<br />
2009-16 27-Nov-09 Nov 12 - Nov 15<br />
40% 30-Apr-09 Service (1)<br />
30% 30-Sep-09 Service (2)<br />
30% 30-Sep-10 Service (2)<br />
70% 30-Apr-09 Service (1)<br />
30% 30-Sep-10 Service (2)<br />
50% 30-Jun-09<br />
50% 30-Jun-10<br />
33% 30-Apr-09<br />
33% 22-Nov-09<br />
33% 22-Nov-10<br />
50% 27-Nov-12<br />
25% 27-Nov-13<br />
25% 27-Nov-14<br />
Service (2)<br />
Service (3)<br />
EPS & ROE (4)<br />
2010-03 4-May-10 May 13 - May 16 4-May-13 Service<br />
2010-04 29-Jul-10 Jul 13 - Jun 15 1-Jul-13 Service<br />
2010-05 23-Nov-10 Nov 13 - Nov 16<br />
2008-04 1-Jan-08<br />
2008-05 1-Jul-08<br />
2009-21 1-Apr-09<br />
50% 23-Nov-13<br />
25% 23-Nov-14<br />
25% 23-Nov-15<br />
EPS & ROE<br />
Apr 09 - 31 Dec 10 30-Apr-09 Accelerated vesting (5)<br />
(1) Prior to the acquisition of AWM, these options had fully vested. As disclosed in the Scheme Booklet for the acquisition, options over AWM shares held by AWM<br />
employees have been converted into IOOF options of economic equivalence.<br />
(2) As disclosed in the Scheme Booklet for the acquisition of AWM, options over AWM shares held by AWM employees have been converted into IOOF options of<br />
economic equivalence. The remaining options vest progressively over a service period.<br />
(3) Prior to the acquisition of AWM, the performance hurdle for vesting of AWM options was 50% on the Group’s achievement of the approved budget for that financial<br />
year and the remaining 50% if the Company’s Total Shareholder Return (TSR) is positive, and in the top quartile relative to the TSR of a comparator group of ASX listed<br />
companies selected by the Board. As a consequence of the acquisition, in accordance with the terms of the Share Option Plan, the Remuneration and Nominations<br />
Committee exercised its discretion to waive the performance hurdle in respect of unvested options as it is now impractical to measure performance against the hurdle<br />
on the basis established prior to the acquisition. The vesting of the options is conditional on continuing employment with the Group.<br />
(4) Shareholders approved that this element of the plan will not activate unless a minimum average ROE of 5.5% per annum over the performance period has been<br />
achieved. The performance hurdle for vesting of the options is an EPS target of compound growth of 10% per annum in each financial year 2010-11, <strong>2011</strong>-12 and 2012-<br />
13 from a base point of 34 cents per share, being the final actual EPS figure for financial year 2009/10.<br />
(5) Prior to the acquisition of AWM the performance hurdle for vesting of the IOOF options was 40% on the Group’s achievement of compounding earnings per share<br />
in excess of 10% over the vesting period, 30% on the Company’s achievement of TSR above a pre-determined benchmark and the remaining 30% on continued<br />
employment with the Group. As a consequence of the acquisition, in accordance with the terms of the Share Option Plan, the Remuneration and Nominations<br />
Committee exercised its discretion to waive the performance hurdles in respect of unvested options as it is now impractical to measure performance against the<br />
hurdle on the basis established prior to the acquisition. As a result, options were deemed to have vested effective 30 April 2009.<br />
page 41
IOOF | <strong>annual</strong> <strong>report</strong> <strong>2011</strong><br />
Remuneration <strong>report</strong> (cont’d)<br />
7. Non-executive directors’ remuneration<br />
Approval of funding for the remuneration<br />
The Company’s Constitution requires that the aggregate remuneration paid or provided to all Non-Executive Directors in any financial<br />
year by the Company, its subsidiaries and associated entities may not exceed an amount approved by shareholders. This ceiling<br />
amount includes all remuneration provided to Non-Executive Directors, including superannuation but not including retirement<br />
benefits. The current limit of $980,000 per annum was approved by shareholders at the 2010 Annual General Meeting.<br />
Objectives<br />
The primary objective of the policy for Non-Executive Directors is to ensure the Company is able to retain and attract high calibre<br />
Non-Executive Directors. Non-Executive Directors are remunerated by way of fixed fees, including superannuation, and do not<br />
participate in remuneration programs designed to provide an incentive to Executive Directors and Senior Executives.<br />
Non-Executive Directors’ remuneration is independent of the Company’s earnings or growth in shareholder value to encourage Non-<br />
Executive Directors to perform their roles independently of Senior Executives.<br />
Equity participation<br />
The Company established a Deferred Share Purchase Plan for Non-Executive Directors to enable them, on an optional basis, to salary<br />
sacrifice a portion of <strong>annual</strong> fees in order to acquire shares in the Company at market value on a tax deferred basis.<br />
The following table sets out the number of shares acquired by the participating directors as at 30 June <strong>2011</strong> and the range of prices at<br />
which shares were acquired during the financial year ended 30 June <strong>2011</strong>.<br />
Name<br />
Shares<br />
acquired<br />
Share price range at<br />
acquisition date<br />
Total value<br />
No. $ $<br />
I Blair 4,259 6.47 - 7.84 30,004<br />
J Harvey 1,703 6.47 - 7.84 11,998<br />
J Pfeiffer 5,941 6.47 - 7.84 41,854<br />
R Sexton 3,169 6.47 - 7.84 22,325<br />
Retirement benefits<br />
The Board has withdrawn this benefit from the potential remuneration for new Non-Executive Directors. However, the program<br />
continued for Directors appointed prior to 13 April 2003 to fulfil the terms of historical agreements. This benefit provides for a cash<br />
based payment to Non-Executive Directors at the time of their retirement and is calculated as follows:<br />
Period of service as a NED Benefit value (1)<br />
0 to < 3 years Nil<br />
3 to 5 years AAE times 1.0<br />
> 5 years to 10 years AAE times 1.5<br />
> 10 years AAE times 2.0<br />
The retirement benefits plan will remain in operation for Mr Blair and Dr Sexton (being the only two remaining participants) for the<br />
year ending 30 June 2012.<br />
(1) “AAE” = Annual Average Emoluments over the last 3 years of service to date of retirement.<br />
page 42
IOOF | <strong>annual</strong> <strong>report</strong> <strong>2011</strong><br />
Terms of appointment<br />
All Non-Executive Directors have letters of appointment detailing the terms under which they are engaged. The term of appointment<br />
for each is open-ended, subject to the provisions of the Corporations Act and the Company’s Constitution. Under the IOOF Holdings<br />
Ltd Constitution, one-third of Directors must retire from office each year and may seek re-election by shareholders at the AGM of the<br />
Company.<br />
Remuneration table<br />
Key management<br />
personnel<br />
Short-term benefits<br />
Directors Shares (2) Nonmonetary<br />
fees (1)<br />
Postemployment<br />
benefits<br />
Superannuation<br />
Total<br />
shareholder<br />
approved<br />
remuneration (3)<br />
Postemployment<br />
benefits<br />
Retirement<br />
benefits (4)<br />
$ $ $ $ $ $ $<br />
Non-executive directors<br />
I Blair <strong>2011</strong> 160,562 30,000 153 14,438 205,153 64,101 269,254<br />
2010 150,363 29,769 3,281 13,368 196,781 - 196,781<br />
J Harvey <strong>2011</strong> 112,852 12,000 153 10,148 135,153 - 135,153<br />
2010 105,397 11,908 349 9,395 127,049 - 127,049<br />
J Pfeiffer <strong>2011</strong> 92,310 41,857 153 833 135,153 - 135,153<br />
2010 85,166 41,534 - - 126,700 - 126,700<br />
R Sexton <strong>2011</strong> 103,381 22,320 153 9,299 135,153 492 135,645<br />
2010 97,822 22,148 - 8,804 128,774 - 128,774<br />
G Venardos <strong>2011</strong> 123,861 - - 11,139 135,000 - 135,000<br />
2010 116,319 - - 10,381 126,700 - 126,700<br />
I Griffiths <strong>2011</strong> 125,055 - - 9,945 135,000 - 135,000<br />
2010 112,239 - - 14,461 126,700 - 126,700<br />
Total <strong>2011</strong> 718,021 106,177 612 55,802 880,612 64,593 945,205<br />
Total 2010 667,306 105,359 3,630 56,409 832,704 - 832,704<br />
(1) Directors fees includes any fees sacrificed into superannuation funds.<br />
(2) Shares represent Directors’ fees sacrificed into the Non-Executive Director Deferred Share Purchase Plan.<br />
(3) Shareholder Approved Remuneration amounted to $880,612 and was within the shareholder approved limit of $980,000 per annum.<br />
(4) Non-Executive Directors appointed after 13 April 2003 are not entitled to retirement benefits. Non-Executive Directors appointed prior to this date accrue retirement<br />
benefits. Where entitled, the provision is based on the average emoluments of Non-Executive Directors over the previous three years’ of service. The benefit accrues<br />
after three years of service and varies according to the number of years of service, reaching twice the average <strong>annual</strong> emoluments after ten years of service. The<br />
significant increase to Mr Blair during the year is as a result of reaching 10 years of service and accruing retirement benefits at a higher rate. Refer to ‘retirement benefits’<br />
above for further details.<br />
Total<br />
page 43
IOOF | <strong>annual</strong> <strong>report</strong> <strong>2011</strong><br />
Remuneration <strong>report</strong> (cont’d)<br />
8. Payments to persons before taking office<br />
No Director or member of senior management appointed during the period received a payment as part of his or her consideration for<br />
agreeing to hold the position.<br />
This Directors’ <strong>report</strong> is signed in accordance with a resolution of the directors made pursuant to s.298(2) of the Corporations Act 2001.<br />
This <strong>report</strong> is made with a resolution of the Directors:<br />
Ian Blair<br />
Chairman<br />
25 August <strong>2011</strong><br />
page 44
Director’s declaration<br />
For the year ended 30 June <strong>2011</strong><br />
IOOF | <strong>annual</strong> <strong>report</strong> <strong>2011</strong><br />
1. In the opinion of the Directors of the Company:<br />
(a) the consolidated financial statements and notes set out on pages 49 to 113, and the Remuneration <strong>report</strong> in the Directors’<br />
<strong>report</strong>, set out on pages 29 to 44 are in accordance with the Corporations Act 2001 including:<br />
(i) giving a true and fair view of the Company’s and Group’s financial position as at 30 June <strong>2011</strong> and of their performance, for<br />
the financial year ended on that date; and<br />
(ii) complying with Australian Accounting Standards (including the Australian Accounting Interpretations) and the<br />
Corporations Regulations 2001;<br />
(b) there are reasonable grounds to believe that the Company will be able to pay its debts as and when they become due and<br />
payable.<br />
2. The Directors have been given the declarations required by Section 295A of the Corporations Act 2001 from the Managing<br />
Director and Chief Financial Officer for the financial year ended 30 June <strong>2011</strong>.<br />
3. The Directors draw attention to Note 2(a) to the consolidated financial statements, which includes a statement of compliance with<br />
International Financial Reporting Standards.<br />
Signed in accordance with a resolution of the Directors:<br />
Ian Blair<br />
Chairman<br />
Melbourne<br />
25 August <strong>2011</strong><br />
page 45
IOOF | <strong>annual</strong> <strong>report</strong> <strong>2011</strong><br />
Independence declaration<br />
For the year ended 30 June <strong>2011</strong><br />
Lead Auditor’s Independence Declaration under Section 307C<br />
of the Corporations Act 2001<br />
To: the Directors of IOOF Holdings Ltd<br />
I declare that, to the best of my knowledge and belief, in relation to the audit for the financial year ended 30 June <strong>2011</strong><br />
there have been:<br />
(i) no contraventions of the auditor independence requirements as set out in the Corporations Act 2001 in relation to the audit; and<br />
(ii) no contraventions of any applicable code of professional conduct in relation to the audit.<br />
KPMG<br />
Michelle Hinchliffe<br />
Partner<br />
Melbourne<br />
25 August <strong>2011</strong><br />
KPMG, an Australian partnership and a member firm of the KPMG network of<br />
independent member fims affiliated with KPMG International Cooperative<br />
(“KPMG International”), a Swiss entity.<br />
page 46
Independent auditor’s <strong>report</strong><br />
For the year ended 30 June <strong>2011</strong><br />
IOOF | <strong>annual</strong> <strong>report</strong> <strong>2011</strong><br />
Independent auditor’s <strong>report</strong> to the members of IOOF Holdings Ltd<br />
Report on the financial <strong>report</strong><br />
We have audited the accompanying financial <strong>report</strong> of IOOF Holdings Ltd (the Company), which comprises the statements of financial<br />
position as at 30 June <strong>2011</strong>, and statements of comprehensive income, statements of changes in equity and statements of cash<br />
flows for the year ended on that date, notes 1 to 41 comprising a summary of significant accounting policies and other explanatory<br />
information and the directors’ declaration of the Company and the Group comprising the company and the entities it controlled at<br />
the year’s end or from time to time during the financial year.<br />
Directors’ responsibility for the financial <strong>report</strong><br />
The directors of the company are responsible for the preparation of the financial <strong>report</strong> that gives a true and fair view in accordance<br />
with Australian Accounting Standards and the Corporations Act 2001 and for such internal control as the directors determine is<br />
necessary to enable the preparation of the financial <strong>report</strong> that is free from material misstatement whether due to fraud or error. In<br />
note 2(a), the directors also state, in accordance with Australian Accounting Standard AASB 101 Presentation of Financial Statements, that<br />
the financial statements comply with International Financial Reporting Standards.<br />
Auditor’s responsibility<br />
Our responsibility is to express an opinion on the financial <strong>report</strong> based on our audit. We conducted our audit in accordance with<br />
Australian Auditing Standards. These Auditing Standards require that we comply with relevant ethical requirements relating to audit<br />
engagements and plan and perform the audit to obtain reasonable assurance whether the financial <strong>report</strong> is free from material<br />
misstatement.<br />
An audit involves performing procedures to obtain audit evidence about the amounts and disclosures in the financial <strong>report</strong>. The<br />
procedures selected depend on the auditor’s judgement, including the assessment of the risks of material misstatement of the<br />
financial <strong>report</strong>, whether due to fraud or error. In making those risk assessments, the auditor considers internal control relevant to the<br />
entity’s preparation of the financial <strong>report</strong> that gives a true and fair view in order to design audit procedures that are appropriate in<br />
the circumstances, but not for the purpose of expressing an opinion on the effectiveness of the entity’s internal control. An audit also<br />
includes evaluating the appropriateness of accounting policies used and the reasonableness of accounting estimates made by the<br />
directors, as well as evaluating the overall presentation of the financial <strong>report</strong>.<br />
We performed the procedures to assess whether in all material respects the financial <strong>report</strong> presents fairly, in accordance with the<br />
Corporations Act 2001 and Australian Accounting Standards, a true and fair view which is consistent with our understanding of the<br />
Company’s and the Group’s financial position and of their performance.<br />
We believe that the audit evidence we have obtained is sufficient and appropriate to provide a basis for our audit opinion.<br />
page 47
IOOF | <strong>annual</strong> <strong>report</strong> <strong>2011</strong><br />
Independent auditor’s <strong>report</strong><br />
For the year ended 30 June <strong>2011</strong> (cont’d)<br />
Independence<br />
In conducting our audit, we have complied with the independence requirements of the Corporations Act 2001.<br />
Auditor’s opinion<br />
In our opinion:<br />
(a) the financial <strong>report</strong> of IOOF Holdings Ltd is in accordance with the Corporations Act 2001, including:<br />
(i)<br />
giving a true and fair view of the Company’s and the Group’s financial position as at 30 June <strong>2011</strong> and of their performance for<br />
the year ended on that date; and<br />
(ii) complying with Australian Accounting Standards and the Corporations Regulations 2001.<br />
(b) the financial <strong>report</strong> also complies with International Financial Reporting Standards as disclosed in note 2(a).<br />
Report on the remuneration <strong>report</strong><br />
We have audited the Remuneration Report included in pages 29 to 44 of the directors’ <strong>report</strong> for the year ended 30 June <strong>2011</strong>.<br />
The directors of the company are responsible for the preparation and presentation of the remuneration <strong>report</strong> in accordance with<br />
Section 300A of the Corporations Act 2001. Our responsibility is to express an opinion on the remuneration <strong>report</strong>, based on our audit<br />
conducted in accordance with auditing standards.<br />
Auditor’s opinion<br />
In our opinion, the remuneration <strong>report</strong> of IOOF Holdings Ltd for the year ended 30 June <strong>2011</strong>, complies with Section 300A of the<br />
Corporations Act 2001.<br />
KPMG<br />
Michelle Hinchliffe<br />
Partner<br />
Melbourne<br />
25 August <strong>2011</strong><br />
KPMG, an Australian partnership and a member firm of the KPMG network of<br />
independent member fims affiliated with KPMG International Cooperative<br />
(“KPMG International”), a Swiss entity.<br />
page 48
Statement of comprehensive income<br />
For the year ended 30 June <strong>2011</strong><br />
IOOF | <strong>annual</strong> <strong>report</strong> <strong>2011</strong><br />
Consolidated Parent<br />
<strong>2011</strong> 2010 <strong>2011</strong> 2010<br />
Note $’000 $’000 $’000 $’000<br />
Revenue 8 642,649 626,678 132,422 67,156<br />
Expenses 9 (512,774) (524,297) (671) (1,470)<br />
Life insurance revenue 40(d) 85,260 70,682 - -<br />
Life insurance expense 40(e) (71,649) (73,821) - -<br />
Share of profits of associates accounted for using the<br />
9,201 7,588 - -<br />
equity method (net of income tax)<br />
Finance costs 10 (761) (1,096) (467) (719)<br />
Profit before income tax expense 151,926 105,734 131,284 64,967<br />
Income tax (expense)/benefit - shareholder 11 (37,525) (28,259) 44 1,780<br />
Income tax (expense)/benefit - statutory benefit funds (13,622) 3,310 - -<br />
Profit for the period 100,779 80,785 131,328 66,747<br />
Other comprehensive income<br />
Net change in fair value of available-for-sale financial 27 5,398 2,953 - -<br />
assets<br />
Net change in fair value of share buy back liability 27 (10,112) (9,139) - -<br />
Income tax on other comprehensive income 11 (1,866) (1,643) - -<br />
Other comprehensive income/(expense) for the period,<br />
(6,580) (7,829) - -<br />
net of income tax<br />
Total comprehensive income for the period 94,199 72,956 131,328 66,747<br />
Profit attributable to:<br />
Owners of the Company 99,489 77,371 131,328 66,747<br />
Policyholders of the IOOF Life Ltd Statutory Fund (11) 171 - -<br />
Non-controlling interest 1,301 3,243 - -<br />
Profit for the period 100,779 80,785 131,328 66,747<br />
Total comprehensive income attributable to:<br />
Owners of the Company 92,909 69,542 131,328 66,747<br />
Policyholders of the IOOF Life Ltd Statutory Fund (11) 171 - -<br />
Non-controlling interest 1,301 3,243 - -<br />
Total comprehensive income for the period 94,199 72,956 131,328 66,747<br />
Earnings per share:<br />
Basic earnings per share (cents per share) 30 43.1 33.7<br />
Diluted earnings per share (cents per share) 30 42.9 33.6<br />
Notes to the financial statements are included on pages 54 to 113.<br />
page 49
IOOF | <strong>annual</strong> <strong>report</strong> <strong>2011</strong><br />
Statement of financial position<br />
As at 30 June <strong>2011</strong><br />
Consolidated Parent<br />
<strong>2011</strong> 2010 2009 <strong>2011</strong> 2010<br />
Note $’000 $’000 $’000 $’000 $’000<br />
Assets<br />
Cash and cash equivalents 12 152,999 132,780 132,123 45,959 617<br />
Receivables 13 73,068 67,668 105,614 14,342 11,547<br />
Current tax assets - - 1,961 - -<br />
Other financial assets 14 60,573 47,754 40,565 912,479 884,902<br />
Investments backing policyholder 40 968,017 1,023,476 979,344 - -<br />
liabilities<br />
Other assets 15 24,961 27,808 31,298 - -<br />
Investments in equity-accounted 16 14,739 12,891 10,317 - -<br />
investees<br />
Property and equipment 17 12,553 8,165 12,621 - -<br />
Goodwill 18 491,856 491,856 479,455 - -<br />
Other intangible assets 19 258,997 276,694 290,445 - -<br />
Deferred tax assets 20 - 10,657 16,752 - 778<br />
Total assets 2,057,763 2,099,749 2,100,495 972,780 897,844<br />
Liabilities<br />
Payables 21 50,664 48,401 112,546 70 80<br />
Borrowings 22 38 14,628 30,714 10,000 10,000<br />
Current tax liabilities 32,108 23,093 - 29,387 20,563<br />
Other financial liabilities 23 43,112 37,357 18,085 - -<br />
Provisions 24 40,379 45,588 48,057 - 550<br />
Deferred tax liabilities 20 4,074 - - 13,113 -<br />
Other liabilities 25 17,393 20,998 24,688 - -<br />
Policy liabilities 40 968,017 1,022,730 978,768 - -<br />
Total liabilities 1,155,785 1,212,795 1,212,858 52,570 31,193<br />
Net assets 901,978 886,954 887,637 920,210 866,651<br />
Equity<br />
Share capital 26 868,451 858,178 849,609 868,451 858,628<br />
Reserves 27 (7,756) (3,324) 6,186 8,246 5,903<br />
Retained earnings 28 25,126 15,583 14,388 43,513 2,120<br />
Total equity attributable to equity<br />
885,821 870,437 870,183 920,210 866,651<br />
holders of the Company<br />
Non-controlling interest 16,157 16,517 17,454 - -<br />
Total equity 901,978 886,954 887,637 920,210 866,651<br />
Notes to the financial statements are included on pages 54 to 113.<br />
page 50
Statement of changes in equity<br />
IOOF | <strong>annual</strong> <strong>report</strong> <strong>2011</strong><br />
For the year ended 30 June <strong>2011</strong><br />
Note<br />
Share<br />
capital<br />
Reserves<br />
Consolidated – <strong>2011</strong> Consolidated – 2010<br />
Retained<br />
earnings<br />
Total<br />
interest<br />
Total<br />
equity<br />
Share<br />
capital<br />
Reserves Retained<br />
earnings<br />
Total<br />
Noncontrolling<br />
Noncontrolling<br />
interest<br />
$’000 $’000 $’000 $’000 $’000 $’000 $’000 $’000 $’000 $’000 $’000 $’000<br />
Opening balance at 1 July 2010 26,27,28 858,178 (3,324) 15,583 870,437 16,517 886,954 849,609 6,186 14,388 870,183 17,454 887,637<br />
Total comprehensive income for the period<br />
Profit for the period<br />
- - 99,489 99,489 1,301 100,790 - - 77,371 77,371 3,243 80,614<br />
attributable to owners of the<br />
Company<br />
Loss for the period attributable<br />
- - (11) (11) - (11) - - 171 171 - 171<br />
to policyholders of the IOOF<br />
Life Ltd Statutory Fund<br />
Other comprehensive income<br />
Net change in fair value of<br />
- 5,398 - 5,398 - 5,398 - 2,953 - 2,953 - 2,953<br />
available-for-sale financial<br />
assets<br />
Net change in fair value of<br />
- (10,112) - (10,112) - (10,112) - (9,139) - (9,139) - (9,139)<br />
share buy back liability<br />
Income tax on other<br />
- (1,866) - (1,866) - (1,866) - (1,643) - (1,643) - (1,643)<br />
comprehensive income<br />
Total other comprehensive<br />
- (6,580) - (6,580) - (6,580) - (7,829) - (7,829) - (7,829)<br />
income<br />
Total comprehensive<br />
- (6,580) 99,478 92,898 1,301 94,199 - (7,829) 77,542 69,713 3,243 72,956<br />
income for the period<br />
Transactions with owners, recorded directly in equity<br />
Contributions by and (distributions to) owners<br />
Dividends to equity holders - - (89,935) (89,935) (1,567) (91,502) - - (77,841) (77,841) (3,632) (81,473)<br />
Share-based payment expense - 3,232 - 3,232 - 3,232 - 2,027 - 2,027 - 2,027<br />
Issue of shares on exercise of<br />
9,464 - - 9,464 - 9,464 1,670 - - 1,670 - 1,670<br />
options under executive and<br />
employee share option plan<br />
Transfer from employee<br />
440 (440) - - - - 120 (120) - - - -<br />
equity-settled benefits reserve<br />
on exercise of options<br />
Employee performance rights<br />
330 (330) - - - - 3,053 (3,053) - - - -<br />
vested during the year<br />
Adviser performance rights<br />
453 (453) - - - - 234 (234) - - - -<br />
vested during the year<br />
On-market purchase of<br />
(414) - - (414) - (414) 3,492 - 1,494 4,986 - 4,986<br />
treasury shares transferred to<br />
employees during the year<br />
Treasury shares transferred to<br />
- - - - - - - - - - - -<br />
employees during the year<br />
Total contributions by and<br />
10,273 2,009 (89,935) (77,653) (1,567) (79,220) 8,569 (1,380) (76,347) (69,158) (3,632) (72,790)<br />
distributions to owners<br />
Changes in ownership interests in subsidiaries that do not result in a loss of control<br />
Issue of additional noncontrolling<br />
- - - - 45 45 - (301) - (301) 533 232<br />
interests<br />
Derecognition of noncontrolling<br />
- 139 - 139 (139) - - - - - (1,081) (1,081)<br />
interest subject to<br />
buy-back<br />
Total changes in ownership<br />
- 139 - 139 (94) 45 - (301) - (301) (548) (849)<br />
interests in subsidiaries<br />
Total transactions with owners 10,273 2,148 (89,935) (77,514) (1,661) (79,175) 8,569 (1,681) (76,347) (69,459) (4,180) (73,639)<br />
Balance at 30 June <strong>2011</strong> 26,27,28 868,451 (7,756) 25,126 885,821 16,157 901,978 858,178 (3,324) 15,583 870,437 16,517 886,954<br />
Notes to the financial statements are included on pages 54 to 113<br />
Total<br />
equity<br />
page 51
IOOF | <strong>annual</strong> <strong>report</strong> <strong>2011</strong><br />
Statement of changes in equity<br />
For the year ended 30 June <strong>2011</strong><br />
Parent – <strong>2011</strong> Parent – 2010<br />
Note Share<br />
capital<br />
Reserves<br />
Retained<br />
earnings<br />
Total<br />
equity<br />
Share<br />
capital<br />
Reserves<br />
Retained<br />
earnings<br />
Total<br />
equity<br />
$’000 $’000 $’000 $’000 $’000 $’000 $’000 $’000<br />
Opening balance at 1 July 26,27,28 858,628 5,903 2,120 866,651 855,108 7,642 13,569 876,319<br />
Total comprehensive income for the period<br />
Profit for the period - - 131,328 131,328 - - 66,747 66,747<br />
Other comprehensive income - - - - - - - -<br />
Total comprehensive income<br />
for the period<br />
- - 131,328 131,328 - - 66,747 66,747<br />
Transactions with owners, recorded directly in equity<br />
Contributions by and<br />
(distributions to) owners<br />
Dividends to equity holders - - (89,935) (89,935) - - (78,196) (78,196)<br />
Share-based payment<br />
expense recognised in<br />
controlled entities<br />
Issue of shares on exercise of<br />
options under executive and<br />
employee share option plan<br />
On-market purchase of<br />
treasury shares transferred to<br />
employees during the year<br />
Transfer from employee<br />
equity-settled benefits reserve<br />
on exercise of options<br />
Employee performance rights<br />
vested during the year<br />
Adviser performance rights<br />
vested during the year<br />
Total contributions by and<br />
(distributions to) owners<br />
- 3,098 - 3,098 - 1,895 - 1,895<br />
9,464 - - 9,464 1,670 - - 1,670<br />
(396) - - (396) 347 (347) - -<br />
1,049 (1,049) - - 3,053 (3,053) - -<br />
330 (330) - - 234 (234) - -<br />
453 (453) - - (1,784) - - (1,784)<br />
10,900 1,266 (89,935) (77,769) 3,520 (1,739) (78,196) (76,415)<br />
Total transactions with owners 10,900 1,266 (89,935) (77,769) 3,520 (1,739) (78,196) (76,415)<br />
Balance at 30 June 26,27,28 869,528 7,169 43,513 920,210 858,628 5,903 2,120 866,651<br />
Notes to the financial statements are included on pages 54 to 113.<br />
page 52
Statement of cash flows<br />
For the year ended 30 June <strong>2011</strong><br />
IOOF | <strong>annual</strong> <strong>report</strong> <strong>2011</strong><br />
Consolidated Parent<br />
<strong>2011</strong> 2010 <strong>2011</strong> 2010<br />
$’000 $’000 $’000 $’000<br />
Cash flows from operating activities<br />
Receipts from customers 689,929 673,284 6,219 327<br />
Payments to suppliers and employees (554,160) (577,346) (609) (3,676)<br />
Interest and other costs of finance paid (761) (1,096) (467) (719)<br />
Net stockbroking purchases (276) 3,346 - -<br />
Dividends received from associates 9,378 6,353 - -<br />
Income taxes paid (21,913) (11,860) (12,856) (632)<br />
Fund manager rebates paid to subsidiaries - - (6,029) (183)<br />
Net cash provided by/(used in) operating activities 38(b) 122,197 92,681 (13,742) (4,883)<br />
Cash flows from investing activities<br />
Interest received 9,115 5,493 2,459 1,971<br />
Dividends and distributions received 1,843 1,971 129,912 64,218<br />
Net proceeds/(payments) from sales or purchases of financial<br />
(580) (1,074) - -<br />
assets<br />
Payments for property, plant and equipment (8,373) (1,162) - -<br />
Proceeds on disposal of property, plant and equipment 77 44 - -<br />
Amounts (advanced to)/borrowed from other entities (617) 714 8,048 10,125<br />
Proceeds on sale of life policies 220 - - -<br />
Payments for intangible assets (283) (5,334) - -<br />
Proceeds on disposal of Macarthur Cook investment - - - 1,484<br />
Net cash flow on disposal of Intech business - 451 - -<br />
Interests acquired in associates and non-controlling interests (1,980) (1,640) (864) -<br />
Net cash provided by/(used in) investing activities (578) (537) 139,555 77,798<br />
Cash flows from financing activities<br />
Repayment of borrowings (14,590) (16,086) - -<br />
Proceeds on disposal of treasury shares - 6,048 - -<br />
On-market purchase of treasury shares transferred to<br />
(414) - - -<br />
employees during the year<br />
Proceeds from issues of equity securities on exercise of<br />
9,464 1,675 9,464 1,675<br />
options<br />
Dividends paid:<br />
- members of the Company (89,936) (77,841) (89,935) (78,197)<br />
- non-controlling members of subsidiary entities (1,567) (3,632) - -<br />
- shareholders entitled to contractual share buy-back (4,357) (1,650) - -<br />
Net cash provided by/(used in) financing activities (101,400) (91,486) (80,471) (76,522)<br />
Net increase/(decrease) in cash and cash equivalents 20,219 658 45,342 (3,607)<br />
Cash and cash equivalents at the beginning of the<br />
132,780 132,122 617 4,224<br />
financial year<br />
Cash and cash equivalents at the end of the financial year 152,999 132,780 45,959 617<br />
Notes to the financial statements are included on pages 54 to 113<br />
page 53
IOOF | <strong>annual</strong> <strong>report</strong> <strong>2011</strong><br />
Notes to the financial statements<br />
For the year ended 30 June <strong>2011</strong><br />
1 Reporting entity<br />
IOOF Holdings Ltd (the “Company”) is a company domiciled<br />
in Australia. The consolidated financial statements of the<br />
Company as at and for the year ended 30 June <strong>2011</strong> comprise<br />
the Company and its subsidiaries (together referred to as the<br />
“Group”) and the Group’s interest in associates. The Group<br />
primarily is involved in the provision of wealth management<br />
services.<br />
The Company’s registered office and its principal place of<br />
business are as follows:<br />
Registered office and principal place of business<br />
Level 6, 161 Collins Street, Melbourne, VIC 3000<br />
2 Basis of preparation<br />
(a) Statement of compliance<br />
The consolidated financial statements are general purpose<br />
financial statements which have been prepared in accordance<br />
with Australian Accounting Standards (AASBs) adopted by<br />
the Australian Accounting Standards Board (AASB) and the<br />
Corporations Act 2001. The consolidated financial statements<br />
comply with International Financial Reporting Standards (IFRS)<br />
adopted by the International Accounting Standards Board (IASB).<br />
The consolidated financial statements were authorised for issue<br />
by the Board of Directors on 25 August <strong>2011</strong>.<br />
(b) Basis of measurement<br />
The consolidated financial statements have been prepared on<br />
the historical cost basis except for the following material items in<br />
the statement of financial position:<br />
• financial instruments at fair value through profit or loss are<br />
measured at fair value;<br />
• available-for-sale financial assets are measured at fair value;<br />
and<br />
• share-buy back liabilities are measured at fair value.<br />
The statement of financial position is presented in order of<br />
liquidity.<br />
(c)<br />
Functional and presentation currency<br />
These consolidated financial statements are presented in<br />
Australian dollars, which is the Company’s functional currency.<br />
The Company is of a kind referred to in ASIC Class Order 98/100<br />
dated 10 July 1998 and in accordance with that Class Order, all<br />
financial information presented in Australian dollars has been<br />
rounded to the nearest thousand unless otherwise stated.<br />
Amounts included in narratives are expressed as whole dollars<br />
but rounded to the nearest thousand unless otherwise stated.<br />
(d) Use of estimates and judgements<br />
The preparation of financial statements in conformity with<br />
AASBs requires management to make judgements, estimates<br />
and assumptions that affect the application of accounting<br />
policies and the <strong>report</strong>ed amounts of assets, liabilities, income<br />
and expenses. Actual results may differ from these estimates.<br />
Estimates and underlying assumptions are reviewed on<br />
an ongoing basis. Revisions to accounting estimates are<br />
recognised in the period in which the estimates are revised<br />
and in any future periods affected.<br />
Information about critical judgements in applying accounting<br />
policies that have the most significant effect on the amounts<br />
recognised in the financial statements is included in the<br />
following notes:<br />
• note 3 (o)(i) - utilisation of tax losses and uncertain tax<br />
position<br />
• note 3(q) - Deferred acquisition costs<br />
• note 3(w) - Liability to buy back vested shares<br />
• note 18 - Goodwill<br />
• note 19 - Other intangible assets<br />
• note 31 - Share-based payments<br />
Information about assumptions and estimation uncertainties<br />
that have a significant risk of resulting in a material adjustment<br />
within the next financial year are included in the following<br />
notes:<br />
• note 18 & 19 - key assumptions used in discounted cash<br />
flow projections<br />
• note 24 & 37 - provisions and contingencies.<br />
(e) Changes in accounting policies<br />
From 1 July 2010 the Group has applied amendments to<br />
AASB 101 Presentation of Financial Statements outlined in<br />
AASB 2010-4 Further amendments to Australian Accounting<br />
Standards arising from the Annual Improvements Project.<br />
The change in accounting policy only relates to disclosures<br />
and has had no impact on consolidated earnings per share or<br />
net income. The changes have been applied retrospectively<br />
and allow the Group to disclose transactions recognised in<br />
other comprehensive income in the note 27 to the financial<br />
statements.<br />
From 1 July 2010 the Group has adopted a change in<br />
accounting policy for the recognition of the movement<br />
in liabilities to buy back vested shares. Under the previous<br />
accounting policy, the changes in the fair value of the liability<br />
was recorded in profit or loss. The change in accounting<br />
policy is to recognise these movements in a share buy back<br />
revaluation reserve which more accurately reflects the nature<br />
page 54
IOOF | <strong>annual</strong> <strong>report</strong> <strong>2011</strong><br />
of the underlying instrument. The liability to buy back vested<br />
shares is measured and recognised in accordance with AASB<br />
139 Financial Instruments: Recognition and Measurement<br />
precluding any adjustment for the probability that settlement<br />
of the liability will occur. The directors have assessed the<br />
probability that the Group will be required to settle the<br />
share buy back liability as low and therefore recognition of<br />
movements in the reserve provides users with increased<br />
relevance and reliability of the financial performance of the<br />
Group.<br />
This change in accounting policy has had an effect on<br />
consolidated earnings per share and on net profit, further<br />
information is provided in note 4 Change in accounting policy.<br />
3 Significant accounting policies<br />
The accounting policies set out below have been applied<br />
consistently to all periods presented in these consolidated<br />
financial statements, and have been applied consistently by<br />
Group entities.<br />
Certain comparative amounts have been reclassified to<br />
conform with the current year’s presentation.<br />
(a) Basis of consolidation<br />
The consolidated financial statements incorporate the assets<br />
and liabilities of all subsidiaries of the Company as at 30 June<br />
<strong>2011</strong> and the results of all controlled subsidiaries for the year<br />
then ended. This includes the benefit funds of its subsidiary,<br />
IOOF Ltd, and any controlled trusts.<br />
Control of an entity is identified where the Group has the<br />
power to govern the financial and operating policies of that<br />
entity so as to obtain benefits from its activities, generally<br />
accompanying a shareholding of more than half of the voting<br />
rights.<br />
The benefit funds, and any trusts controlled by those funds, are<br />
treated as statutory funds in accordance with the Life Insurance<br />
Act 1995. These statutory funds, in addition to the statutory<br />
funds of the life insurance business conducted by the Group,<br />
are shown separately from shareholder funds in the notes to<br />
the financial statements.<br />
Refer to Note 3(k) Contract classification for information in<br />
relation to the different accounting treatment of investment<br />
contracts with discretionary participating features.<br />
(i)<br />
Business combinations<br />
Business combinations are accounted for using the acquisition<br />
method as at the acquisition date, which is the date on which<br />
control is transferred to the Group.<br />
Acquisitions on or after 1 July 2009<br />
For acquisitions on or after 1 July 2009, the Group measures<br />
goodwill at the acquisition date as:<br />
• the fair value of the consideration transferred; plus<br />
• the recognised amount of any non-controlling interests in<br />
the acquiree; plus if the business combination is achieved<br />
in stages, the fair value of the existing equity interest in the<br />
acquiree; less<br />
• the net recognised amount (generally fair value) of the<br />
identifiable assets acquired and liabilities assumed.<br />
When the excess is negative, a bargain purchase gain is<br />
recognised immediately in profit or loss.<br />
The consideration transferred does not include amounts<br />
related to the settlement of pre-existing relationships. Such<br />
amounts are generally recognised in profit or loss.<br />
Costs related to the acquisition, other than those associated<br />
with the issue of debt or equity securities, that the Group<br />
incurs in connection with a business combination are<br />
expensed as incurred.<br />
Any contingent consideration payable is recognised at fair<br />
value at the acquisition date. If the contingent consideration<br />
is classified as equity, it is not remeasured and settlement is<br />
accounted for within equity. Otherwise, subsequent changes<br />
to the fair value of the contingent consideration are recognised<br />
in profit or loss.<br />
When share-based payment awards (replacement awards) are<br />
required to be exchanged for awards held by the acquiree’s<br />
employees (acquiree’s awards) and relate to past services, then<br />
all or a portion of the amount of the acquiree’s replacement<br />
awards is included in measuring the consideration transferred<br />
in the business combination. This determination is based on<br />
the market-based value of the replacement awards compared<br />
with the market-based value of the acquiree’s awards and the<br />
extent to which the replacement awards relate to past and/or<br />
future service.<br />
Acquisitions between 1 July 2004 and 1 July 2009<br />
For acquisitions between 1 July 2004 and 1 July 2009, goodwill<br />
represents the excess of the cost of the acquisition over the<br />
Group’s interest in the recognised amount (generally fair value)<br />
of the identifiable assets, liabilities and contingent liabilities<br />
of the acquiree. When the excess was a negative, a bargain<br />
purchase gain was recognised immediately in profit or loss.<br />
Transaction costs, other than those associated with the<br />
issue of debt or equity securities, that the Group incurred in<br />
connection with the business combinations were capitalised<br />
as part of the cost of the acquisition.<br />
page 55
IOOF | <strong>annual</strong> <strong>report</strong> <strong>2011</strong><br />
Notes to the financial statements (cont’d)<br />
For the year ended 30 June <strong>2011</strong><br />
Acquisitions prior to 1 July 2004 (date of transition<br />
to IFRS’s)<br />
As part of its transition to IFRS’s, the Group elected to restate<br />
only those business combinations that occurred on or after<br />
1 July 2003. In respect of acquisitions prior to 1 July 2003,<br />
goodwill represents the amount recognised under the Group’s<br />
previous accounting framework, Australian GAAP.<br />
Non-controlling interests<br />
Acquisitions of non-controlling interests are accounted for<br />
as transactions with owners in their capacity as owners<br />
and therefore no goodwill is recognised as a result of such<br />
transactions. The adjustments to non-controlling interests<br />
are based on a proportionate amount of the net assets of the<br />
subsidiary.<br />
(ii)<br />
Subsidiaries<br />
Subsidiaries are entities controlled by the Group. The financial<br />
statements of subsidiaries are included in the consolidated<br />
financial statements from the date that control commences<br />
until the date that control ceases.<br />
Losses applicable to the non-controlling interests in a<br />
subsidiary are allocated to the non-controlling interests even if<br />
doing so causes the non-controlling interests to have a deficit<br />
balance.<br />
(iii) Employee Share Trust<br />
The Group has formed a trust to administer the Group’s<br />
employee share scheme. This trust is consolidated, as the<br />
substance of the relationship is that the trust is controlled by<br />
the Group. Shares held by the IOOF Executive Performance<br />
Share Plan Trust are disclosed as treasury shares and are<br />
deducted from share capital.<br />
(iv) Investments in associates (equity accounted<br />
investees)<br />
Associates are those entities over which the Group has<br />
significant influence, but not control, over the financial and<br />
operating policies. Significant influence is presumed to exist<br />
when the Group holds between 20 and 50 per cent of the<br />
voting power of another entity.<br />
Investments in its associates are accounted for using the<br />
equity method (equity-accounted investees) and are initially<br />
recognised at cost. The cost of the investment includes<br />
transaction costs.<br />
The consolidated financial statements include the Group’s<br />
share of the profit or loss and other comprehensive income,<br />
after adjustments to align the accounting policies with<br />
those of the Group, from the date that significant influence<br />
commences until the date that significant influence ceases.<br />
When the Group’s share of losses exceeds its interest in an<br />
equity accounted investee, the carrying amount of that<br />
interest, including any long-term investments, is reduced to<br />
nil, and the recognition of further losses is discontinued except<br />
to the extent that the Group has an obligation or has made<br />
payments on behalf of the investee.<br />
(v) Transactions eliminated on consolidation<br />
Intra-group balances and transactions, and any unrealised<br />
income and expenses arising from intra-group transactions, are<br />
eliminated in preparing the consolidated financial statements.<br />
Unrealised gains arising from transactions with equity<br />
accounted investees are eliminated against the investment to<br />
the extent of the Group’s interest in the investee. Unrealised<br />
losses are eliminated in the same way as unrealised gains, but<br />
only to the extent that there is no evidence of impairment.<br />
(b) Foreign currency transactions<br />
Transactions in foreign currencies are translated to the<br />
respective functional currencies of the Group entities at<br />
exchange rates at the dates of the transactions. Monetary<br />
assets and liabilities denominated in foreign currencies at the<br />
<strong>report</strong>ing date are retranslated to the functional currency at<br />
the exchange rate at that date. The foreign currency gain or<br />
loss on monetary items is the difference between amortised<br />
cost in the functional currency at the beginning of the period,<br />
adjusted for effective interest and payments during the period,<br />
and the amortised cost in foreign currency translated at the<br />
exchange rate at the end of the year.<br />
Non-monetary assets and liabilities denominated in foreign<br />
currencies that are measured at fair value are retranslated<br />
to the functional currency at the exchange rate at the date<br />
the fair value was determined. Non-monetary items in a<br />
foreign currency that are measured in terms of historical<br />
cost are translated using the exchange rate at the date of<br />
the transaction. Foreign currency differences arising on<br />
the retranslation are recognised in profit or loss, except<br />
for differences arising on the retranslation of available-forsale<br />
equity instruments, which are recognised in other<br />
comprehensive income.<br />
(c) Cash and cash equivalents<br />
Cash and cash equivalents includes cash on hand, deposits<br />
held at call with financial institutions, other short-term, highly<br />
liquid investments with original maturities of three months or<br />
less that are readily convertible to known amounts of cash and<br />
which are subject to an insignificant risk of changes in value<br />
and bank overdrafts.<br />
page 56
IOOF | <strong>annual</strong> <strong>report</strong> <strong>2011</strong><br />
(d) Financial instruments<br />
(i)<br />
Non-derivative financial assets<br />
The Group initially recognises loans and receivables and<br />
deposits on the date that they are originated. All other financial<br />
assets (including assets designated at fair value through<br />
profit or loss) are recognised initially on the date at which the<br />
Group becomes a party to the contractual provisions of the<br />
instrument.<br />
The Group derecognises a financial asset when the contractual<br />
rights to the cash flows from the asset expire, or it transfers the<br />
rights to receive the contractual cash flows on the financial<br />
asset in a transaction in which substantially all the risks and<br />
rewards of ownership of the financial asset are transferred. Any<br />
interest in transferred financial assets that is created or retained<br />
by the Group is recognised as a separate asset or liability.<br />
Financial assets and liabilities are offset and the net amount<br />
presented in the statement of financial position, when and<br />
only when, the Group has a legal right to offset the amounts<br />
and intends either to settle on a net basis or to realise the asset<br />
and settle the liability simultaneously.<br />
The group has the following non-derivative financial assets:<br />
• financial assets at fair value through profit or loss;<br />
• loans and receivables; and<br />
• available-for-sale financial assets.<br />
Financial assets at fair value through profit or loss<br />
A financial asset is classified as at fair value through profit<br />
or loss if it is classified as held for trading or is designated as<br />
such upon initial recognition. Financial assets are designated<br />
at fair value through profit or loss if the Group manages such<br />
investments and makes purchase and sale decisions based on<br />
their fair value in accordance with the Group’s documented risk<br />
management or investment strategy. Upon initial recognition<br />
attributable transaction costs are recognised in profit or loss<br />
when incurred. Financial assets at fair value through profit<br />
or loss are measured at fair value, and changes therein are<br />
recognised in profit or loss.<br />
Loans and receivables<br />
Loans and receivables are non-derivative financial assets with<br />
fixed or determinable payments that are not quoted on an<br />
active market. They arise when the Group provides money,<br />
assets, or services directly to a debtor with no intention of<br />
selling the receivable. Subsequent to initial recognition, loans<br />
and receivables are measured at amortised cost using the<br />
effective interest method, less any impairment losses.<br />
Available-for-sale financial assets<br />
Available-for-sale financial assets are non-derivative assets<br />
comprising principally marketable equity securities that are<br />
either designated in this category or are not classified in any of<br />
the other categories of financial instruments. Subsequent to<br />
initial recognition, they are measured at fair value and changes<br />
therein, other than impairment losses, are recognised in other<br />
comprehensive income and presented within equity in the<br />
available-for-sale investment revaluation reserve. When an<br />
investment is derecognised, the cumulative gain or loss in<br />
equity is transferred to profit or loss.<br />
Available-for-sale financial assets comprise equity securities.<br />
(ii)<br />
Financial assets backing policy liabilities<br />
The Group has determined that all financial assets held within<br />
its <strong>report</strong>ed statutory funds (including the benefit funds which<br />
are treated as statutory funds) represent the assets backing<br />
policy liabilities and are measured at fair value through profit<br />
or loss. Other than loans and receivables and available for sale<br />
financial assets held by the Group and its controlled entities,<br />
assets backing policy liabilities have been designated at fair<br />
value through profit or loss as the assets are managed on a fair<br />
value basis.<br />
(iii) Non-derivative financial liabilities<br />
The Group initially recognises financial liabilities on the date<br />
at which the Group becomes a party to the contractual<br />
provisions of the instrument. The Group derecognises<br />
a financial liability when its contractual obligations are<br />
discharged, cancelled or expire. Financial assets and liabilities<br />
are offset and the net amount presented in the statement<br />
of financial position when, and only when, the Group has a<br />
legal right to offset the amounts and intends either to settle<br />
on a net basis or to realise the asset and settle the liability<br />
simultaneously.<br />
The Group has the following non-derivative financial liabilities:<br />
loans and borrowings and payables.<br />
Such financial liabilities are recognised initially at fair value plus<br />
any directly attributable transaction costs. Subsequent to initial<br />
recognition these financial liabilities are measured at amortised<br />
cost using the effective interest method.<br />
(iv) Other financial liabilities<br />
Purchase commitments to reacquire interests from noncontrolling<br />
shareholders are accounted for in accordance with<br />
AASB 132 Financial Instruments: Presentation which specifies<br />
that an obligation for an entity to purchase its own equity<br />
instruments for cash gives rise to a financial liability. The<br />
liability is measured at the present value of the redemption<br />
amount irrespective of the probability of the exercise of the<br />
right by non-controlling shareholders.<br />
page 57
IOOF | <strong>annual</strong> <strong>report</strong> <strong>2011</strong><br />
Notes to the financial statements (cont’d)<br />
For the year ended 30 June <strong>2011</strong><br />
(v) Share capital<br />
Ordinary shares<br />
Ordinary shares are classified as equity. Incremental costs<br />
directly attributable to the issue of new shares and share<br />
options are shown in equity as a deduction, net of any tax<br />
effects.<br />
Repurchase, disposal and reissue of share capital<br />
(treasury shares)<br />
When share capital recognised as equity is repurchased, the<br />
amount of the consideration paid, which includes directly<br />
attributable costs, net of any tax effects, is recognised as a<br />
deduction from equity. Repurchased shares are classified as<br />
treasury shares and are presented as a deduction from total<br />
equity. When treasury shares are sold or reissued subsequently,<br />
the amount received is recognised as an increase in equity, and<br />
the resulting surplus or deficit on the transaction is transferred<br />
to/from retained earnings.<br />
(e) Property and equipment<br />
(i)<br />
Recognition and measurement<br />
Property and equipment are measured at cost less any<br />
accumulated depreciation and any accumulated impairment<br />
losses.<br />
Cost includes expenditure that is directly attributable to the<br />
acquisition of the asset.<br />
The gain or loss on disposal of an item of property and<br />
equipment is determined by comparing the proceeds from<br />
disposal with the carrying amount of the property and<br />
equipment and is recognised net within other income/other<br />
expenses in profit or loss. When revalued assets are sold,<br />
any related amount included in the revaluation reserve is<br />
transferred to retained earnings.<br />
(ii)<br />
Subsequent costs<br />
Subsequent costs are included in the asset’s carrying amount<br />
or recognised as a separate asset, as appropriate, only when it<br />
is probable that future economic benefits associated with the<br />
item will flow to the Group and the cost of the item can be<br />
measured reliably. Repairs and maintenance costs are charged<br />
to profit or loss during the financial period in which they are<br />
incurred.<br />
(iii) Depreciation<br />
Depreciation is based on the cost of the asset less its residual<br />
value. Significant components of individual assets are assessed<br />
and if a component has a useful life that is different from<br />
the remainder of that asset, that component is depreciated<br />
separately.<br />
Depreciation is recognised in profit or loss on a straight-line<br />
basis over the estimated useful lives of each component<br />
of an item of property and equipment. Leased assets are<br />
depreciated over the shorter of the lease term and their useful<br />
lives unless it is reasonably certain that the Group will obtain<br />
ownership by the end of the lease term.<br />
The estimated useful lives for the current and comparative year<br />
are as follows:<br />
• office equipment 3-10 years<br />
• leasehold improvements 3-10 years<br />
• equipment under finance lease 3-10 years<br />
Depreciation methods, useful lives and residual values are<br />
reviewed at each <strong>report</strong>ing date, and adjusted if appropriate.<br />
(f)<br />
(i)<br />
Intangible assets<br />
Goodwill<br />
For the measurement of goodwill at initial recognition, see<br />
note 3(a)(i) Business combinations.<br />
Subsequent measurement<br />
Goodwill is measured at cost less accumulated impairment<br />
losses. In respect of equity-accounted investees, the carrying<br />
amount of goodwill is included in the carrying amount the<br />
investment, and impairment loss on such investment is not<br />
allocated to any asset, including goodwill, that forms part of<br />
the carrying amount of the equity accounted investee.<br />
(ii)<br />
Other intangible assets<br />
Other intangible assets that are acquired by the Group and<br />
have finite useful lives are measured at cost less accumulated<br />
amortisation and accumulated impairment losses.<br />
(iii) Subsequent expenditure<br />
Subsequent expenditure is capitalised only when it increases<br />
the future economic benefits embodied in the specific asset to<br />
which it relates. All other expenditure, including expenditure<br />
on internally generated goodwill and brands, is recognised in<br />
profit or loss as incurred.<br />
(iv) Amortisation<br />
Amortisation is based on the cost of an asset less its residual<br />
value.<br />
Amortisation is recognised in profit or loss on a straight-line<br />
basis over the estimated useful lives of intangible assets, other<br />
than goodwill, from the date that they are available for use.<br />
page 58
IOOF | <strong>annual</strong> <strong>report</strong> <strong>2011</strong><br />
The estimated useful lives for the current and comparative years are<br />
as follows:<br />
• adviser relationships 5 - 10 years<br />
• computer software 2½ - 4 years<br />
• customer relationships 10 - 20 years<br />
• brand names 20 years<br />
• contract agreements 9 - 10 years.<br />
Amortisation methods, useful lives and residual values are reviewed<br />
at each <strong>report</strong>ing date and adjusted if appropriate.<br />
(g) Leased assets<br />
Leases in terms of which the Group assumes substantially all the risks<br />
and rewards of ownership are classified as finance leases. Upon initial<br />
recognition the leased asset is measured at an amount equal to the<br />
lower of its fair value and the present value of the minimum lease<br />
payments. Subsequent to initial recognition, the asset is accounted<br />
for in accordance with the accounting policy applicable to that asset.<br />
Other leases are operating leases and are not recognised in the<br />
Group’s statement of financial position.<br />
(h) Impairment<br />
(i)<br />
Non-derivative financial assets<br />
A financial asset not carried at fair value through profit or loss is<br />
assessed at each <strong>report</strong>ing date to determine whether there is<br />
objective evidence that it is impaired. A financial asset is impaired if<br />
objective evidence indicates that a loss event has occurred after the<br />
initial recognition of the asset, and that the loss event had a negative<br />
effect on the estimated future cash flows of that asset that can be<br />
estimated reliably.<br />
Objective evidence that financial assets (including equity securities)<br />
are impaired can include default or delinquency by a debtor,<br />
restructuring of an amount due to the Group on terms that the<br />
Group would not consider otherwise, indications that a debtor or<br />
issuer will enter bankruptcy, adverse changes in the payment status<br />
of borrowers or issuers in the Group, economic conditions that<br />
correlate with defaults or the disappearance of an active market<br />
of a security. In addition, for an investment in an equity security,<br />
a significant or prolonged decline in its fair value below its cost is<br />
objective evidence of impairment.<br />
An impairment loss in respect of a financial asset measured at<br />
amortised cost is calculated as the difference between its carrying<br />
amount and the present value of the estimated future cash flows<br />
discounted at the asset’s original effective interest rate. Losses are<br />
recognised in profit or loss and reflected as an allowance account<br />
against loans and receivables. Interest on the impaired asset continues<br />
to be recognised. When a subsequent event (eg. a repayment by<br />
a debtor) causes the amount of impairment loss to decrease, the<br />
decrease in impairment loss is reversed through profit or loss.<br />
Available-for-sale financial assets<br />
Impairment losses on available-for-sale financial assets are<br />
recognised by reclassifying the losses accumulated in the<br />
investment revaluation reserve, to profit or loss. The cumulative<br />
loss that is reclassified from equity to profit or loss is the<br />
difference between the acquisition cost, net of any principal<br />
repayment and amortisation, and the current fair value, less any<br />
impairment loss previously recognised in profit or loss.<br />
Changes in impairment provisions attributable to application<br />
of the effective interest method are reflected as a component<br />
of interest income. If, in a subsequent period, the fair value of<br />
an impaired available-for-sale debt security increases and the<br />
increase can be related objectively to an event occurring after<br />
the impairment loss was recognised in profit or loss, then the<br />
impairment loss is reversed, with the amount of the reversal<br />
recognised in profit or loss. However, any subsequent recovery<br />
in the fair value of an impaired available-for-sale equity security<br />
is recognised in other comprehensive income.<br />
(ii)<br />
Non-financial assets<br />
The carrying amounts of the Group’s non-financial assets, other<br />
than deferred tax assets, are reviewed at each <strong>report</strong>ing date<br />
to determine whether there is any indication of impairment. If<br />
any such indication exists, then the asset’s recoverable amount<br />
is estimated. For goodwill, and intangible assets that have<br />
indefinite useful lives or that are not yet available for use, the<br />
recoverable amount is estimated each year at the same time.<br />
An impairment loss is recognised if the carrying amount of<br />
an asset or its related cash-generating unit (CGU) exceeds its<br />
estimated recoverable amount.<br />
The recoverable amount of an asset or cash-generating unit is<br />
the greater of its value in use and its fair value less costs to sell.<br />
In assessing value in use, the estimated future cash flows are<br />
discounted to their present value using a pre-tax discount rate<br />
that reflects current market assessments of the time value of<br />
money and the risks specific to the asset. For the purpose of<br />
impairment testing, assets that cannot be tested individually<br />
are grouped together into the smallest group of assets that<br />
generates cash inflows from continuing use that are largely<br />
independent of the cash inflows from continuing use of other<br />
assets or groups of assets (the cash-generating unit “CGU”).<br />
Subject to an operating segment ceiling test, for the purposes<br />
of goodwill impairment testing, CGUs to which goodwill has<br />
been allocated are aggregated so that the level at which<br />
impairment is tested reflects the lowest level at which goodwill<br />
is monitored for internal <strong>report</strong>ing purposes. Goodwill acquired<br />
in a business combination is allocated to groups of CGUs that<br />
are expected to benefit from the synergies of the combination.<br />
Impairment losses are recognised in profit or loss. Impairment<br />
losses recognised in respect of CGUs are allocated first to reduce<br />
page 59
IOOF | <strong>annual</strong> <strong>report</strong> <strong>2011</strong><br />
Notes to the financial statements (cont’d)<br />
For the year ended 30 June <strong>2011</strong><br />
the carrying amount of any goodwill allocated to the units,<br />
and then to reduce the carrying amounts of the other assets in<br />
the unit (group of units) on a pro rata basis.<br />
An impairment loss in respect of goodwill is not reversed. In<br />
respect of other assets, impairment losses recognised in prior<br />
periods are assessed at each <strong>report</strong>ing date for any indications<br />
that the loss has decreased or no longer exists. An impairment<br />
loss is reversed if there has been a change in the estimates<br />
used to determine the recoverable amount. An impairment<br />
loss is reversed only to the extent that the asset’s carrying<br />
amount does not exceed the carrying amount that would have<br />
been determined, net of depreciation or amortisation, if no<br />
impairment loss had been recognised.<br />
Goodwill that forms part of the carrying amount of an<br />
investment in an associate is not recognised separately, and<br />
therefore is not tested for impairment separately. Instead, the<br />
entire amount of the investment in an associate is tested for<br />
impairment as a single asset when there is objective evidence<br />
that the investment in an associate may be impaired.<br />
(i)<br />
(i)<br />
Employee benefits<br />
Defined contribution plans<br />
A defined contribution plan is a post-employment benefit plan<br />
under which an entity pays fixed contributions into a separate<br />
entity and will have no legal or constructive obligation to pay<br />
further amounts. Obligations for contributions to defined<br />
contribution plans are recognised in profit or loss in the<br />
periods during which services are rendered by employees.<br />
Prepaid contributions are recognised as an asset to the<br />
extent that a cash refund or a reduction in future payments is<br />
available.<br />
(ii)<br />
Retirement benefit obligations<br />
Employees of the Group are entitled to benefits from the<br />
Group’s superannuation plan on retirement, disability or<br />
death; subject to qualification for membership of the plan.<br />
This plan is a defined contribution scheme that receives fixed<br />
contributions from Group companies. The Group’s legal or<br />
constructive obligation is limited to these contributions.<br />
Employees are entitled to nominate external superannuation<br />
plans to which fixed contributions are similarly directed.<br />
Contributions to defined contribution superannuation plans<br />
are recognised as an expense in profit or loss when incurred.<br />
(iii) Other long-term employee benefits<br />
The Group’s net obligation in respect of long-term employee<br />
benefits is the amount of future benefit that employees have<br />
earned in return for their service in the current and prior<br />
periods plus related on-costs.<br />
Liabilities for long-term benefits that are expected to be<br />
settled beyond 12 months are discounted using rates<br />
attaching to Commonwealth Government securities which<br />
most closely match the terms of maturity of the related<br />
liabilities at balance date.<br />
In determining the liability for employee entitlements,<br />
consideration is given to future increases in wage and salary<br />
rates, experience with employee departures and periods of<br />
service.<br />
(iv) Termination payments and redundancy costs<br />
Termination benefits or redundancy costs are recognised as an<br />
expense when the Group is committed demonstrably, without<br />
realistic opportunity of withdrawal, to a formal detailed plan<br />
without possibility of withdrawal, or providing termination<br />
benefits as a result of an offer made to encourage voluntary<br />
redundancy.<br />
(v) Short-term employee benefits<br />
Short-term employee benefit obligations are measured on an<br />
undiscounted basis and are expensed as the related service is<br />
provided.<br />
A liability is recognised for the amount expected to be paid<br />
under short-term cash bonus or profit-sharing plans if the<br />
Group has a present legal or constructive obligation to pay this<br />
amount as a result of past service provided by the employee<br />
and the obligation can be estimated reliably.<br />
(vi) Short-term incentive plans<br />
A provision for employee benefits in the form of an incentive<br />
plan is recognised when there is no realistic alternative but to<br />
settle the liability, and at least one of the following conditions<br />
is met:<br />
• there are formal terms in the plan for determining the<br />
amount of the benefit;<br />
• the amounts to be paid are determined before the time of<br />
completion of the financial <strong>report</strong>; or<br />
• past practice gives clear evidence of the amount of the<br />
obligation.<br />
Liabilities for incentives are expected to be settled within 12<br />
months and are measured at the amounts expected to be paid<br />
when they are settled.<br />
(vii) Share-based payment transactions<br />
The grant-date fair value of share-based payment awards<br />
granted to employees is recognised as a share-based payment<br />
expense, with a corresponding increase in the share-based<br />
payments reserve, over the period that the employees<br />
unconditionally become entitled to the awards. The amount<br />
recognised as an expense is adjusted to reflect the number of<br />
page 60
IOOF | <strong>annual</strong> <strong>report</strong> <strong>2011</strong><br />
awards for which the related service and non-market vesting<br />
conditions are expected to be met, such that the amount<br />
ultimately recognised as an expense is based on the number<br />
of awards that meet the related service and non-market<br />
performance conditions at vesting date.<br />
For share-based payment awards with non-vesting conditions,<br />
the grant date fair value of the share-based payment is<br />
measured to reflect such conditions and there is no true-up for<br />
differences between expected and actual outcomes.<br />
The fair value at grant date is independently determined where<br />
considered appropriate. The option pricing model used takes<br />
into account the exercise price, the term of the option, the<br />
impact of dilution, the share price at grant date and expected<br />
price volatility of the underlying share, the expected dividend<br />
yield and the risk free interest rate for the term of the option.<br />
A small number of shares remain held by the IOOF Executive<br />
Performance Share Plan Trust (the “Trust”) as at the<br />
comparative <strong>report</strong>ing date. These shares will contribute to<br />
the employee allocation of shares on satisfaction of vesting<br />
performance hurdles. The Group has no right to recall placed<br />
shares. However, a subsidiary Company acts as the Trustee of<br />
the Trust, and can direct the voting rights of shares held and<br />
strategic direction.<br />
Shares in the Company held by the Trust are classified and<br />
disclosed as Treasury shares, and deducted from share capital.<br />
Dividends received by the Trust are recorded as dividend<br />
income in the financial statements of the Trust.<br />
Non-Executive Directors have the opportunity to participate<br />
in the IOOF Deferred Share Purchase Plan. The plan provides<br />
a facility for Non-Executive Directors to salary sacrifice base<br />
salary or future incentive entitlements in order to acquire<br />
shares. As the purchase is funded by Directors’ salary sacrifice,<br />
no additional expense is recorded by the Group.<br />
(j)<br />
Provisions<br />
A provision is recognised if, as a result of a past event, the<br />
Group has a present legal or constructive obligation that can<br />
be estimated reliably, and it is probable that an outflow of<br />
economic benefits will be required to settle the obligation.<br />
Provisions are determined by discounting the expected<br />
future cash flows at a pre-tax rate that reflects current market<br />
assessments of the time value of money.<br />
(i)<br />
Restructuring<br />
A provision for restructuring is recognised when the Group<br />
has approved a detailed and formal restructuring plan, and the<br />
restructuring either has commenced or has been announced<br />
publicly. Future operating losses are not provided for.<br />
(ii)<br />
Onerous contracts<br />
A provision for onerous contracts is recognised when the<br />
expected benefits to be derived by the Group from a contract<br />
are lower than the unavoidable cost of meeting its obligations<br />
under the contract. The provision is measured at the present<br />
value of the lower of the expected cost of terminating the<br />
contract and the expected net cost of continuing with<br />
the contract. Before a provision is established, the Group<br />
recognises any impairment loss on the assets associated with<br />
that contract.<br />
(k) Contract classification<br />
The accounting treatment of certain transactions varies<br />
depending on the nature of the contract underlying the<br />
transaction. The major contract classifications are insurance<br />
contracts and investment contracts.<br />
(i)<br />
Insurance contracts<br />
Insurance contracts are those containing significant insurance<br />
risk at the inception of the contract, or those where at the<br />
inception of the contract there is a scenario with commercial<br />
substance where the level of insurance risk may be significant.<br />
The significance of insurance risk is dependent on both the<br />
probability of an insured event and the magnitude of its<br />
potential effect.<br />
Once a contract has been classified as an insurance contract, it<br />
remains an insurance contract for the remainder of its lifetime,<br />
even if the insurance risk reduces significantly during the<br />
period.<br />
(ii)<br />
Investment contracts<br />
Contracts not considered insurance contracts are classified<br />
as investment contracts. The accounting treatment of<br />
investment contracts depends on whether the investment has<br />
a discretionary participation feature (‘DPF’). A DPF represents<br />
a contractual right to receive, as a supplement to guaranteed<br />
benefits, additional benefits that are:<br />
• likely to be a significant portion of the total benefits;<br />
• distributed at the discretion of the insurer; and<br />
• are based on the performance of a specified pool of assets.<br />
Deposits collected and benefits paid under investment<br />
contracts with DPF are accounted for through profit or loss.<br />
The gross change in the liability to these policyholders for<br />
the period, which includes any participating benefits vested<br />
in policyholders and any undistributed surplus attributed to<br />
policyholders, is also recognised in profit or loss.<br />
Deposits collected and withdrawals processed for investment<br />
contracts without DPF are accounted for directly through<br />
the statement of financial position as a movement in the<br />
page 61
IOOF | <strong>annual</strong> <strong>report</strong> <strong>2011</strong><br />
Notes to the financial statements (cont’d)<br />
For the year ended 30 June <strong>2011</strong><br />
investment contract liability. Distributions on these contracts<br />
are charged to profit or loss as an expense.<br />
Where contracts contain both an investment component and<br />
an insurance component and the deposit component can be<br />
separately measured, the underlying amounts are unbundled.<br />
Premiums relating to the insurance component are accounted<br />
for through profit or loss and the investment component is<br />
accounted for as a deposit through the statement of financial<br />
position as described above.<br />
(l)<br />
Revenue<br />
Revenue is measured at the fair value of the consideration<br />
received or receivable.<br />
(i)<br />
Management fees<br />
The Group provide management services to unit trusts and<br />
funds operated by the Group at normal commercial rates.<br />
Management fees earned from the unit trusts and funds are<br />
calculated based on an agreed percentage of the respective<br />
funds under management or administration as disclosed in the<br />
respective product disclosure statements, and are recognised<br />
on an accruals basis.<br />
Management and service fees revenue from the provision of<br />
financial advisory services together with revenue from the<br />
rendering of services are recognised at the time the service is<br />
provided.<br />
(ii)<br />
Other fee revenue and stockbroking revenue<br />
Other fee revenue and stockbroking revenue from the<br />
rendering of services are recognised at the time the service is<br />
provided.<br />
(iii) Upfront service fees<br />
Upfront service fees are recorded as deferred revenue and<br />
recognised on a straight-line basis over a period that is<br />
reflective of the continued service provided. The period of<br />
amortisation is based on historical experience and varies<br />
between products on offer. The current deferral period is<br />
between 5 and 7 years. These upfront service fees are recorded<br />
as a deferred revenue liability within other liabilities in the<br />
consolidated statement of financial position.<br />
(iv) Premium revenue<br />
Premium revenue is earned on life insurance products. Life<br />
insurance premiums with no due date are recognised on a<br />
cash received basis. Premiums with regular due dates are<br />
recognised as revenue on a basis which is consistent with<br />
the Actuary’s valuation of liabilities. Deposit components of<br />
life insurance contracts are not revenue and are treated as<br />
movements in life insurance contract liabilities.<br />
(m) Lease payments<br />
Payments made under operating leases are recognised in<br />
profit or loss on a straight-line basis over the term of the lease.<br />
Lease incentives received are recognised as an integral part of<br />
the total lease expense, over the term of the lease.<br />
Minimum lease payments made under finance leases are<br />
apportioned between the finance expense and the reduction<br />
of the outstanding liability. The finance expense is allocated to<br />
each period during the lease term so as to produce a constant<br />
periodic rate of interest on the remaining balance of the<br />
liability.<br />
(n) Finance income and finance costs<br />
Finance income comprises interest income on funds invested<br />
(including available-for-sale financial assets), dividend income,<br />
gains on the disposal of available-for sale financial assets,<br />
changes in the fair value of financial assets at fair value through<br />
profit or loss, and gains on hedging instruments that are<br />
recognised in profit or loss. Interest income is recognised as it<br />
accrues in profit or loss, using the effective interest method.<br />
Dividend income is recognised in profit or loss on the date that<br />
the Group’s right to receive payment is established, which in<br />
the case of quoted securities is the ex-dividend date.<br />
Finance costs comprise interest expense on borrowings,<br />
unwinding of the discount on provisions, changes in the fair<br />
value of financial assets at fair value through profit or loss,<br />
impairment losses recognised on financial assets, and losses on<br />
hedging instruments that are recognised in profit or loss.<br />
Borrowing costs that are not directly attributable to the<br />
acquisition, construction or production of a qualifying asset are<br />
recognised in profit or loss using the effective interest method.<br />
(o) Income tax<br />
Income tax expense comprises current and deferred tax.<br />
Current and deferred tax are recognised in profit or loss except<br />
to the extent that it relates to a business combination, or<br />
items recognised directly in equity or in other comprehensive<br />
income.<br />
Current tax is the expected tax payable or receivable on<br />
the taxable income for the year, using tax rates enacted<br />
or substantively enacted at the <strong>report</strong>ing date, and any<br />
adjustment to tax payable in respect of previous years.<br />
The applicable rates of income tax vary depending upon the<br />
fund or entity involved. The segregated superannuation and<br />
rollover fund business of the IOOF Ltd benefit funds attracts<br />
income tax at the rate of 15% (2010: 15%) and the ordinary<br />
business of the Company is taxed at the rate of 30% (2010:<br />
30%).<br />
page 62
IOOF | <strong>annual</strong> <strong>report</strong> <strong>2011</strong><br />
Deferred tax is recognised in respect of temporary differences<br />
between the carrying amounts of assets and liabilities for<br />
financial <strong>report</strong>ing purposes and the amounts used for<br />
taxation purposes. Deferred tax is not recognised for the<br />
following temporary differences: the initial recognition of<br />
assets or liabilities in a transaction that is not a business<br />
combination and that affects neither accounting nor taxable<br />
profit or loss, and differences relating to investments in<br />
subsidiaries and associates to the extent that it is probable<br />
that they will not reverse in the foreseeable future. In<br />
addition, deferred tax is not recognised for taxable temporary<br />
differences arising on the initial recognition of goodwill.<br />
Deferred tax is measured at the tax rates that are expected to<br />
be applied to temporary differences when they reverse, based<br />
on the laws that have been enacted or substantively enacted<br />
by the <strong>report</strong>ing date.<br />
Deferred tax assets and liabilities are offset when there is<br />
a legally enforceable right to offset current tax assets and<br />
liabilities and when deferred tax balances relate to the same<br />
taxation authority. Current tax assets and liabilities are offset<br />
where the entity has a legally enforceable right to offset and<br />
intends either to settle on a net basis, or to realise the asset and<br />
settle the liability simultaneously.<br />
(i)<br />
Tax consolidation<br />
IOOF Holdings Ltd and its wholly owned Australian resident<br />
entities (including IOOF Ltd benefit funds) are part of a<br />
tax-consolidated group under Australian taxation law. As a<br />
consequence, all members of the tax-consolidated group are<br />
taxed as a single entity.<br />
Tax expense/income, deferred tax liabilities and deferred tax<br />
assets arising from temporary differences of the members of<br />
the tax-consolidated group are recognised in the separate<br />
financial statements of the members of the tax-consolidated<br />
group using the ‘separate taxpayer within group’ approach<br />
by reference to the carrying amounts in the separate financial<br />
statements of each entity and the tax values applying under<br />
tax consolidation. Current tax liabilities and assets and deferred<br />
tax assets arising from unused tax losses and relevant tax<br />
credits of the members of the tax-consolidated group are<br />
recognised by the Company (as head entity in the taxconsolidated<br />
group).<br />
Due to the existence of a tax funding arrangement between<br />
the entities in the tax-consolidated group, amounts are<br />
recognised as payable to or receivable by the company and<br />
each member of the group in relation to the tax contribution<br />
amounts paid or payable between the parent entity and the<br />
other members of the tax-consolidated group in accordance<br />
with the arrangement.<br />
Further information about the tax funding arrangement is<br />
detailed in note 11 to the financial statements.<br />
Where the tax contribution amount recognised by each<br />
member of the tax-consolidated group for a particular period<br />
is different to the aggregate of the current tax liability or asset<br />
and any deferred tax asset arising from unused tax losses<br />
and tax credits in respect of that period, the difference is<br />
recognised as a contribution from (or distribution to) equity<br />
participants.<br />
(ii)<br />
Uncertain Tax Position<br />
Tax Laws Amendment (2010 Measures No. 1) Bill 2010, received<br />
Royal Assent on 3 June 2010. The Act contains a number of<br />
amendments to the tax consolidation regime that deal with<br />
the recognition of tax cost setting amounts in the income<br />
tax law. A new section ( s 716-405) may provide a specific<br />
tax deduction for the tax cost setting amount on assets that<br />
qualify as rights to future income assets acquired upon an<br />
entity joining a tax consolidated group. The Company has<br />
analysed customer related intangibles, acquired as part of<br />
various acquistions the Company or its subsidiaries have made<br />
since 2005, with a view to applying the new provisions. The<br />
Company has sought a private ruling to confirm its entitlement<br />
to these tax deductions.<br />
On 30 March <strong>2011</strong>, the Board of Taxation was requested<br />
to undertake a review of these provisions and provide<br />
recommendations that may limit the use and scope<br />
these provisions . Such recommendations may have<br />
restrospective application. To date these recomendations<br />
have not been made public and it is uncertain as to how any<br />
recommendations will be legislated and applied.<br />
Until receipt of the private ruling and actionable<br />
recommendations from the Board of Taxation the tax effect<br />
of Tax Laws Amendment (2010 Measures No. 1) Bill 2010 is<br />
considered uncertain.<br />
(p) Goods and service tax (GST)<br />
Revenues, expenses and assets (excluding receivables) are<br />
recorded net of GST. GST input tax credits are initially recorded<br />
as an asset and GST collected as a liability. These balances<br />
are offset as at the <strong>report</strong>ing date and recognised as either<br />
an amount receivable or payable to the Australian Taxation<br />
Office. The GST portion relating to financial supplies and nondeductible<br />
expenditure, for which an input tax credit cannot<br />
be claimed, is expensed or is recognised as part of the cost of<br />
acquisition of an asset.<br />
Receivables and payables are stated inclusive of the amount of<br />
GST receivable or payable. The net amount of GST recoverable<br />
from, or payable to, the Australian Taxation Office is included<br />
page 63
IOOF | <strong>annual</strong> <strong>report</strong> <strong>2011</strong><br />
Notes to the financial statements (cont’d)<br />
For the year ended 30 June <strong>2011</strong><br />
with other receivables or payables in the Statement of<br />
Financial Position.<br />
Cash flows are presented in the statement of cash flows on a<br />
gross basis. The GST components of cash flows arising from<br />
investing or financing activities which are recoverable from,<br />
or payable to, the Australian Taxation Office are presented as<br />
operating cash flows.<br />
(q) Deferred acquisition costs<br />
Deferred acquisition costs relate to service fees paid, and are<br />
deferred as an asset in recognition that they relate to a future<br />
economic benefit. Deferred acquisition costs are initially<br />
measured at historical cost and are written down immediately<br />
to their recoverable amount if the carrying amount is greater<br />
than its estimated recoverable amount.<br />
Deferred acquisition costs are progressively amortised in profit<br />
or loss by a systematic allocation over the period of time the<br />
future economic benefits are expected to be received. The<br />
amortisation period is between 5 and 7 years.<br />
(r)<br />
(i)<br />
Investment contract liabilities and claims<br />
expense<br />
Investment contracts with Discretionary<br />
Participation Features (DPF)<br />
The value of these liabilities changes in relation to the change<br />
in unit prices for unit linked contracts, and are decreased by<br />
management fee charges. In accordance with the rules of the<br />
funds, any remaining surplus is attributed to the policyholders.<br />
Adjustments to the liabilities at each <strong>report</strong>ing date are<br />
recorded in profit or loss.<br />
(ii)<br />
Other investment contracts<br />
The value of these liabilities changes in relation to the change<br />
in unit prices for unit linked contracts, and are decreased by<br />
management fee charges. In accordance with the rules of the<br />
funds, any remaining surplus is attributed to the members of<br />
the fund. Amounts distributable to members are recorded in<br />
profit or loss as an expense.<br />
There is no claims expense in respect of life investment<br />
contracts. Surrenders and withdrawals which relate to life<br />
investment contracts are treated as a movement in life<br />
investment contract liabilities. Surrenders are recognised when<br />
the policyholder formally notifies of their intention to end the<br />
policy previously contracted.<br />
(s)<br />
Insurance contract liabilities and claims<br />
expense<br />
Life insurance contract liabilities are calculated in accordance<br />
with actuarial standards.<br />
A claim expense is recognised when the liability to the<br />
policyholder under the policy contract has been established,<br />
or upon notification of the insured event. Withdrawal<br />
components of life insurance contracts are not expenses and<br />
are treated as movements in life insurance contract liabilities.<br />
(t)<br />
Shareholders entitlement to monies held in<br />
statutory funds<br />
Monies held in the life insurance Statutory Funds (including<br />
the Benefit Funds) are subject to the distribution and transfer<br />
restrictions and other requirements of the Life Insurance Act<br />
1995. Monies held in the benefit funds and controlled trusts<br />
are held for the benefit of the members of those funds, and are<br />
subject to the constitution and rules of those funds.<br />
(u) Earnings per share<br />
The Group presents basic and diluted earnings per share data<br />
for its ordinary shares. Basic earnings per share is calculated by<br />
dividing the profit or loss attributable to ordinary shareholders<br />
of the Company by the weighted average number of ordinary<br />
shares outstanding during the year, adjusted for treasury shares<br />
held.<br />
Diluted earnings per share is determined by adjusting the<br />
profit or loss attributable to ordinary shareholders and the<br />
weighted average number of ordinary shares outstanding,<br />
adjusted for treasury shares held, for the effects of all dilutive<br />
potential ordinary shares, which comprise performance rights<br />
and share options granted to employees.<br />
(v) Segment <strong>report</strong>ing<br />
Determination and presentation of operating<br />
segments<br />
An operating segment is a component of the Group that<br />
engages in business activities from which it may earn revenues<br />
and incur expenses, including revenues and expenses<br />
that relate to transactions with any of the Group’s other<br />
components. All operating segments’ operating results are<br />
regularly reviewed by the Group’s Managing Director to make<br />
decisions about resources to be allocated to the segment<br />
and assess its performance, and for which discrete financial<br />
information is available.<br />
Segment results that are <strong>report</strong>ed to the Managing Director<br />
include items directly attributable to a segment as well as<br />
those that can be allocated on a reasonable basis. Unallocated<br />
page 64
IOOF | <strong>annual</strong> <strong>report</strong> <strong>2011</strong><br />
items comprise mainly corporate assets, head office expenses,<br />
and income tax assets and liabilities.<br />
Segment capital expenditure is the total cost incurred during<br />
the period to acquire property and equipment, and intangible<br />
assets other than goodwill.<br />
(w) Liability to buy back vested shares<br />
A liability has been recognised in respect of an obligation by<br />
the Group to buy back vested shares in some Perennial Group<br />
subsidiaries under certain circumstances. The above liabilities<br />
are recorded at fair value. Determination of fair value has<br />
required assumptions concerning future growth, discount rates<br />
and fund flows.<br />
For further information on valuation methods for the liability to<br />
buy back vested shares refer to note 5(e) fair value estimation.<br />
Change in accounting policy<br />
Under the previous accounting policy, changes in the fair value<br />
of the buy back liability were recognised in profit or loss. The<br />
change in accounting policy is to recognise these movements<br />
in a share buy back revaluation reserve which more accurately<br />
reflects the nature of the underlying instrument. The liability<br />
to buy back vested shares is measured and recognised in<br />
accordance with AASB 139 Financial Instruments: Recognition<br />
and Measurement precluding any adjustment for the<br />
probability that settlement of the liability will occur. The<br />
directors have assessed the probability that the Group will<br />
be required to settle the share buy back liability as low and<br />
therefore recognition of movements in the reserve provides<br />
users with increased relevance and reliability of the financial<br />
performance of the Group.<br />
(x) New standards and interpretations not yet<br />
adopted<br />
A number of new standards, amendments to standards and<br />
interpretations are effective for <strong>annual</strong> periods beginning<br />
after 1 July <strong>2011</strong>, and have not been applied in preparing<br />
these consolidated financial statements. None of these is<br />
expected to have a significant effect on the consolidated<br />
financial statements of the Group, except for AASB 9 Financial<br />
Instruments, which becomes mandatory for the Group’s 2014<br />
consolidated financial statements and could change the<br />
classification and measurement of financial assets. The Group<br />
does not plan to adopt this standard early and the extent of<br />
the impact has not been determined. In addition, there are<br />
new standards due to be effective for periods beginning after<br />
I July 2013, AASB 10 Consolidated Financial Statements, AASB 11<br />
Joint Arrangements, AASB 12 Disclosure of interest in other entities<br />
and AASB 13 Fair value measurement. The extent of the impact<br />
has not yet been determined.<br />
(y) Parent entity financial statements<br />
Parent entity information has been reinstated in accordance<br />
with a directive from the Australian Prudential Regulatory<br />
Authority dated 1 September 2010 to all its regulated entities.<br />
Disclosure of parent entity information is not required under<br />
the Corporations Act 2001.<br />
This change in accounting policy has had an effect on<br />
consolidated earnings per share and on net profit, further<br />
information is provided in note 4 Change in accounting<br />
policy. A third balance sheet has also been presented on the<br />
statement of financial position.<br />
page 65
IOOF | <strong>annual</strong> <strong>report</strong> <strong>2011</strong><br />
Notes to the financial statements (cont’d)<br />
For the year ended 30 June <strong>2011</strong><br />
4 Change in accounting policy<br />
As a result of the change in accounting policy for the recognition of fair value movements in the share buy back liability, the following<br />
adjustments to the balance sheet have been made.<br />
Consolidated 2010 Consolidated 2009<br />
Published Change Restated Published Change Restated<br />
$’000 $’000 $’000 $’000 $’000 $’000<br />
Retained earnings<br />
Balance at 1 July 14,403 (15) 14,388 10,688 6,788 17,476<br />
Profit for the period 68,403 9,139 77,542 13,850 (6,803) 7,047<br />
Dividends paid (77,841) - (77,841) (10,272) - (10,272)<br />
Profit on treasury shares sold on-market 1,494 - 1,494 - - -<br />
Forfeiture of redeemable converting<br />
- - - 137 - 137<br />
preference shares during the year<br />
Balance at 30 June 6,459 9,124 15,583 14,403 (15) 14,388<br />
Reserves<br />
Asset revaluation reserve 1,072 - 1,072 1,072 - 1,072<br />
Available-for-sale investment revaluation<br />
1,751 - 1,751 441 - 441<br />
reserve<br />
Business combinations reserve (301) - (301) - - -<br />
Share-based payments reserve 3,278 - 3,278 4,658 - 4,658<br />
Share buy back revaluation reserve - (9,124) (9,124) - 15 15<br />
5,800 (9,124) (3,324) 6,171 15 6,186<br />
Reconciliation of movement in reserves<br />
Share buy back revaluation reserve<br />
Balance at 1 July - 15 15 - (6,788) (6,788)<br />
Valuation gain/(loss) recognised - (9,139) (9,139) - 6,803 6,803<br />
Balance at 30 June - (9,124) (9,124) - 15 15<br />
The change in accounting policy has had no impact on the financial performance or position of the parent entity or on the statutory<br />
benefit funds or any disclosures for the Group except as set out in this note.<br />
The change in accounting policy had the following impact on earnings per share.<br />
Consolidated 2010 Consolidated 2009<br />
Published Change Restated Published Change Restated<br />
$’000 $’000 $’000 $’000 $’000 $’000<br />
Earnings per share<br />
Earnings used in the calculation of basic EPS 68,403 9,139 77,542 13,850 (6,803) 7,047<br />
The change in accounting policy had no impact on the weighted average number of ordinary shares.<br />
Weighted average number<br />
of ordinary shares (basic)<br />
Weighted average number<br />
of ordinary shares (diluted)<br />
Consolidated Consolidated 2010 Consolidated 2009<br />
2010 2009 Published Restated Published Restated<br />
No. ’000 No. ’000 cents cents cents cents<br />
229,922 96,151 Basic earnings<br />
per share<br />
230,914 96,141 Diluted earnings<br />
per share<br />
29.8 33.7 14.6 7.4<br />
29.6 33.6 14.4 7.3<br />
page 66
IOOF | <strong>annual</strong> <strong>report</strong> <strong>2011</strong><br />
5 Risk management<br />
IOOF risk management framework<br />
Risk is defined by IOOF as any event which hinders the<br />
sustainable achievement of Group objectives and results,<br />
including a failure to exploit opportunities. The Group’s<br />
strategy to manage risk involves the identification of risks by<br />
type, impact and likelihood, implementation of controls to<br />
mitigate risks, and continuous monitoring and improvement of<br />
the procedures in place.<br />
The Group’s objective is to satisfactorily manage its risks in<br />
line with the Group’s Risk Management Policy set by the<br />
Board, and this aligns to International Standard ISO 31000<br />
Risk Management. Procedures are put in place to control and<br />
mitigate the risks faced by the Group and vary depending<br />
on the nature of the risk. The Group maintains a framework<br />
to ensure regulatory compliance obligations are managed<br />
in accordance with Australian Standard 3806 Compliance<br />
Programs. The Group’s exposure to all material risks is<br />
monitored by the Head of Risk and this exposure, and any<br />
anticipated risk exposure, is regularly <strong>report</strong>ed to the Risk and<br />
Compliance Committee, and the Board.<br />
The Group’s income and operating cash flows are indirectly<br />
impacted by changing market conditions. Its exposure is<br />
through the impact of market changes on the level of funds<br />
under management and administration, and consequently<br />
management fee and service fee revenue. Information has<br />
been provided below only on the direct impact of changing<br />
market conditions to the Group’s income and operating cash<br />
flows.<br />
The financial condition and operating results of the Group are<br />
affected by a variety of financial and non-financial risks. The<br />
key non-financial exposures are to operational risk and a failure<br />
to meet regulatory compliance obligations. The nature of the<br />
financial risk exposures arising from financial instruments, the<br />
objectives, policies and processes for managing these risks,<br />
and the methods used to measure them are detailed below.<br />
Financial risk<br />
The financial risk management objectives, policies and<br />
processes and the quantitative data about the exposure to risk<br />
at the <strong>report</strong>ing date, as set out in the remainder of this note,<br />
excludes the benefit funds and the controlled unit trusts. This<br />
is because the risks associated with financial instruments held<br />
by the benefit funds and controlled trusts are borne by the<br />
policyholders and members of those funds and trusts, and not<br />
the shareholders of the Group. There is no direct impact on<br />
the net profit or the equity of the Group as a consequence of<br />
changes in markets as they apply to financial instruments held<br />
by those funds and trusts at the <strong>report</strong>ing date.<br />
Similarly the objectives, policies and processes for managing<br />
the risks of the Group are separate and distinct from those for<br />
the benefit funds and trusts. The funds and trusts are managed<br />
under extensive regulatory requirements, and in accordance<br />
with specific investment guidelines, risk management<br />
strategies, risk management plans, and product disclosure<br />
statements. The Group is managed under a set of separate<br />
corporate policies and review processes that are directed<br />
toward the interests of the shareholders of the Group.<br />
Information in relation to financial risks associated with the<br />
benefit funds and controlled trusts is available in their Product<br />
Disclosure Statements and the individual <strong>annual</strong> financial<br />
<strong>report</strong>s of those trusts.<br />
Further information in relation to the Australian Accounting<br />
Standards requirement to consolidate the benefit funds and<br />
controlled trusts in the consolidated financial statements of the<br />
Group is available in Note 3(a) Basis of consolidation.<br />
The following table shows the value of financial instruments<br />
held directly and actively managed by the corporate entities<br />
within the Group in relation to its shareholder interests. It<br />
shows the financial instruments, as <strong>report</strong>ed in the notes to the<br />
financial statements, excluding any elimination entries made<br />
upon consolidation with the funds and trusts. The adjustment<br />
of these eliminations has the effect of identifying the interentity<br />
financial instruments that are also actively managed by<br />
the Group.<br />
page 67
IOOF | <strong>annual</strong> <strong>report</strong> <strong>2011</strong><br />
Notes to the financial statements (cont’d)<br />
For the year ended 30 June <strong>2011</strong><br />
Financial assets<br />
Consolidated Parent<br />
<strong>2011</strong> 2010 <strong>2011</strong> 2010<br />
$’000 $’000 $’000 $’000<br />
Cash and cash equivalents 152,999 132,780 45,959 617<br />
Receivables 73,068 67,668 14,342 11,547<br />
Loans and other receivables 23,967 18,096 61,819 35,106<br />
Financial assets at fair value through profit or loss 8,029 6,479 - -<br />
Available-for-sale financial assets 28,577 23,179 - -<br />
Investments in equity-accounted investees 14,739 12,891 864 -<br />
Investments in subsidiaries - - 849,796 849,796<br />
301,379 261,093 972,780 897,066<br />
Financial liabilities<br />
Payables 50,664 48,401 70 80<br />
Borrowings 38 14,628 10,000 10,000<br />
Share buy-back liabilities 43,112 37,357 - -<br />
93,814 100,386 10,070 10,080<br />
The Group does not hold derivative financial instruments to hedge other market risk exposures, and does not hold or trade derivative<br />
financial instruments for speculative purposes.<br />
Financial risks for the Group include market risk (including price risk, foreign exchange risk and cash flow and fair value interest rate<br />
risk), credit risk, liquidity risk, and life insurance risk.<br />
(a) Market risk<br />
(i)<br />
Price risk<br />
Price risk is the risk that the fair value or future earnings of<br />
a financial instrument will fluctuate because of changes in<br />
market prices (other than from interest rate risk or currency risk,<br />
as described later). The financial instruments managed by the<br />
Group that are impacted by price risk consist of investment<br />
units held in trusts, available for sale financial assets and the<br />
share buy-back liability.<br />
The price risk associated with the units held in trusts is that the<br />
fair value of those units will fluctuate with movements in the<br />
redemption value of those units, which in turn is based on the<br />
fair value of the underlying assets held by the trusts. This risk is<br />
managed by choosing to invest in a mix of trusts operated by<br />
the Group that will provide an overall diversified portfolio that<br />
consists of cash, fixed income securities, equities, and listed<br />
property securities; in a mix that provides the Group consistent<br />
cash plus returns, benchmarked to exceed the UBSA Bank Bill<br />
Index, as well as some participation in opportunities for capital<br />
growth over the longer term.<br />
The share buy-back liability recorded at balance date is<br />
reflective of the fair value of the underlying shares of certain<br />
Perennial subsidiaries. The price risk associated with this liability<br />
is that the fair value of the particular equities could change<br />
as a result of a change in the projected profitability of those<br />
subsidiaries. It is considered impractical to manage the price<br />
risk associated with this liability, and it is worth noting that the<br />
more successful the Group is in growing its business in the<br />
relevant sectors, the greater this liability will grow.<br />
The Parent has no exposure to price risk.<br />
Group sensitivity<br />
At 30 June <strong>2011</strong> had the price of the units / shares held by the<br />
Group in unlisted unit trusts / shares in other entities increased<br />
/ decreased by 1% (2010: 1%) with all other variables held<br />
constant, post-tax profit for the year would increase / decrease<br />
by $21,000 (2010: $17,000) as a result of gains / losses recorded<br />
through profit or loss and available-for-sale reserves would<br />
increase / decrease by $286,000 (2010: $162,000).<br />
At 30 June <strong>2011</strong>, had the value of the underlying equity in<br />
relation to the share buy-back liabilities increased/decreased<br />
by 1% (2010: 1%) with all other variables held constant, group<br />
equity would decrease/increase by $431,000 (2010: $374,000).<br />
page 68
IOOF | <strong>annual</strong> <strong>report</strong> <strong>2011</strong><br />
(ii)<br />
Cash flow and fair value interest rate risk<br />
(b) Credit risk<br />
Interest rate risk is the risk to the Group’s earnings and capital<br />
arising from changes in market interest rates. The financial<br />
instruments held that are impacted by interest rate risk consist<br />
of cash and cash equivalents, loans, and borrowings.<br />
Short and long-term investment mixes and loans to related<br />
entities are influenced by liquidity policy requirements. Interest<br />
rates (both that charged and received) are based on market<br />
rates, and are closely monitored by management. They are<br />
primarily at variable rates of interest, and expose the Group to<br />
cash flow interest rate risk.<br />
Management regularly assesses the appropriateness of the<br />
investment of surplus funds with the objective of maximising<br />
returns, within investment guidelines acceptable to the Board.<br />
There is limited exposure to fair value interest rate risk because<br />
of the relatively short time frame of any fixed rate investments<br />
and borrowings.<br />
The Parent has no exposure to interest rate risk.<br />
Group sensitivity<br />
At 30 June <strong>2011</strong>, if interest rates had changed by +/- 100<br />
basis points from the year-end rates with all other variables<br />
held constant, post tax profit for the year would have been<br />
$1,550,000 higher/lower (2010: change of +/- 100 basis points;<br />
$860,000 higher/lower). Equity would have been higher/lower<br />
by the same amount.<br />
(iii) Foreign exchange risk<br />
The Group was not exposed to significant foreign exchange<br />
risk in relation to financial instruments held at year end<br />
(2010: nil).<br />
Credit risk refers to the risk that a counterparty will fail to<br />
meet its contractual obligations resulting in financial loss to<br />
the Group. Credit risk arises for the Group from cash and cash<br />
equivalents, receivables, loans and other receivables.<br />
The Group mitigates its credit risk by ensuring cash deposits<br />
are held with high credit quality financial institutions and other<br />
highly liquid investments are held with trusts operated by the<br />
Group. Where investments are held in units in a trust operated<br />
by the Group, that trust is subject to the rules of the trust deed<br />
and the investment in underlying assets is subject to asset<br />
allocation guidelines.<br />
Receivables consist of management fees receivable, service<br />
fees receivable and mandate receivables and other amounts<br />
receivable from related parties. These counterparties generally<br />
do not have an independent credit rating, and the Group<br />
assesses the credit quality of the debtor taking into account its<br />
financial position, past experience with the debtor, and other<br />
available credit risk information. In relation to management<br />
fees receivable, the Group is contractually entitled to deduct<br />
such fees from investors’ account balances, in accordance<br />
with the Product Disclosure Statements, and pass the fees to<br />
the Responsible Entity or Trustee. Due to this pass-through<br />
process the embedded credit risk is considered minimal. Other<br />
receivables are regularly monitored by line management.<br />
The maximum exposure to credit risk at the <strong>report</strong>ing date is<br />
the carrying value of the financial assets as summarised in the<br />
table included in this note above. The Group does not hold<br />
any significant collateral as security over its receivables and<br />
loans, apart from its recourse to certain shares in subsidiaries in<br />
relation to loans to executives.<br />
There are no significant concentrations of credit risk within the<br />
Group.<br />
The Group does not hold any financial assets whose terms<br />
have been renegotiated, but which would otherwise be past<br />
due or impaired.<br />
The credit quality of the financial assets that are neither past<br />
due nor impaired as at balance date was consistent with that<br />
described above, and management assesses the credit risk<br />
associated with these <strong>report</strong>ed balances as being minimal.<br />
Information in relation to impaired receivables and past due<br />
but not impaired receivables is included below.<br />
page 69
IOOF | <strong>annual</strong> <strong>report</strong> <strong>2011</strong><br />
Notes to the financial statements (cont’d)<br />
For the year ended 30 June <strong>2011</strong><br />
Impaired receivables<br />
As at 30 June <strong>2011</strong>, receivables of the Group with a nominal value of $32,000 (2010: $30,000) were impaired. The amount of the<br />
impairment provision was $32,000 (2010: $30,000). The individually impaired receivables mainly relate to amounts receivable<br />
from clients.<br />
The ageing of these impaired receivables is as follows: Consolidated Parent<br />
<strong>2011</strong> 2010 <strong>2011</strong> 2010<br />
$’000 $’000 $’000 $’000<br />
0 to 180 days - - - -<br />
181 to 360 days - - - -<br />
1 to 3 years - - - -<br />
Greater than 3 years 32 30 - -<br />
32 30 - -<br />
Movements in the provision for impairment of receivables are as follows: Consolidated Parent<br />
<strong>2011</strong> 2010 <strong>2011</strong> 2010<br />
$’000 $’000 $’000 $’000<br />
Balance at beginning of the year 30 187 - -<br />
Provision for impairment recognised 2 12 - -<br />
Receivables written off as uncollectible - (162) - -<br />
Release of provision - (7) - -<br />
Balance at end of the year 32 30 - -<br />
The amount of the provision for impairment is recognised in profit or loss in other expenses. When a receivable for which an<br />
impairment allowance had been recognised becomes uncollectible in a subsequent period, it is written off against the allowance<br />
account. Uncollectible receivables are where there is no expectation of recovering additional cash.<br />
(c) Liquidity risk<br />
Liquidity risk relates to the Group having insufficient liquid assets to cover current liabilities and unforeseen expenses.<br />
The Group maintains a prudent approach to managing liquidity risk exposure by maintaining sufficient liquid assets and an ability<br />
to access a committed line of credit. It is managed by continuously monitoring actual and forecast cash flows and by matching the<br />
maturity profiles of financial assets and liabilities. Temporary surplus funds are invested in highly liquid, low risk financial assets.<br />
The Group had access to un-drawn bank borrowing facilities at the balance date, on the terms described and disclosed in Note 22<br />
Borrowings.<br />
The liquidity requirements for licensed entities in the Group are regularly reviewed and carefully monitored in accordance with those<br />
licence requirements.<br />
page 70
IOOF | <strong>annual</strong> <strong>report</strong> <strong>2011</strong><br />
Maturities of financial liabilities<br />
The tables below analyse the Group’s financial liabilities into relevant maturity groupings based on the remaining period at the<br />
balance date to the contractual maturity date. The amounts disclosed therein are the contractual undiscounted cash flows.<br />
<strong>2011</strong>
IOOF | <strong>annual</strong> <strong>report</strong> <strong>2011</strong><br />
Notes to the financial statements (cont’d)<br />
For the year ended 30 June <strong>2011</strong><br />
Maturities of assets and liabilities<br />
The tables below analyse the Group’s assets and liabilities into current and non-current groupings. Assets and liabilities are classified<br />
as current where it is expected to be recovered or settled within 12 months from balance date. The amounts disclosed therein are the<br />
carrying values of the assets and liabilities.<br />
Consolidated Parent<br />
<strong>2011</strong> 2010 <strong>2011</strong> 2010<br />
$’000 $’000 $’000 $’000<br />
Current assets<br />
Cash and cash equivalents 152,999 132,780 45,959 617<br />
Receivables 68,540 62,668 3,584 789<br />
Other financial assets 42,840 31,293 61,819 35,106<br />
Other assets 13,887 12,639 - -<br />
Investments backing policyholder liabilities 968,017 1,023,476 - -<br />
Total Current assets 1,246,283 1,262,856 111,362 36,512<br />
Non-Current assets<br />
Receivables 4,528 5,000 10,758 10,758<br />
Investments in equity-accounted investees 14,739 12,891 - -<br />
Other financial assets 17,733 16,461 850,660 849,796<br />
Other assets 11,074 15,169 - -<br />
Property and equipment 12,553 8,165 - -<br />
Goodwill 491,856 491,856 - -<br />
Other intangible assets 258,997 276,694 - -<br />
Deferred tax assets - 10,657 - 778<br />
Total Non-Current assets 811,480 836,893 861,418 861,332<br />
Current liabilities<br />
Payables 50,637 48,401 70 80<br />
Borrowings 19 14,593 - -<br />
Current tax liabilities 32,108 23,093 29,387 20,563<br />
Provisions 35,706 41,263 - 550<br />
Other liabilities 5,639 5,924 - -<br />
Policy liabilities 968,017 1,022,730 - -<br />
Total Current liabilities 1,092,126 1,156,004 29,457 21,193<br />
Non-Current liabilities<br />
Payables 27 - - -<br />
Borrowings 19 35 10,000 10,000<br />
Other financial liabilities 43,112 37,357 - -<br />
Provisions 4,673 4,325 - -<br />
Deferred tax liabilities 4,074 - 13,113 -<br />
Other liabilities 11,754 15,074 - -<br />
Total Non-Current liabilities 63,659 56,791 23,113 10,000<br />
Net Assets 901,978 886,954 920,210 866,651<br />
page 72
IOOF | <strong>annual</strong> <strong>report</strong> <strong>2011</strong><br />
(d) Life insurance risk<br />
During the financial year the Group was exposed to life<br />
insurance risks through the subsidiary IOOF Life Ltd. These<br />
risks related to pricing, acceptance and management of<br />
mortality, morbidity and longevity risks from policyholders.<br />
The life policies of IOOF Life Ltd were transferred effective 1<br />
September 2010 to Tower Australia Ltd. The Group had no<br />
exposure to life insurance risks as at 30 June <strong>2011</strong>.<br />
Insurance risks were controlled through the use of<br />
underwriting procedures, adequate premium rates and policy<br />
charges, and sufficient reinsurance arrangements; all of which<br />
were reviewed by the Appointed Actuary. Tight controls were<br />
also maintained over claims management practices to ensure<br />
the correct and timely payment of insurance claims.<br />
Financial risks were monitored and controlled by selecting<br />
appropriate assets to back policy liabilities. The assets were<br />
regularly monitored by the Investment Committee to<br />
ensure there were no material exposures and that liability<br />
mismatching issues and other risks such as liquidity risk and<br />
credit risk are maintained within acceptable limits.<br />
Refer to Note 40 Life Insurance Business for further details.<br />
The Group’s insurance operations are subject to regulatory<br />
capital requirements which prescribe the amount of capital<br />
to be held depending on the type, quality and concentration<br />
of investments held. Procedures are in place to monitor<br />
compliance with these requirements.<br />
(e) Fair value estimation<br />
The fair value of financial assets and financial liabilities must be<br />
estimated for recognition and measurement, or for disclosure<br />
purposes.<br />
The fair value of financial instruments traded in active markets<br />
is based on quoted market prices at the <strong>report</strong>ing date. The<br />
quoted market price used for financial assets is the current bid<br />
price.<br />
The fair value of financial instruments that are not traded in an<br />
active market (such as share buy-back liabilities) is determined<br />
using valuation techniques. Valuation models have been<br />
established in consultation with professional accounting firms,<br />
using generally accepted valuation methodologies. These<br />
include estimated discounted cash flows. Certain assumptions<br />
are made that are based on market conditions existing at each<br />
balance date. Assumptions used included terminal growth<br />
rates of 5% which do not exceed the long-term average<br />
growth rate for each of the businesses and pre-tax discount<br />
rates in the range of 13-16%. The estimated fair values<br />
resulting from the valuation techniques are reasonable and the<br />
most appropriate at the balance date.<br />
For details regarding the fair value of available-for-sale assets<br />
and assets carried at fair value, refer to Note 14 Other financial<br />
assets.<br />
The carrying value of receivables, net of impairment provisions,<br />
and payables are assumed to approximate their fair values due<br />
to their short-term nature.<br />
Loans and other receivables are carried at amortised cost using<br />
the effective interest method and closely approximate their<br />
estimated fair value. Refer to Note 14 Other financial assets for<br />
further details.<br />
Units in unlisted trusts are carried at the current unit price for<br />
redemption of those units with the trust.<br />
page 73
IOOF | <strong>annual</strong> <strong>report</strong> <strong>2011</strong><br />
Notes to the financial statements (cont’d)<br />
For the year ended 30 June <strong>2011</strong><br />
6 Financial instruments<br />
For further information on financial instrument risk exposure, refer to Note 5 Risk management.<br />
(a) Fair values versus carrying amounts<br />
The fair values of financial assets and liabilities, together with the carrying amounts shown in the statement of financial position, are as<br />
follows:<br />
Consolidated Consolidated<br />
30 June <strong>2011</strong> 30 June 2010<br />
Note Carrying amount Fair value Carrying amount Fair value<br />
$’000 $’000 $’000 $’000<br />
Assets carried at fair value<br />
Available-for-sale investments 14 28,577 28,577 23,179 23,179<br />
Financial assets designated at fair value through 14 8,029 8,029 6,479 6,479<br />
profit or loss<br />
36,606 36,606 29,658 29,658<br />
Assets carried at amortised cost<br />
Cash and cash equivalents 12 152,999 152,999 132,780 132,780<br />
Receivables 13 73,068 73,068 67,668 67,668<br />
Loans and receivables 14 23,967 23,967 18,096 18,096<br />
250,034 250,034 218,544 218,544<br />
Liabilities carried at fair value<br />
Share buy-back liabilities 23 43,112 43,112 37,357 37,357<br />
Liabilities carried at amortised cost<br />
Payables 21 50,664 50,664 48,401 48,401<br />
Unsecured cash advance facility 22 - - 14,500 14,500<br />
Finance lease liabilities 22 38 40 128 133<br />
50,702 50,704 63,029 63,034<br />
Parent Parent<br />
30 June <strong>2011</strong> 30 June 2010<br />
Note Carrying amount Fair value Carrying amount Fair value<br />
$’000 $’000 $’000 $’000<br />
Assets carried at amortised cost<br />
Cash and cash equivalents 12 45,959 45,959 617 617<br />
Receivables 13 14,342 14,342 11,547 11,547<br />
Loans and receivables 14 61,819 61,819 35,106 35,106<br />
122,120 122,120 47,270 47,270<br />
Liabilities carried at amortised cost<br />
Payables 21 70 70 80 80<br />
Loan from controlled entity 22 10,000 10,000 10,000 10,000<br />
10,070 10,070 10,080 10,080<br />
The basis for determining fair values is disclosed in note 5(e).<br />
page 74
IOOF | <strong>annual</strong> <strong>report</strong> <strong>2011</strong><br />
(b) Interest rates used for determining fair value<br />
<strong>2011</strong> 2010<br />
Finance lease liabilities 5.3% - 9.5% 5.3% - 9.5%<br />
(c) Fair value hierarchy<br />
The table below analyses financial instruments carried at fair value, by valuation method.<br />
The Parent does not carry any assets at fair value.<br />
The different levels have been defined as follows:<br />
• Level 1: quoted prices (unadjusted) in active markets for identical assets or liabilities<br />
• Level 2: inputs other than quoted prices included with Level 1 that are observable for the asset or liability, either directly (ie. as<br />
prices) or indirectly (ie. derived from prices)<br />
• Level 3: inputs for the asset or liability that are not based on observable market data (unobservable inputs).<br />
Consolidated<br />
Level 1 Level 2 Level 3 Total<br />
30 June <strong>2011</strong><br />
Assets<br />
Available-for-sale investments 28,577 - - 28,577<br />
Financial assets designated at fair value through profit or loss 3,000 5,029 - 8,029<br />
31,577 5,029 - 36,606<br />
Liabilities<br />
Share buy-back liabilities - - 43,112 43,112<br />
- - 43,112 43,112<br />
30 June 2010<br />
Assets<br />
Available-for-sale investments 23,179 - - 23,179<br />
Financial assets designated at fair value through profit or loss 2,851 3,628 - 6,479<br />
26,030 3,628 - 29,658<br />
Liabilities<br />
Share buy-back liabilities - - 37,357 37,357<br />
- - 37,357 37,357<br />
Share buy-back liabilities<br />
Reconciliation of movements in level 3 financial liabilities <strong>2011</strong> 2010<br />
$’000 $’000<br />
Opening balance as at 1 July 2010 37,357 16,386<br />
Dividends paid to shareholders entitled to contractual share buy-back (4,357) (1,650)<br />
Derecognition of non-controlling interests vested and subject to buy-back during the period - 13,482<br />
Revaluation of shareholder liabilities 10,112 9,139<br />
43,112 37,357<br />
For further information on valuation methods for Level 3 financial instruments refer to note 5(e) fair valuation estimation.<br />
page 75
IOOF | <strong>annual</strong> <strong>report</strong> <strong>2011</strong><br />
Notes to the financial statements (cont’d)<br />
For the year ended 30 June <strong>2011</strong><br />
7 Operating segments<br />
The Group’s chief operating decision maker is the Group<br />
Managing Director. The strategic business units offer different<br />
products and services, and are managed separately because<br />
they require different technology and marketing strategies.<br />
The principal products and services of each of these strategic<br />
business units are as follows:<br />
Platform management and administration<br />
The provision of administration and management services<br />
through master trust platforms, which offer a single access<br />
point to a range of investment products.<br />
Investment management<br />
The management and investment of monies on behalf of<br />
corporate, superannuation, institutional clients and private<br />
individual investor clients. The investment management<br />
segment includes revenue and results of the Perennial Group.<br />
Financial advice and distribution<br />
The provision of financial planning advice supported by<br />
services such as investment research, training, compliance<br />
support and access to financial products.<br />
Estate and trustee services<br />
The provision of estate planning, trustee, custodial, agency and<br />
estate administration services to clients.<br />
Corporate and other<br />
Corporate and other costs include those of a strategic,<br />
shareholder or governance nature necessarily incurred in<br />
carrying on business as a listed entity managing multiple<br />
business units.<br />
Information regarding the results of each <strong>report</strong>able segment<br />
is included below. Performance is measured based on<br />
segment profit before income tax as management believes<br />
that such information is the most relevant in evaluating the<br />
results of certain segments relative to other entities that<br />
operate within these industries.<br />
Reconciliation of <strong>report</strong>able segment revenues and expenses<br />
Reconciliation of <strong>report</strong>able segment assets and liabilities<br />
Total Total Total Total<br />
<strong>2011</strong> 2010 <strong>2011</strong> 2010<br />
$’000 $’000 $’000 $’000<br />
Revenues<br />
Assets<br />
External management and service fee revenue 551,059 541,567 Reportable segment assets 1,089,746 1,076,273<br />
External other fee revenue 15,498 14,477 Investments backing policyholder liabilities 968,017 1,023,476<br />
Other external revenue 64,845 61,297 2,057,763 2,099,749<br />
Finance income 11,247 9,337<br />
Consolidated revenue 642,649 626,678<br />
Expenses<br />
Liabilities<br />
Service fees and other direct costs 275,597 264,652 Reportable segment liabilities 187,768 190,065<br />
Amortisation of deferred acquisition costs 7,466 8,436 Policy liabilities 968,017 1,022,730<br />
Operating expenditure 204,766 226,337 1,155,785 1,212,795<br />
Share-based payments expense 3,232 2,027<br />
Depreciation and amortisation 21,713 22,845<br />
Consolidated expenses 512,774 524,297<br />
page 76
IOOF | <strong>annual</strong> <strong>report</strong> <strong>2011</strong><br />
External<br />
management and<br />
service fee revenue<br />
External other<br />
fee revenue<br />
Platform<br />
management and<br />
administration<br />
Financial<br />
advice and<br />
distribution<br />
Investment<br />
management<br />
Estate<br />
and trustee<br />
services<br />
Corporate<br />
and<br />
other<br />
<strong>2011</strong> 2010 <strong>2011</strong> 2010 <strong>2011</strong> 2010 <strong>2011</strong> 2010 <strong>2011</strong> 2010 <strong>2011</strong> 2010<br />
$’000 $’000 $’000 $’000 $’000 $’000 $’000 $’000 $’000 $’000 $’000 $’000<br />
343,961 342,518 58,399 53,839 129,789 126,900 18,910 18,298 - 12 551,059 541,567<br />
8,909 8,975 2,115 2,183 2,581 1,187 1,873 2,129 20 3 15,498 14,477<br />
Inter-segment<br />
- - 68,502 66,898 - - - - - - 68,502 66,898<br />
revenue (i)<br />
Service fees and (97,516) (99,749) (125,084) (115,903) (53,216) (49,336) - 82 219 254 (275,597) (264,652)<br />
other direct costs<br />
Amortisation<br />
(4,500) (5,188) (2,966) (3,248) - - - - - - (7,466) (8,436)<br />
of deferred<br />
acquisition costs<br />
Inter-segment (68,047) (66,728) - - (296) (49) (159) (121) - - (68,502) (66,898)<br />
expenses (i)<br />
Gross Margin 182,807 179,828 966 3,769 78,858 78,702 20,624 20,388 239 269 283,494 282,956<br />
Other external<br />
- 16 61,964 58,957 1,721 300 323 - 837 2,024 64,845 61,297<br />
revenue<br />
Finance income - 272 1,619 1,352 1,359 1,703 - 132 8,269 5,878 11,247 9,337<br />
Inter-segment<br />
- - 504 422 - - - - - - 504 422<br />
revenue (i)<br />
Share of net profits 3 - 146 24 9,052 7,564 - - - - 9,201 7,588<br />
of associates<br />
Operating<br />
(75,270) (92,094) (50,062) (49,973) (33,486) (39,528) (14,126) (14,098) (31,822) (30,644) (204,766) (226,337)<br />
expenditure<br />
Share-based<br />
(626) (564) (760) (596) (698) (667) (95) (72) (1,053) (128) (3,232) (2,027)<br />
payments expense<br />
Finance costs - (4) (18) (7) - - - - (743) (1,085) (761) (1,096)<br />
Inter-segment<br />
- - - - - - - - (504) (422) (504) (422)<br />
expenses (i)<br />
Depreciation and (12,778) (13,382) (5,410) (5,212) (2,688) (2,806) (116) (144) (721) (1,301) (21,713) (22,845)<br />
amortisation<br />
Reportable<br />
94,136 74,072 8,949 8,736 54,118 45,268 6,610 6,206 (25,498) (25,409) 138,315 108,873<br />
segment profit<br />
before income tax<br />
Reportable<br />
209,086 249,636 122,684 27,808 150,191 123,995 10,784 8,087 597,001 666,747 1,089,746 1,076,273<br />
segment assets (ii)<br />
Reportable<br />
(1,604) 4,465 41,020 26,903 68,589 59,214 308 116 79,455 99,367 187,768 190,065<br />
segment liabilities (ii)<br />
Investment in<br />
associates<br />
- - 4,403 3,159 9,469 9,732 - - 867 - 14,739 12,891<br />
Total<br />
(i) Segment revenues, expenses and results include transfers between segments. Such transfers are priced on a commercial basis and are eliminated on consolidation.<br />
(ii) Reportable segment assets and liabilities include inter-segment assets and liabilities.<br />
Geographical segments<br />
The Group predominantly operates in one geographical segment being Australia.<br />
page 77
IOOF | <strong>annual</strong> <strong>report</strong> <strong>2011</strong><br />
Notes to the financial statements (cont’d)<br />
For the year ended 30 June <strong>2011</strong><br />
8 Revenue<br />
Consolidated Parent<br />
<strong>2011</strong> 2010 <strong>2011</strong> 2010<br />
$’000 $’000 $’000 $’000<br />
Management and service fees revenue * 551,059 541,567 - -<br />
Stockbroking revenue 61,173 57,959 - -<br />
Other fee revenue 15,498 14,477 - -<br />
Finance income<br />
Interest income on loans to directors of controlled and associated entities 636 523 2,089 1,829<br />
Interest income from non-related entities 8,200 5,148 413 108<br />
Dividends and distributions received 1,962 1,772 129,912 64,218<br />
Net fair value gains on other financial assets at fair value through profit or loss 243 478 - -<br />
Profit on sale of financial assets 206 1,416 - 1,001<br />
11,247 9,337 132,414 67,156<br />
Other revenue<br />
Service revenue charged to related parties 2,302 2,277 - -<br />
Profit on transfer of life policies 220 - - -<br />
Other 1,150 1,061 8 -<br />
3,672 3,338 8 -<br />
Total revenue 642,649 626,678 132,422 67,156<br />
* Comparatives have been restated to remove prior period grossing of inter-company revenue and expenses on a basis consistent with the current <strong>report</strong>ing period.<br />
page 78
IOOF | <strong>annual</strong> <strong>report</strong> <strong>2011</strong><br />
9 Expenses<br />
Consolidated Parent<br />
<strong>2011</strong> 2010 <strong>2011</strong> 2010<br />
$’000 $’000 $’000 $’000<br />
Service fees and other direct costs<br />
Service and marketing fees expense * 266,491 255,171 - -<br />
Other direct costs 9,106 9,481 175 (1,122)<br />
275,597 264,652 175 (1,122)<br />
Operating expenditure<br />
Salaries and related employee expenses 121,223 129,619 - -<br />
Employee defined contribution plan expense 8,625 9,144 - -<br />
Information technology costs 32,195 27,304 - -<br />
Professional fees 4,724 5,358 484 247<br />
Marketing 6,066 5,919 - -<br />
Office support and administration 12,629 17,096 12 (400)<br />
Occupancy related expenses 12,088 14,424 - -<br />
Travel and entertainment 5,264 4,763 - -<br />
Services fees - controlled entities - - - 2,745<br />
Other 271 143 - -<br />
203,085 213,770 496 2,592<br />
Other expenses<br />
Share-based payments expense 3,232 2,027 - -<br />
Termination payments 1,296 7,874 - -<br />
Retention incentive payments 208 945 - -<br />
Depreciation of property and equipment 3,733 4,940 - -<br />
Amortisation of intangible assets 17,980 17,905 - -<br />
Loss on disposal of non-current assets 177 666 - -<br />
Onerous lease contract expense - 3,082 - -<br />
Amortisation of deferred acquisition costs 7,466 8,436 - -<br />
34,092 45,875 - -<br />
Total expenses 512,774 524,297 671 1,470<br />
* Comparatives have been restated to remove prior period grossing of inter-company revenue and expenses on a basis consistent with the current <strong>report</strong>ing period.<br />
10 Finance costs<br />
Consolidated Parent<br />
<strong>2011</strong> 2010 <strong>2011</strong> 2010<br />
$’000 $’000 $’000 $’000<br />
Interest 761 1,096 467 719<br />
page 79
IOOF | <strong>annual</strong> <strong>report</strong> <strong>2011</strong><br />
Notes to the financial statements (cont’d)<br />
For the year ended 30 June <strong>2011</strong><br />
11 Income tax expense<br />
Consolidated Parent<br />
<strong>2011</strong> 2010 <strong>2011</strong> 2010<br />
$’000 $’000 $’000 $’000<br />
Current tax expense<br />
Current period 39,317 31,122 1 (2,750)<br />
Adjustment for prior periods (867) (128) (146) 15<br />
38,450 30,994 (145) (2,735)<br />
Deferred tax expense<br />
Origination and reversal of temporary differences (529) (2,558) 291 748<br />
Adjustments recognised in the current year in relation to the deferred tax (396) 2 (190) 207<br />
of prior years<br />
Recognition of tax losses and deferred tax balances - (179) - -<br />
(925) (2,735) 101 955<br />
Total income tax expense from continuing operations 37,525 28,259 (44) (1,780)<br />
Income tax recognised directly in equity<br />
Disposal of treasury shares<br />
Before tax - 2,555 - -<br />
Tax (expense)/benefit - (1,061) - -<br />
Net of tax - 1,494 - -<br />
Income tax recognised in other comprehensive income<br />
Available-for-sale financial assets<br />
Before tax 5,398 2,953 - -<br />
Tax (expense)/benefit (1,866) (1,643) - -<br />
Net of tax 3,532 1,310 - -<br />
Reconciliation of the prima facie income tax expense on pre-tax profit<br />
with the income tax expense charged in the Income statement<br />
Profit before income tax 151,926 105,734 131,284 64,967<br />
Life insurance revenue (85,260) (70,682) - -<br />
Life insurance expense 71,649 73,821 - -<br />
Shareholder profit before income tax 138,315 108,873 131,284 64,967<br />
Prima facie income tax at the Australian tax rate of 30% 41,495 32,662 39,385 19,490<br />
Tax effect of amounts which are not deductible/ (taxable) in calculating<br />
taxable income:<br />
Share of tax credits with benefit funds 1,520 2,260 - -<br />
Recognition of deferred tax balances - (179) - -<br />
Internal interest charge (109) (162) - -<br />
(Non assessable income)/Non-deductible expenses 2,352 793 (38,974) (20,806)<br />
Amortisation of deferred tax liability recorded on intangible assets (2,966) (3,822) - -<br />
Share of net profits of associates (2,761) (2,276) - -<br />
Assessable associate and subsidiary dividends 5,424 4,774 - -<br />
Tax losses not recognised - (347) - -<br />
Imputation credits (5,658) (5,234) - -<br />
Other (509) (82) (119) (479)<br />
Under/(over) provided in prior periods (1,263) (128) (336) 15<br />
37,525 28,259 (44) (1,780)<br />
page 80
IOOF | <strong>annual</strong> <strong>report</strong> <strong>2011</strong><br />
Tax consolidation<br />
IOOF Holdings Ltd and its wholly owned entities have implemented the tax consolidation legislation.<br />
The entities have entered into tax sharing and funding agreements. Under the terms of the tax funding agreement, the wholly owned<br />
entities fund or are reimbursed by IOOF Holdings Ltd for their share of the income tax expense / benefit arising in respect of their<br />
activities. This is recognised as a current tax related payable / receivable by IOOF Holdings Ltd and is either funded or reimbursed by<br />
the wholly owned entities each month.<br />
In the opinion of the directors, the tax sharing agreement is also a valid agreement under the tax consolidation legislation and limits<br />
the joint and several liability of the wholly owned entities in the case of a default by IOOF Holdings Ltd.<br />
Taxable income for the tax consolidated group includes the profit generated by IOOF Ltd benefit funds, which is distributable<br />
to policyholders of the Benefit Fund. The profit of these funds forms part of the consolidated profit for the calculation of the tax<br />
expense.<br />
12 Cash and cash equivalents<br />
Consolidated Parent<br />
<strong>2011</strong> 2010 <strong>2011</strong> 2010<br />
$’000 $’000 $’000 $’000<br />
Bank balances 152,999 132,780 45,959 617<br />
The Group’s exposure to interest rate risk and a sensitivity analysis for financial assets and liabilities are disclosed in Note 5 Risk<br />
management.<br />
13 Receivables<br />
Consolidated Parent<br />
<strong>2011</strong> 2010 <strong>2011</strong> 2010<br />
$’000 $’000 $’000 $’000<br />
Receivables 39,848 35,623 14,299 11,539<br />
Provision for impairment of receivables (32) (30) - -<br />
Interest receivable - related parties 156 186 - -<br />
Security bond 4,500 5,000 - -<br />
Other debtors 374 936 - 6<br />
Stockbroking debtors 6,242 3,245 - -<br />
Accrued income 21,980 22,708 43 2<br />
73,068 67,668 14,342 11,547<br />
The Group’s exposure to credit and currency risks, and impairment losses related to trade and other receivables, is disclosed in Note 5<br />
Risk management.<br />
page 81
IOOF | <strong>annual</strong> <strong>report</strong> <strong>2011</strong><br />
Notes to the financial statements (cont’d)<br />
For the year ended 30 June <strong>2011</strong><br />
14 Other financial assets<br />
Consolidated Parent<br />
<strong>2011</strong> 2010 <strong>2011</strong> 2010<br />
$’000 $’000 $’000 $’000<br />
Fair value through profit or loss<br />
Certificates of deposit and bank bills 2,428 2,708 - -<br />
Shares in listed companies 572 143 - -<br />
Unlisted unit trusts 5,029 3,628 - -<br />
8,029 6,479 - -<br />
Available-for-sale investments 28,577 23,179 - -<br />
Loans and other receivables<br />
Loans to directors and executives (i) 10,008 9,165 - -<br />
Seed capital receivable 7,153 7,153 - -<br />
Receivables from statutory benefit funds and other related parties 6,796 1,723 61,819 35,052<br />
Other 10 55 - 54<br />
23,967 18,096 61,819 35,106<br />
Investments carried at cost less accumulated impairment<br />
Investments in subsidiaries - - 849,796 849,796<br />
Investments in associates - - 864 -<br />
- - 850,660 849,796<br />
(i) Loans to directors and executives<br />
Loans to directors of controlled entities<br />
60,573 47,754 912,479 884,902<br />
The loans referred to above relate to amounts advanced to the Directors of controlled entities, Mr A Patterson, Mr A Mulcahy, Mr L<br />
Mickelburough and Mr R Macdougall. The amounts were advanced by Perennial Investment Partners Ltd to Directors for the specific<br />
purpose of assisting them to acquire an equity interest in subsidiaries of IOOF or in the case of Mr A Patterson another related party,<br />
Perennial Value Management Ltd. The secured interest bearing loans totalling $1,718,790 were made on commercial terms and<br />
conditions and unsecured loans to the value of $925,650 (2010: $925,650) are interest free.<br />
Loans to directors of associates<br />
The Director of an associate entity who received the loans referred to above was Mr J Murray. The amounts were advanced by<br />
Perennial Investment Partners Ltd for the specific purpose of assisting him to acquire an equity interest in another related party,<br />
Perennial Value Management Ltd. The parties to the loans are permitted to discharge the loans by transferring the shares to the lender.<br />
Secured interest bearing loans totalling $4,246,831 were made on commercial terms and conditions and unsecured loans to the value<br />
of $790,180 (2010: $790,180) are interest free.<br />
page 82
IOOF | <strong>annual</strong> <strong>report</strong> <strong>2011</strong><br />
15 Other assets<br />
Consolidated Parent<br />
<strong>2011</strong> 2010 <strong>2011</strong> 2010<br />
$’000 $’000 $’000 $’000<br />
Prepayments 9,370 7,442 - -<br />
Deferred acquisition costs 15,591 20,366 - -<br />
24,961 27,808 - -<br />
16 Investments in equity-accounted investees<br />
Consolidated Parent<br />
<strong>2011</strong> 2010 <strong>2011</strong> 2010<br />
$’000 $’000 $’000 $’000<br />
Investment in associated entities 14,739 12,891 - -<br />
Name of entity<br />
Country of<br />
incorporation<br />
Ownership interest<br />
<strong>2011</strong> 2010<br />
Carrying<br />
value<br />
Group’s Share<br />
of Profit/(Loss)<br />
% % $’000 $’000<br />
Associates<br />
Perennial Value Management Ltd (i) Australia 52.4 52.4 9,470 9,053<br />
Police & Nurses Financial Planning Australia 35.0 35.0 1,014 14<br />
Pty Ltd<br />
Kiewa Street Planners Pty Ltd Australia 40.0 - 1,229 68<br />
Patron Financial Trust Australia 26.0 - 867 3<br />
Other Associates 2,159 63<br />
14,739 9,201<br />
(i) At 30 June <strong>2011</strong>, Perennial Investment Partners Ltd had a 52.4% (30 June 2010: 52.4%) shareholding interest in Perennial Value Management Ltd with a 42.4% (30 June<br />
2010: 42.4%) dividend entitlement to the profits of Perennial Value Management Ltd. Due to the voting rights associated with different classes of shares in Perennial<br />
Value Management Ltd, this ownership interest does not result in control. However, Perennial Investment Partners Ltd can significantly influence Perennial Value<br />
Management Ltd under the terms of the agreement between these entities.<br />
The Group’s share of profit in its equity accounted investees for the year was $9,201,000 (2010: $7,588,000). A summary of financial<br />
information of the investments accounted for using the equity method, not adjusted for the percentage ownership held by the Group<br />
follows.<br />
Assets Liabilities Revenues Net Profit/(Loss)<br />
$’000 $’000 $’000 $’000<br />
30 June <strong>2011</strong><br />
Investment in associated entities 24,081 5,979 50,620 22,463<br />
30 June 2010<br />
Investment in associated entities 20,843 5,144 32,771 18,407<br />
Dividends received from associates<br />
During the year, the Group received dividends of $9,378,000 (2010: $6,411,000) from its associates.<br />
page 83
IOOF | <strong>annual</strong> <strong>report</strong> <strong>2011</strong><br />
Notes to the financial statements (cont’d)<br />
For the year ended 30 June <strong>2011</strong><br />
17 Property and equipment<br />
Consolidated Parent<br />
<strong>2011</strong> 2010 <strong>2011</strong> 2010<br />
$’000 $’000 $’000 $’000<br />
Cost or deemed cost 41,225 34,385 - 78<br />
Accumulated depreciation (28,672) (26,220) - (78)<br />
12,553 8,165 - -<br />
Carrying value<br />
Office equipment<br />
Consolidated<br />
Leasehold<br />
improvements<br />
Equipment under<br />
finance lease<br />
Total<br />
$’000 $’000 $’000 $’000<br />
Balance at 1 July 2009 6,244 6,173 204 12,621<br />
Acquisitions through business combinations 26 - - 26<br />
Additions 716 370 51 1,137<br />
Disposals (108) (571) - (679)<br />
Depreciation/amortisation (2,636) (2,174) (130) (4,940)<br />
Balance at 30 June 2010 4,242 3,798 125 8,165<br />
Balance at 1 July 2010 4,242 3,798 125 8,165<br />
Additions 4,560 3,821 - 8,381<br />
Disposals (236) (17) (7) (260)<br />
Depreciation/amortisation (2,304) (1,343) (86) (3,733)<br />
Balance at 30 June <strong>2011</strong> 6,262 6,259 32 12,553<br />
18 Goodwill<br />
Consolidated Parent<br />
<strong>2011</strong> 2010 <strong>2011</strong> 2010<br />
$’000 $’000 $’000 $’000<br />
Cost 496,465 496,465 - -<br />
Accumulated impairment (4,609) (4,609) - -<br />
491,856 491,856 - -<br />
Consolidated<br />
<strong>2011</strong> 2010<br />
$’000 $’000<br />
Carrying value 491,856 479,455<br />
Derecognition of non-controlling interests subject to buy-back (i) - 12,401<br />
Balance at 30 June 491,856 491,856<br />
(i) The derecognition of non-controlling interests subject to buy-back relates to agreements entered into prior to 1 July 2009.<br />
page 84
IOOF | <strong>annual</strong> <strong>report</strong> <strong>2011</strong><br />
Impairment testing for cash-generating units containing goodwill<br />
For the purposes of impairment testing, goodwill is allocated to the Group’s operating divisions, or cash-generating units (CGUs),<br />
which represent the lowest level within the Group at which the goodwill is monitored for internal management purposes.<br />
Each CGU is not higher than the Group’s operating segments as <strong>report</strong>ed in Note 7 operating segments.<br />
The aggregate carrying amounts of goodwill allocated to each unit are as follows:<br />
Consolidated<br />
<strong>2011</strong> 2010<br />
$’000 $’000<br />
Platform management and administration 329,213 329,213<br />
Multi manager 39,735 39,735<br />
Perennial group 110,215 110,215<br />
Consultum 723 723<br />
IOOF Ltd 11,970 11,970<br />
491,856 491,856<br />
The recoverable amounts for the relevant CGUs have been determined based on value-in-use calculations using first year cash flow<br />
projections from 2012 financial budgets approved by management and the Board. The manner in which the Group conducts each<br />
impairment assessment for years 2 to 5 and into perpetuity is discussed below by each relevant CGU.<br />
CGU Consultum Perennial group Multi manager IOOF Ltd Platform<br />
Management &<br />
Administration<br />
Value in Use element<br />
Cash inflows years 2 - 5 A C B D B<br />
Cash outflows years 2 - 5 E E E D E<br />
Cash flows - perpetuity<br />
3% growth from<br />
year 5<br />
3% growth from<br />
year 5<br />
3% growth from<br />
year 5<br />
D<br />
3% growth from<br />
year 5<br />
A<br />
Reserve Bank of Australia forecast GDP growth rate<br />
B Observed Australian managed funds <strong>annual</strong> compounding growth for March 2006 to March <strong>2011</strong><br />
C Observed Australian equities and units in trusts <strong>annual</strong> compounding growth for March 2006 to March <strong>2011</strong><br />
D Observed Australian friendly societies’ <strong>annual</strong> compounding rate of decline for March 2006 to March <strong>2011</strong><br />
E<br />
Blended rate of the underlying Australian forecast inflation levels and the applicable Reserve Bank of Australia GDP growth rate<br />
The growth rates applied do not exceed the long-term average growth rate for businesses in which each CGU operates. The discount<br />
rate of 17.3% used reflects the Group’s pre-tax nominal weighted average cost of capital. Management’s assessment of goodwill’s<br />
value-in-use exceeds the value of goodwill allocated to these CGUs, therefore any reasonably possible changes to assumptions used<br />
in management’s assessment will not result in impairment.<br />
Management has applied post tax WACC increments of 1% for the Perennial Group and 3.5% for Consultum to reflect specific<br />
company risk premiums. These incremental amounts are judgement based and are consistent with accepted valuation industry<br />
practice.<br />
In respect of the Perennial Group, goodwill has arisen from the acquisition of equity in Perennial Investment Partners Ltd and Perennial<br />
Fixed Interest Partners Pty Ltd while further goodwill has been recorded upon the recognition of an obligation the Group has to<br />
acquire shares from Perennial executives under shareholder agreements. These shareholder agreements involve the executives of<br />
Perennial Fixed Interest Partners Pty Ltd, Perennial Real Estate Investments Pty Ltd and Perennial Growth Management Pty Ltd.<br />
page 85
IOOF | <strong>annual</strong> <strong>report</strong> <strong>2011</strong><br />
Notes to the financial statements (cont’d)<br />
For the year ended 30 June <strong>2011</strong><br />
19 Other intangible assets<br />
Consolidated Parent<br />
<strong>2011</strong> 2010 <strong>2011</strong> 2010<br />
$’000 $’000 $’000 $’000<br />
Cost 302,684 307,195 - -<br />
Accumulated amortisation and impairment losses (43,687) (30,501) - -<br />
258,997 276,694 - -<br />
Consolidated<br />
Adviser Computer Customer Brand names Contract<br />
Total<br />
relationships software relationships<br />
agreements<br />
$’000 $’000 $’000 $’000 $’000 $’000<br />
Carrying value<br />
Balance at 1 July 2009 1,560 6,269 250,934 22,653 9,029 290,445<br />
Additions 2,090 250 1,814 - - 4,154<br />
Amortisation for the year (961) (1,503) (13,669) (801) (971) (17,905)<br />
Balance at 30 June 2010 2,689 5,016 239,079 21,852 8,058 276,694<br />
Balance at 1 July 2010 2,689 5,016 239,079 21,852 8,058 276,694<br />
Additions - 307 - - - 307<br />
Disposals - - (24) - - (24)<br />
Amortisation for the year (916) (1,408) (13,884) (801) (971) (17,980)<br />
Balance at 30 June <strong>2011</strong> 1,773 3,915 225,171 21,051 7,087 258,997<br />
Impairment testing for cash-generating units<br />
containing indefinite life intangible assets<br />
For the purposes of impairment testing, indefinite life<br />
intangibles are allocated to the Group’s operating divisions,<br />
or CGUs, which represent the lowest level within the Group<br />
at which the goodwill is monitored for internal management<br />
purposes.<br />
Each CGU is not higher than the Group’s operating segments<br />
as <strong>report</strong>ed in Note 7 operating segments.<br />
The aggregate carrying amounts of indefinite-life intangible<br />
assets allocated to each CGU are as follows:<br />
Consolidated<br />
Indefinite life intangibles<br />
<strong>2011</strong> 2010<br />
$’000 $’000<br />
The indefinite life intangible asset relates to the Ord Minnett<br />
brand name. In designating the Ord Minnett brand name as<br />
indefinite life, consideration was given to the length of time<br />
the brand name has been in existence and it was determined<br />
that there is no foreseeable limit to the period over which the<br />
brand name is expected to generate net cash inflows for the<br />
Group.<br />
The recoverable amount for the Ord Minnett group brand<br />
name has been determined based on a royalty savings<br />
method of calculating value in use. The calculation<br />
incorporates estimated costs of brand maintenance. The<br />
discount rate of 17% used reflects the Group’s pre-tax nominal<br />
weighted average cost of capital. Management’s assessment of<br />
indefinite life intangible value-in-use exceeds the value of the<br />
intangible asset allocated to the CGU, therefore any reasonably<br />
possible changes to assumptions used in management’s<br />
assessment will not result in impairment.<br />
Ord Minnett group 6,773 6,773<br />
page 86
IOOF | <strong>annual</strong> <strong>report</strong> <strong>2011</strong><br />
20 Deferred tax assets and liabilities<br />
Consolidated Parent<br />
<strong>2011</strong> 2010 <strong>2011</strong> 2010<br />
$’000 $’000 $’000 $’000<br />
Deferred tax asset balance comprises temporary differences attributable to:<br />
Employee benefits 8,603 8,755 - -<br />
Staff incentives 2,183 2,645 - -<br />
Impairment of receivables 9 9 - -<br />
Provision for legal costs 382 615 - 165<br />
Provisions, accruals and creditors 3,181 3,209 - -<br />
Fixed assets and computer software 1,496 2,231 2 18<br />
Unrealised investment gains and losses 115 237 - -<br />
Carry forward capital and revenue losses 827 606 594 -<br />
Deferred fee income 3,810 4,991 - -<br />
Other 1,026 1,503 94 596<br />
Deferred tax asset balance as at 30 June 21,632 24,801 690 779<br />
Set-off of deferred tax liabilities pursuant to set-off provisions (21,632) (14,144) (690) (1)<br />
Net deferred tax asset balance as at 30 June - 10,657 - 778<br />
Deferred tax liability balance comprises temporary differences attributable to:<br />
Unrealised gains 3,279 1,643 - -<br />
Deferred acquisition costs 4,677 6,109 - -<br />
Accrued income 3,262 3,083 13 1<br />
Customer relationships 78 3,057 - -<br />
Prepayments 620 252 - -<br />
Uncertain tax position 13,790 - 13,790 -<br />
25,706 14,144 13,803 1<br />
Set-off of deferred tax liabilities pursuant to set-off provisions (21,632) (14,144) (690) (1)<br />
Net deferred tax liability balance as at 30 June 4,074 - 13,113 -<br />
Reconciliation of movements<br />
Net carrying amounts at the beginning of the year 10,657 16,752 778 1,733<br />
Acquisitions and disposals - 179 - -<br />
Credited/(charged) to profit or loss (Note 11) 925 2,735 (101) (955)<br />
Temporary differences directly attributable to equity (1,866) (1,643) - -<br />
Tax losses - (7,366) - -<br />
Uncertain tax position (13,790) - (13,790) -<br />
Carrying amount at the end of the year (4,074) 10,657 (13,113) 778<br />
Unrecognised deferred tax assets<br />
Deferred tax assets have not been recognised in respect of the following items:<br />
Consolidated Parent<br />
<strong>2011</strong> 2010 <strong>2011</strong> 2010<br />
$’000 $’000 $’000 $’000<br />
Deductible temporary differences - - - -<br />
Tax losses 1,908 1,908 - -<br />
1,908 1,908 - -<br />
Potential tax benefit 572 572 - -<br />
The deductible temporary differences and tax losses do not expire under current tax legislation. Deferred tax assets have not been<br />
recognised in respect of these items because it is not probable that future taxable profit will be available against which the Group can<br />
utilise the benefits there from.<br />
page 87
IOOF | <strong>annual</strong> <strong>report</strong> <strong>2011</strong><br />
Notes to the financial statements (cont’d)<br />
For the year ended 30 June <strong>2011</strong><br />
21 Payables<br />
Consolidated Parent<br />
<strong>2011</strong> 2010 <strong>2011</strong> 2010<br />
$’000 $’000 $’000 $’000<br />
Accounts payable 30,649 29,248 70 -<br />
Income received in advance 859 2,439 - -<br />
Accrued expenses 15,478 13,141 - -<br />
Goods and service tax payable 3,678 3,573 - 80<br />
50,664 48,401 70 80<br />
Payables are non-interest bearing and are expected to be paid within 12 months from the financial year end. The Group’s exposure to<br />
currency risk is disclosed in Note 5 Risk management.<br />
22 Borrowings<br />
This note provides information about the contractual terms of the Group’s interest-bearing borrowings, which are measured at<br />
amortised cost.<br />
For more information about the Group’s exposure to interest rate and liquidity risk, see Note 5 Risk management.<br />
Cash Advance & Working Capital Facility drawn - Commonwealth Bank<br />
of Australia (a)<br />
Consolidated Parent<br />
<strong>2011</strong> 2010 <strong>2011</strong> 2010<br />
$’000 $’000 $’000 $’000<br />
- 14,500 - -<br />
Loan from controlled entity - - 10,000 10,000<br />
Finance lease liabilities (c) 38 128 - -<br />
38 14,628 10,000 10,000<br />
(a) Cash advance and working capital facility<br />
The cash advance facilities and working capital facility is provided under an Australian dollar line of credit facility, to which unrestricted<br />
access was available at balance date as follows:<br />
Consolidated<br />
<strong>2011</strong> 2010<br />
$’000 $’000<br />
Total facilities 25,000 44,500<br />
Used at 30 June - 14,500<br />
Unused at 30 June 25,000 30,000<br />
The cash advance facility provided by Commonwealth Bank of Australia may be drawn down on at any time following the 2 business<br />
day accommodation notice required by the lender. The base interest rate is the average bid rate displayed on the first day of the<br />
period on Reuters page BBSY at or about 10:10am Melbourne time for bank accepted bills on that day having a tenor of 90 days (or<br />
such other time as may be agreed with the bank) and a margin of 0.5% per annum.<br />
The financial liability under the facility has a fair value equal to its carrying amount.<br />
Further information about the Group’s exposure to risks arising from borrowings is provided in Note 5 Risk management.<br />
page 88
IOOF | <strong>annual</strong> <strong>report</strong> <strong>2011</strong><br />
(b) Other bank facilities<br />
In addition to the cash advance and working capital facilities, the Group has a number of facilities with the Commonwealth Bank of<br />
Australia. These include equipment finance, MasterCard and contingent liability facilities. The aggregate of these facilities are $35.4<br />
million.<br />
(c) Finance lease liabilities<br />
Future<br />
minimum lease<br />
payments<br />
Consolidated <strong>2011</strong> Consolidated 2010<br />
Present value<br />
of minimum<br />
lease payments<br />
Future<br />
minimum lease<br />
payments<br />
Present value<br />
of minimum<br />
lease payments<br />
Finance lease liabilities of the Group are payable as follows: $’000 $’000 $’000 $’000<br />
Less than one year 19 18 93 93<br />
Between one and five years 21 20 40 35<br />
40 38 133 128<br />
Less future finance charges (2) (5)<br />
38 128<br />
23 Other financial liabilities<br />
Consolidated Parent<br />
<strong>2011</strong> 2010 <strong>2011</strong> 2010<br />
$’000 $’000 $’000 $’000<br />
Share buy-back liability 43,112 37,357 - -<br />
A liability has been recognised in respect of an obligation by the Group to buy back vested shares in some Perennial Group<br />
subsidiaries under certain circumstances. The above liabilities are recorded at fair value.<br />
Further information about the Group’s exposure to risks arising from other financial liabilities is provided in Note 5 Risk management.<br />
24 Provisions<br />
Consolidated Parent<br />
<strong>2011</strong> 2010 <strong>2011</strong> 2010<br />
$’000 $’000 $’000 $’000<br />
Employee entitlements 37,328 38,080 - -<br />
Directors’ retirement 659 594 - -<br />
Onerous contracts 730 3,082 - -<br />
Restructuring - 998 - -<br />
Other provisions 1,662 2,834 - 550<br />
40,379 45,588 - 550<br />
page 89
IOOF | <strong>annual</strong> <strong>report</strong> <strong>2011</strong><br />
Notes to the financial statements (cont’d)<br />
For the year ended 30 June <strong>2011</strong><br />
Directors’<br />
retirement<br />
Onerous<br />
contracts<br />
Restructuring<br />
Consolidated<br />
Employee<br />
entitlements<br />
Other<br />
Total<br />
$’000 $’000 $’000 $’000 $’000 $’000<br />
Balance at 1 July 2010 594 3,082 998 38,080 2,834 45,588<br />
Provisions made during the period 65 - - 18,651 376 19,092<br />
Provisions utilised during the period - (2,352) (998) (19,403) (1,548) (24,301)<br />
Balance at 30 June <strong>2011</strong> 659 730 - 37,328 1,662 40,379<br />
Balance at 1 July 2010 550<br />
Provisions made during the period 210<br />
Provisions utilised during the period (760)<br />
Balance at 30 June <strong>2011</strong> -<br />
Directors’ retirement provision<br />
Directors appointed prior to 13 April 2003 are entitled to participate in a retirement benefits program which provides a cash based<br />
benefit to Non-Executive Directors at the time of their retirement from the Board.<br />
Onerous contracts<br />
The provision for onerous contracts represents the value of future lease payments net of anticipated recoveries from third parties,<br />
that the Group is presently obligated to make under non-cancellable operating lease contracts. The estimate may vary as a result of<br />
changes in the utilisation of the leased premises and sub-lease arrangements where applicable. The unexpired term of these leases is<br />
less than 1 year and 3 months.<br />
Other provisions<br />
Other provisions have been made for the present value of the Directors’ best estimates of legal settlements. The information usually<br />
required by AASB 137 Provisions, Contingent Liabilities and Contingent Assets, is not disclosed on the grounds that it can be expected<br />
to prejudice the outcome of the litigation.<br />
25 Other liabilities<br />
Consolidated Parent<br />
<strong>2011</strong> 2010 <strong>2011</strong> 2010<br />
$’000 $’000 $’000 $’000<br />
Deferred revenue liability 15,431 19,516 - -<br />
Lease incentives 1,962 1,482 - -<br />
17,393 20,998 - -<br />
Parent<br />
Other<br />
$’000<br />
page 90
IOOF | <strong>annual</strong> <strong>report</strong> <strong>2011</strong><br />
26 Share capital<br />
Consolidated Parent<br />
<strong>2011</strong> 2010 <strong>2011</strong> 2010<br />
$’000 $’000 $’000 $’000<br />
231,903,558 fully paid ordinary shares (2010: 230,156,479) 868,451 858,178 868,451 858,628<br />
The Company does not have authorised capital or par value in respect of its issued shares. All issued shares are fully paid.<br />
The holders of ordinary shares are entitled to receive dividends as declared from time to time, and are entitled to one vote per share at<br />
meetings of the Company. All shares rank equally with regard to the Company’s residual assets.<br />
Consolidated<br />
<strong>2011</strong> <strong>2011</strong> 2010 2010<br />
No. ’000 $’000 No. ’000 $’000<br />
Ordinary shares<br />
On issue at 1 July 230,156 858,181 229,795 855,106<br />
Adviser performance rights vested during the year (note 31) 46 453 27 234<br />
Issue of shares on exercise of options under executive and employee share option plan 1,702 9,464 334 1,670<br />
(note 31)<br />
Employee performance rights vested during the year (note 31) - 330 - 3,053<br />
Transfer from employee equity-settled benefits reserve on exercise of options (note 27) - 440 - 120<br />
Treasury shares transferred to employees during the year - (3) - (2,002)<br />
On-market purchase of treasury shares transferred to employees during the year - (414) - -<br />
On issue at 30 June 231,904 868,451 230,156 858,181<br />
Treasury shares<br />
On issue at 1 July (1) (3) (1,392) (5,497)<br />
Employee performance rights vested during the year (note 31) 1 3 507 2,002<br />
Treasury shares sold on-market - - 884 3,492<br />
On issue at 30 June - - (1) (3)<br />
231,904 868,451 230,155 858,178<br />
Parent<br />
<strong>2011</strong> <strong>2011</strong> 2010 2010<br />
No. ’000 $’000 No. ’000 $’000<br />
Ordinary shares<br />
On issue at 1 July 230,156 858,628 229,795 855,108<br />
Adviser performance rights vested during the year (note 31) 46 453 27 234<br />
Issue of shares on exercise of options under executive and employee share option plan 1,702 9,464 334 1,670<br />
(note 31)<br />
Employee performance rights vested during the year (note 31) - 330 - 3,053<br />
Transfer from employee equity-settled benefits reserve on exercise of options<br />
- 1,049 - 347<br />
(note 27)<br />
Transfer of lapsed share options - (1,077) - -<br />
Acquisition of treasury shares - (396) - (1,784)<br />
On issue at 30 June 231,904 868,451 230,156 858,628<br />
page 91
IOOF | <strong>annual</strong> <strong>report</strong> <strong>2011</strong><br />
Notes to the financial statements (cont’d)<br />
For the year ended 30 June <strong>2011</strong><br />
Treasury shares<br />
Treasury shares are shares bought or transferred to the IOOF<br />
Executive Performance Share Plan Trust in respect of the<br />
employee share scheme. The Executive Performance Share<br />
Trust is controlled by the Group and is therefore consolidated.<br />
Capital risk management<br />
The Group’s and the Company’s objectives when managing<br />
capital is to safeguard their ability to continue as a going<br />
concern, so that they can continue to provide returns to<br />
shareholders and benefits to other stakeholders, and to<br />
maintain an optimal structure to reduce the cost of capital.<br />
In order to maintain or adjust the capital structure, the Group<br />
may adjust the amount of dividends paid to shareholders,<br />
return capital to shareholders, buy back its shares on market,<br />
issue new shares, sell assets, or otherwise adjust debt levels.<br />
The Group and the Company monitor capital on the basis of<br />
investment capital, working capital and regulatory capital.<br />
Investment capital is the Group’s capital that is not required for<br />
regulatory and working capital requirements of the business.<br />
The investment capital is invested in:<br />
• bank deposits<br />
• bank bills<br />
• subsidiaries<br />
• available-for-sale assets<br />
• unit trusts, as investments, and<br />
• Group operated unit trusts, as seed capital.<br />
Each subsidiary manages its own capital required to support<br />
planned business growth and meet regulatory requirements.<br />
Australian Prudential Regulation Authority (APRA) regulated<br />
subsidiaries have their own capital management plan which<br />
specifically addresses the regulatory requirements of that<br />
entity and sets a target surplus over minimum regulatory<br />
requirements. Regular monitoring of regulatory requirements<br />
ensures sufficient capital is available and appropriate planning<br />
is made to retain target surpluses. IOOF Holdings Ltd is<br />
primarily the provider of equity capital to its subsidiaries. Such<br />
investment is funded by IOOF Holding Ltd’s own investment<br />
capital, through capital issues, profit retention and, in some<br />
instances, by debt.<br />
Subsidiary capital generated in excess of planned requirements<br />
is returned to IOOF Holdings Ltd, usually by way of dividends.<br />
A standby facility is in place as a safeguard against a temporary<br />
need for funds and to provide a short term funding facility<br />
that allows the business to take advantage of acquisition<br />
opportunities as they arise.<br />
The weighted average cost of capital is regularly monitored.<br />
Funding decisions take into consideration the cost of debt<br />
versus the cost of equity with emphasis on the outcome that is<br />
best for shareholder interests.<br />
During <strong>2011</strong>, the Group’s capital risk management strategy was<br />
unchanged from 2010.<br />
Further information in relation to solvency requirements<br />
imposed by the Life Insurance Act is provided in note 40(h) Life<br />
Insurance Business – Solvency Requirements.<br />
The investment capital is available to support the organic<br />
development of new businesses and products and to respond<br />
to investment and growth opportunities such as acquisitions,<br />
as they arise. The seed capital is primarily available to support<br />
the business in establishing new products and is also used to<br />
support solvency requirements of the benefit funds.<br />
Working capital is the capital that is required to meet the day<br />
to day operations of the business.<br />
Regulatory capital is the capital which the Group is required to<br />
hold as determined by legislative and regulatory requirements<br />
in respect of its life insurance business and financial services<br />
licensed operations. During the year, the Group has complied<br />
with all externally imposed capital requirements to which it is<br />
subject.<br />
page 92
IOOF | <strong>annual</strong> <strong>report</strong> <strong>2011</strong><br />
27 Reserves<br />
Consolidated Parent<br />
<strong>2011</strong> 2010 <strong>2011</strong> 2010<br />
$’000 $’000 $’000 $’000<br />
Asset revaluation reserve 1,072 1,072 - -<br />
Available-for-sale investment revaluation reserve 5,283 1,751 - -<br />
Business combinations reserve (301) (301) - -<br />
Share buy back revaluation reserve (19,097) (9,124) - -<br />
Share-based payments reserve 5,287 3,278 8,246 5,903<br />
(7,756) (3,324) 8,246 5,903<br />
Consolidated Parent<br />
<strong>2011</strong> 2010 <strong>2011</strong> 2010<br />
$’000 $’000 $’000 $’000<br />
Asset revaluation reserve<br />
Balance at 1 July 1,072 1,072 - -<br />
Amount recognised during the year - - - -<br />
Balance at 30 June 1,072 1,072 - -<br />
The asset revaluation reserve has arisen on the revaluation of the existing 25% interest in the adviser relationship asset held at the time<br />
of the acquisition of Financial Partnership Pty Ltd.<br />
Consolidated Parent<br />
<strong>2011</strong> 2010 <strong>2011</strong> 2010<br />
$’000 $’000 $’000 $’000<br />
Available-for-sale investment revaluation reserve<br />
Balance at 1 July 1,751 441 - -<br />
Valuation gain/(loss) recognised 5,398 2,953 - -<br />
Related income tax (1,866) (1,643) - -<br />
Balance at 30 June 5,283 1,751 - -<br />
The available-for-sale investment revaluation reserve arises on the revaluation of available-for-sale financial assets. Where a revalued<br />
financial asset is sold that portion of the reserve which relates to that financial asset, and is effectively realised, is recognised in profit or<br />
loss. Where a revalued financial asset is impaired that portion of the reserve which relates to that financial asset is recognised in profit<br />
or loss.<br />
Consolidated Parent<br />
<strong>2011</strong> 2010 <strong>2011</strong> 2010<br />
$’000 $’000 $’000 $’000<br />
Business combinations reserve<br />
Balance at 1 July (301) - - -<br />
Acquisition of non-controlling interests - (301) - -<br />
Balance at 30 June (301) (301) - -<br />
page 93
IOOF | <strong>annual</strong> <strong>report</strong> <strong>2011</strong><br />
Notes to the financial statements (cont’d)<br />
For the year ended 30 June <strong>2011</strong><br />
The Group has applied AASB 127 (2008) for the acquisition of non-controlling interests. Under the new accounting policy, acquisitions<br />
of non-controlling interests are accounted for as transactions with equity holders in their capacity as equity holders and therefore no<br />
goodwill is recognised as a result of such transactions, movements are instead recorded in the business combinations reserve.<br />
Consolidated Parent<br />
<strong>2011</strong> 2010 <strong>2011</strong> 2010<br />
$’000 $’000 $’000 $’000<br />
Share buy back revaluation reserve<br />
Balance at 1 July (9,124) 15 - -<br />
Valuation gain/(loss) recognised (10,112) (9,139) - -<br />
Derecognition of non-controlling interest subject to buy-back 139 - - -<br />
Balance at 30 June (19,097) (9,124) - -<br />
Refer to note 4 to the financial statements for further information on the change in accounting policy and restatement.<br />
Consolidated Parent<br />
<strong>2011</strong> 2010 <strong>2011</strong> 2010<br />
$’000 $’000 $’000 $’000<br />
Share-based payments reserve<br />
Balance at 1 July 3,278 4,658 5,903 7,642<br />
Share-based payments expense recognised (note 9) 3,232 2,027 - -<br />
Share-based payment expense recognised in controlled entities - - 3,098 1,895<br />
Transfer of lapsed share options - - 1,077 -<br />
Transfer to issued capital on exercise of options (note 31) (440) (120) (1,049) (347)<br />
Adviser performance rights vested during the year (note 26) (453) (234) (453) (234)<br />
Performance rights vested during the year (note 31) (330) (3,053) (330) (3,053)<br />
Balance at 30 June 5,287 3,278 8,246 5,903<br />
The equity-settled employee benefits reserve arises on the grant of performance rights and share options to executives and senior<br />
employees under the employee share plan. Amounts are transferred out of the reserve and into issued capital when the shares are<br />
transferred to employees or options are exercised.<br />
Further information about share-based payments to employees is made in note 31 to the financial statements.<br />
28 Retained earnings<br />
Consolidated Parent<br />
<strong>2011</strong> 2010 <strong>2011</strong> 2010<br />
$’000 $’000 $’000 $’000<br />
Balance at 1 July 15,583 14,388 2,120 13,569<br />
Profit for the period attributable to owners of the Company 99,489 77,371 131,328 66,747<br />
Profit/(loss) for the period attributable to policyholders of the IOOF Life<br />
(11) 171 - -<br />
Statutory Fund<br />
Dividends paid (89,935) (77,841) (89,935) (78,196)<br />
Profit on treasury shares sold on-market - 1,494 - -<br />
Balance at 30 June 25,126 15,583 43,513 2,120<br />
Retained earnings has been restated as a result of the change in accounting policy for share buy-back liabilities. Refer to note 4 for<br />
further information.<br />
page 94
IOOF | <strong>annual</strong> <strong>report</strong> <strong>2011</strong><br />
29 Dividends<br />
The following dividends were declared and paid by the Group:<br />
<strong>2011</strong><br />
Cents per<br />
share<br />
Total<br />
amount<br />
$’000<br />
Date of<br />
payment<br />
Franked /<br />
Unfranked<br />
Final 2010 dividend 18.0 41,443 13 October 2010 Franked<br />
Interim <strong>2011</strong> dividend 21.0 48,492 23 March <strong>2011</strong> Franked<br />
39.0 89,935<br />
2010<br />
Special dividend 13.0 29,877 31 July 2009 Franked<br />
Final 2009 dividend 4.0 9,193 16 October 2009 Franked<br />
Interim 2010 dividend 17.0 39,127 24 March 2010 Franked<br />
34.0 78,197<br />
Franked dividends declared or paid during the year were franked at the tax rate of 30 per cent.<br />
Dividend amounts are inclusive of any dividends paid on Treasury Shares.<br />
After 30 June <strong>2011</strong> the following dividends were declared by the directors. The dividends have not been provided for and there are no<br />
income tax consequences.<br />
Cents per<br />
share<br />
Total<br />
amount<br />
$’000<br />
Date of<br />
payment<br />
Franked /<br />
Unfranked<br />
Final <strong>2011</strong> dividend 22.0 51,019 20 October <strong>2011</strong> Franked<br />
Company<br />
<strong>2011</strong> 2010<br />
$’000 $’000<br />
Dividend franking account<br />
30 per cent franking credits available to shareholders of IOOF Holdings Ltd for subsequent financial years 13,920 39,002<br />
The above available amounts are based on the balance of the dividend franking account at year-end adjusted for:<br />
a franking credits that will arise from the payment of the current tax liabilities; and<br />
b franking credits that the entity may be prevented from distributing in subsequent years.<br />
The ability to utilise the franking credits is dependent upon there being sufficient available profits to declare dividends. The impact<br />
on the dividend franking account of dividends declared after the balance date but not recognised as a liability is to reduce it by<br />
$21,865,000 (2010: $17,755,000).<br />
30 Earnings per share<br />
Consolidated<br />
<strong>2011</strong> 2010<br />
cents<br />
cents<br />
Basic earnings per share 43.1 33.7<br />
Diluted earnings per share 42.9 33.6<br />
page 95
IOOF | <strong>annual</strong> <strong>report</strong> <strong>2011</strong><br />
Notes to the financial statements (cont’d)<br />
For the year ended 30 June <strong>2011</strong><br />
Basic earnings per share<br />
The earnings and weighted average number of ordinary shares used in the calculation of basic earnings per share are as follows:<br />
$’000 $’000<br />
Profit for the period attributable to owners of the Company 99,489 77,371<br />
Earnings used in the calculation of basic EPS 99,489 77,371<br />
Weighted average number of ordinary shares No. ’000 No. ’000<br />
Weighted average number of ordinary shares (basic) 230,676 229,922<br />
Effect of unvested performance rights 580 683<br />
Effect of share options on issue 654 309<br />
Weighted average number of ordinary shares (diluted) 231,910 230,914<br />
At 30 June <strong>2011</strong>, 1,164,122 options were excluded from the diluted weighted average number of ordinary shares calculation as their<br />
effect would not have been dilutive.<br />
The average market value of the Company’s shares for purposes of calculating the dilutive effect of share options was based on<br />
quoted market prices for the period during which the options were outstanding.<br />
31 Share-based payments<br />
The Group operates a number of employee share and option<br />
schemes under the IOOF Executive Share Option Plan, the<br />
IOOF Executive Performance Share Plan and the Non-Executive<br />
Director Deferred Share Purchase Plan and the IOOF Deferred<br />
Share Plan for the Managing Director.<br />
IOOF Executive Share Option Plan<br />
The Group has an ownership-based compensation scheme<br />
for executives and senior employees of the Group. The<br />
establishment of the employee share option plans were<br />
approved by the Board of Directors.<br />
Selected employees may be granted options which entitle<br />
them to purchase ordinary fully paid shares in IFL at a price<br />
fixed at the time the options are granted. Voting and dividend<br />
rights will be attached to the unissued ordinary shares when<br />
the options have been exercised. Options may be exercised at<br />
any time from the date of vesting to the date of their expiry.<br />
The Remuneration and Nominations Committee regards the<br />
grant of options to employees as an appropriate long-term<br />
incentive and retention component of total remuneration for<br />
executives and senior employees. It is expected that future<br />
<strong>annual</strong> grants of options will be made, the vesting of which will<br />
be subject to attainment of appropriate performance hurdles<br />
and on the basis of continuing employment with the Group.<br />
Options granted under the plan carry no dividend or voting<br />
rights. All plans are equity-settled.<br />
IOOF Executive Performance Share Plan<br />
The IOOF Executive Performance Share Plan is the vehicle used<br />
to deliver equity based incentives to executives and senior<br />
employees of the Group.<br />
Each employee receives ordinary shares of the Company on<br />
vesting of the performance rights. No amounts are paid or<br />
payable by the recipient on receipt of the performance rights<br />
or on vesting. The performance rights carry neither rights to<br />
dividends nor voting rights prior to vesting.<br />
The Remuneration and Nominations Committee regards the<br />
grant of performance rights to employees as an appropriate<br />
long-term incentive and retention component of total<br />
remuneration for executives and senior employees. It is<br />
expected that future <strong>annual</strong> grants of performance rights will<br />
be made, the vesting of which will be subject to attainment<br />
of appropriate performance hurdles and on the basis of<br />
continuing employment with the Group.<br />
Performance rights granted under the plan carry no dividend<br />
or voting rights. All plans are equity-settled.<br />
Non-Executive Director (NED) Share Purchase<br />
Plan<br />
Each Non-Executive Director is eligible to participate in the<br />
NED Share Purchase Plan. The NED Share Purchase Plan is a<br />
NED salary sacrifice plan and is not captured as a share based<br />
payment expense.<br />
Deferred Share Plan<br />
A Short Term Incentive (STI) mandatory deferral program was<br />
implemented from 2010, with equity deferral relating to 50% of<br />
the Managing Directors’ STI for that year. In <strong>2011</strong>, one third of<br />
the Managing Directors’ STI was deferred into equity.<br />
page 96
IOOF | <strong>annual</strong> <strong>report</strong> <strong>2011</strong><br />
The following share-based payment arrangements were in existence during the current and comparative <strong>report</strong>ing periods:<br />
Options Series - Recipient Exercise price Vesting date Exercise period Performance related vesting conditions<br />
$ Commence Expires<br />
2010-5 Managing Director 6.93 23-Nov-2013 23-Nov-2013 23-Nov-2016 Earnings per share & return on equity<br />
2010-5 Managing Director 6.93 23-Nov-2014 23-Nov-2014 23-Nov-2016 Earnings per share & return on equity<br />
2010-5 Managing Director 6.93 23-Nov-2015 23-Nov-2015 23-Nov-2016 Earnings per share & return on equity<br />
2010-4 Senior Management 6.14 01-Jul-2013 01-Jul-2013 30-Jun-2015 Nil<br />
2010-3 Senior Management 7.01 04-May-2013 04-May-2013 04-May-2016 Nil<br />
2010-2 Senior Management 7.40 31-Jul-2010 01-Aug-2013 02-Aug-2014 Nil<br />
2010-2 Senior Management 7.40 31-Jul-<strong>2011</strong> 01-Aug-2013 02-Aug-2014 Nil<br />
2010-2 Senior Management 7.40 31-Jul-2012 01-Aug-2013 02-Aug-2014 Nil<br />
2010-2 Senior Management 7.40 31-Jul-2013 01-Aug-2013 02-Aug-2014 Nil<br />
2010-2 Senior Management 7.40 30-Jun-2013 01-Aug-2013 02-Aug-2014 FUM target & earnings per share (1)<br />
2009-20 Senior Management 5.68 31-Jul-2009 01-Aug-2012 02-Aug-2013 Nil<br />
2009-20 Senior Management 5.68 31-Jul-2010 01-Aug-2012 02-Aug-2013 Nil<br />
2009-20 Senior Management 5.68 31-Jul-<strong>2011</strong> 01-Aug-2012 02-Aug-2013 Nil<br />
2009-20 Senior Management 5.68 31-Jul-2012 01-Aug-2012 02-Aug-2013 Nil<br />
2009-20 Senior Management 5.68 30-Jun-2012 01-Aug-2012 02-Aug-2013 FUM target & earnings per share (1)<br />
2009-16 Managing Director 5.20 27-Nov-2012 27-Nov-2012 27-Nov-2015 Earnings per share & return on equity<br />
2009-16 Managing Director 5.20 27-Nov-2013 27-Nov-2013 27-Nov-2015 Earnings per share & return on equity<br />
2009-16 Managing Director 5.20 27-Nov-2014 27-Nov-2014 27-Nov-2015 Earnings per share & return on equity<br />
2008-08 Senior Management 3.15 31-Jul-08 02-Aug-<strong>2011</strong> 02-Aug-2012 Nil<br />
2008-08 Senior Management 3.15 31-Jul-09 02-Aug-<strong>2011</strong> 02-Aug-2012 Nil<br />
2008-08 Senior Management 3.15 31-Jul-10 02-Aug-<strong>2011</strong> 02-Aug-2012 Nil<br />
2008-08 Senior Management 3.15 31-Jul-11 02-Aug-<strong>2011</strong> 02-Aug-2012 Nil<br />
2008-08 Senior Management 3.15 30-Jun-11 02-Aug-<strong>2011</strong> 02-Aug-2012 FUM target & earnings per share (1)<br />
Legacy options series<br />
2009-21 Senior Management 3.15 30-Apr-2009 30-Apr-2009 31-Dec-2010 Nil<br />
2009-15 Former CEO 9.89 27-Nov-2009 27-Nov-2009 27-Nov-<strong>2011</strong> Nil<br />
2009-11 Senior Management 6.34 30-Jun-2009 30-Jun-2009 01-Jul-<strong>2011</strong> Nil<br />
2009-11 Senior Management 6.34 30-Jun-2010 30-Jun-2010 01-Jul-<strong>2011</strong> Nil<br />
2009-10 Managing Director 4.99 30-Jun-2009 30-Jun-2009 01-Jul-2012 Nil<br />
2009-09 Managing Director 9.99 30-Apr-2009 30-Apr-2009 22-Nov-2012 Nil<br />
2009-09 Managing Director 9.99 22-Nov-2009 22-Nov-2009 22-Nov-2012 Nil<br />
2009-09 Managing Director 9.99 22-Nov-2010 22-Nov-2010 22-Nov-2012 Nil<br />
2009-08 Senior Management 9.36 30-Apr-2009 30-Apr-2009 30-Jun-2013 Nil<br />
2009-08 Senior Management 9.36 05-Sep-2009 05-Sep-2009 30-Jun-2013 Nil<br />
2009-08 Senior Management 9.36 05-Sep-2010 05-Sep-2010 30-Jun-2013 Nil<br />
2009-07 Senior Management 9.36 30-Apr-2009 30-Apr-2009 30-Jun-2013 Nil<br />
2009-07 Senior Management 9.36 30-Jun-2009 30-Jun-2009 30-Jun-2013 Nil<br />
2009-07 Senior Management 9.36 30-Jun-2010 30-Jun-2010 30-Jun-2013 Nil<br />
2009-06 Senior Management 9.69 30-Apr-2009 30-Apr-2009 29-Mar-<strong>2011</strong> Nil<br />
2009-05 Senior Management 9.17 30-Apr-2009 30-Apr-2009 09-Jan-<strong>2011</strong> Nil<br />
2009-04 Senior Management 5.52 30-Apr-2009 30-Apr-2009 30-Nov-<strong>2011</strong> Nil<br />
2009-02 Senior Management 3.73 30-Apr-2009 30-Apr-2009 16-Jun-2014 Nil<br />
2009-01 Senior Management 2.98 30-Apr-2009 30-Apr-2009 15-Feb-2014 Nil<br />
2008-04 Senior Management 3.15 01-Jul-<strong>2011</strong> 01-Jul-<strong>2011</strong> 31-Dec-2010 Nil<br />
2008-05 Senior Management 3.15 01-Jul-<strong>2011</strong> 01-Jul-<strong>2011</strong> 31-Dec-2010 Nil<br />
(1) 50% of the rights and 50% of the options vest subject to achievement of the Perennial Group’s three year Funds Under Management forecast and 50% based on the<br />
achievement of a compounding Group cash earnings per share in excess of 10% each year over the performance period.<br />
page 97
IOOF | <strong>annual</strong> <strong>report</strong> <strong>2011</strong><br />
Notes to the financial statements (cont’d)<br />
For the year ended 30 June <strong>2011</strong><br />
On vesting of performance rights, ordinary shares are held in trust for up to two years from the vesting date, after which time they<br />
may remain in trust, be transferred to the employee’s name or sold. The employee receives all dividends on the ordinary shares while<br />
held in trust. The vesting of all issuances is subject to continuing employment.<br />
The following share-based payment arrangements were in existence during the current and comparative <strong>report</strong>ing periods:<br />
Performance Rights Series<br />
- Recipient<br />
Exercise<br />
price<br />
Vesting date Exercise period Performance related vesting conditions<br />
Commence Expires<br />
2010-6 Managing Director nil 23-Nov-13 23-Nov-13 23-Nov-16 Total shareholder return & return on equity<br />
2010-6 Managing Director nil 23-Nov-14 23-Nov-14 23-Nov-16 Total shareholder return & return on equity<br />
2010-6 Managing Director nil 23-Nov-15 23-Nov-15 23-Nov-16 Total shareholder return & return on equity<br />
2010-1 Senior Management nil 31-Jul-10 31-Jul-10 31-Jul-15 Nil<br />
2010-1 Senior Management nil 31-Jul-11 31-Jul-11 31-Jul-15 Nil<br />
2010-1 Senior Management nil 31-Jul-12 31-Jul-12 31-Jul-15 Nil<br />
2010-1 Senior Management nil 31-Jul-13 31-Jul-13 31-Jul-15 Nil<br />
2010-1 Senior Management nil 30-Jun-13 30-Jun-13 31-Jul-15 FUM target & earnings per share (1)<br />
2009-14 Managing Director nil 27-Nov-12 27-Nov-12 27-Nov-15 Total shareholder return & return on equity<br />
2009-14 Managing Director nil 27-Nov-13 27-Nov-13 27-Nov-15 Total shareholder return & return on equity<br />
2009-14 Managing Director nil 27-Nov-14 27-Nov-14 27-Nov-15 Total shareholder return & return on equity<br />
2008-07 Senior Management nil 31-Jul-09 31-Jul-09 31-Jul-14 Nil<br />
2008-07 Senior Management nil 31-Jul-10 31-Jul-10 31-Jul-14 Nil<br />
2008-07 Senior Management nil 31-Jul-11 31-Jul-11 31-Jul-14 Nil<br />
2008-07 Senior Management nil 31-Jul-12 31-Jul-12 31-Jul-14 Nil<br />
2008-07 Senior Management nil 30-Jun-12 30-Jun-12 31-Jul-14 FUM target & earnings per share (1)<br />
2007-05 Senior Management nil 31-Jul-09 31-Jul-09 31-Jul-13 Nil<br />
2007-05 Senior Management nil 31-Jul-10 31-Jul-10 31-Jul-13 Nil<br />
2007-05 Senior Management nil 31-Jul-11 31-Jul-11 31-Jul-13 Nil<br />
2007-05 Senior Management nil 30-Jun-11 30-Jun-11 31-Jul-13 Nil<br />
2007-05 Senior Management nil 30-Jun-11 30-Jun-11 31-Jul-13 FUM target & earnings per share (1)<br />
Legacy performance rights<br />
series<br />
2009-18 Advisers nil 30-Jun-12 30-Jun-12 30-Jun-12 Nil<br />
2008-06 Advisers nil 30-Jun-11 30-Jun-11 30-Jun-11 Nil<br />
2007-04 Advisers nil 30-Jun-10 30-Jun-10 30-Jun-10 Nil<br />
2009-17 Senior Management nil 01-Dec-12 01-Dec-12 01-Dec-14 Nil<br />
2008-02 Senior Management nil 30-Jun-10 30-Jun-10 30-Jun-13 Nil<br />
2008-02 Senior Management nil 30-Jun-11 30-Jun-11 30-Jun-13 FUM target & earnings per share (1)<br />
2008-01 Senior Management nil 01-Dec-11 01-Dec-11 01-Dec-13 Nil (2)<br />
2007-02 Senior Management nil 30-Jun-10 30-Jun-10 30-Jun-12 Nil (2)<br />
2007-01 Senior Management nil 01-Dec-10 01-Dec-10 01-Dec-12 Nil (2)<br />
(1) 50% of the rights and 50% of the options vest subject to achievement of the Perennial Group’s three year FUM forecast and 50% based on the achievement of a<br />
compounding Group cash earnings per share in excess of 10% each year over the performance period.<br />
(2) Prior to the acquisition of AWM, the performance hurdles for vesting of the performance rights was on the Group’s achievement of pre-determined TSR (60%), cash<br />
EPS (20%) and return on equity (20%). As a consequence of the acquisition, in accordance with the terms of the Share Plan, the Remuneration Committee exercised<br />
its discretion to waive the performance hurdles in respect of unvested performance rights as it is now impractical to measure performance against the hurdles on the<br />
basis established prior to the acquisition. As a result, the remaining performance hurdle is ongoing service only.<br />
page 98
IOOF | <strong>annual</strong> <strong>report</strong> <strong>2011</strong><br />
Weighted<br />
average<br />
exercise price<br />
Options Performance<br />
rights<br />
Number of<br />
options<br />
Number<br />
of rights<br />
Deferred<br />
shares<br />
Number of<br />
shares<br />
Total<br />
Number of<br />
options, rights<br />
& shares<br />
$ No. No. No. No.<br />
Opening balance at 1 July 2010 $6.98 4,704,271 588,918 48,238 5,341,427<br />
Forfeited or lapsed during the period $8.04 (674,103) (27,416) - (701,519)<br />
Exercised during the period $5.56 (1,700,899) (105,288) - (1,806,187)<br />
Granted during the period $6.31 2,450,000 160,000 31,694 2,641,694<br />
Outstanding at 30 June <strong>2011</strong> $7.00 4,779,269 616,214 79,932 5,475,415<br />
Exercisable at 30 June <strong>2011</strong> $8.94 1,362,645 105,317 24,119 1,467,962<br />
page 99
IOOF | <strong>annual</strong> <strong>report</strong> <strong>2011</strong><br />
Notes to the financial statements (cont’d)<br />
For the year ended 30 June <strong>2011</strong><br />
Disclosure of share-based payment programmes<br />
Series - Recipient<br />
Exercise<br />
price<br />
Opening<br />
balance as<br />
at 1 July 2010<br />
Granted<br />
Forfeited<br />
or Lapsed<br />
Exercised<br />
Closing balance<br />
as at 30 June<br />
<strong>2011</strong><br />
2008-4 Options - Senior Management 3.15 80,000 - - (80,000) - -<br />
2008-5 Options - Senior Management 3.15 100,000 - - (100,000) - -<br />
2009-21 Options - Senior Management 3.15 100,000 - - (100,000) - -<br />
2008-8 Options - Senior Management 3.15 150,000 - (75,000) - 75,000 56,250<br />
2009-1 Options - Executives 2.98 160,857 - - (107,238) 53,619 53,619<br />
2009-2 Options - Executives 3.73 26,809 - - - 26,809 26,809<br />
2009-4 Options - Executives 5.52 214,476 - - (80,428) 134,048 134,048<br />
2009-5 Options - Executives 9.17 254,690 - (254,690) - - -<br />
2009-6 Options - Senior Staff 9.69 81,749 - (81,749) - - -<br />
2009-7 Options - Executives 9.36 254,690 - (107,238) - 147,452 147,452<br />
2009-8 Options - Senior Staff 9.36 218,477 - (26,807) - 191,670 191,670<br />
2009-9 Options - Managing Director 9.99 134,047 - - - 134,047 134,047<br />
2009-11 Options - Senior Staff 6.34 1,286,852 - (53,619) (1,233,233) - -<br />
2009-15 Options - Former CEO 9.89 675,000 - - - 675,000 675,000<br />
2009-16 Options - Managing Director 5.20 316,624 - - - 316,624 -<br />
2009-20 Options - Senior Management 5.68 150,000 - - - 150,000 37,500<br />
2010-02 Options - Senior Management 7.40 - 150,000 - - 150,000 18,750<br />
2010-03 Options - Executives 7.01 500,000 - - - 500,000 -<br />
2010-04 Options - Executives 6.14 - 2,000,000 (75,000) - 1,925,000 -<br />
2010-05 Options - Managing Director 6.93 - 300,000 - - 300,000 -<br />
Vested<br />
4,704,271 2,450,000 (674,103) (1,700,899) 4,779,269 1,475,145<br />
2007-1 Rights - Senior Management $nil 20,181 - - (20,181) - -<br />
2007-2 Rights - Senior Management $nil 13,460 - - (13,460) - -<br />
2007-4 Rights - Advisers $nil 46,180 - - (46,180) - -<br />
2007-5 Rights - Senior Management $nil 7,500 - (2,500) (1,250) 3,750 -<br />
2008-1 Rights - Senior Management $nil 41,614 - - - 41,614 -<br />
2008-2 Rights - Senior Management $nil 65,151 - (21,717) (21,717) 21,717 21,717<br />
2008-6 Rights - Advisers $nil 86,799 - (3,199) - 83,600 83,600<br />
2008-7 Rights - Senior Management $nil 8,750 - - (1,250) 7,500 -<br />
2009-14 Rights - Managing Director $nil 150,000 - - - 150,000 -<br />
2009-17 Rights - Senior Management $nil 32,970 - - - 32,970 -<br />
2009-18 Rights - Advisers $nil 116,313 - - - 116,313 -<br />
2010-01 Rights - Senior Management $nil - 10,000 - (1,250) 8,750 -<br />
2010-06 Rights - Managing Director $nil - 150,000 - - 150,000 -<br />
588,918 160,000 (27,416) (105,288) 616,214 105,317<br />
2010-07 Deferred - Managing Director $nil 48,238 - - - 48,238 24,119<br />
2012-03 Deferred - Managing Director $nil - 31,694 - - 31,694 -<br />
48,238 31,694 - - 79,932 24,119<br />
5,341,427 2,641,694 (701,519) (1,806,187) 5,475,415 1,604,581<br />
The options outstanding at 30 June <strong>2011</strong> have an exercise price in the range of $2.98 to $9.99 and a weighted average contractual life<br />
of 3.2 years.<br />
The weighted average share price at the date of exercise for share options exercised during the year ended 30 June <strong>2011</strong><br />
was $6.84 (2010: $6.59).<br />
page 100
IOOF | <strong>annual</strong> <strong>report</strong> <strong>2011</strong><br />
Inputs for measurement of grant date fair values granted during the financial year<br />
The grant date fair value of the options granted through the employee share option plans were measured based on Monte Carlo<br />
sampling, where an external market-based performance hurdle exists. The grant date fair value of all other share-based payment<br />
plans were measured based on a binomial options pricing model. Expected volatility is estimated by considering historic average<br />
share price volatility. The inputs used in the measurement of the fair values at grant date of the share-based payment plans are the<br />
following:<br />
Series<br />
Fair<br />
value<br />
Exercise<br />
price<br />
Grant date<br />
share price<br />
Expected<br />
volatility<br />
Expected<br />
life (years)<br />
Dividend<br />
yield<br />
Risk-free<br />
interest rate<br />
2010-02 Options - Senior Management 1.27 7.40 5.84 48% 3 6% 6%<br />
2010-04 Options - Executives 2.14 6.14 6.55 51% 5 5% 6%<br />
2010-05 Options (1) - Managing Director 2.25 6.93 7.27 50% 3 5% 6%<br />
2010-05 Options (2) - Managing Director 2.45 6.93 7.27 50% 4 5% 6%<br />
2010-05 Options (3) - Managing Director 2.58 6.93 7.27 50% 5 5% 6%<br />
2010-01 Rights - Senior Management 5.84 nil 5.84 50% 3 5% 6%<br />
2010-06 Rights (1) - Managing Director 3.63 nil 7.27 50% 3 5% 6%<br />
2010-06 Rights (2) - Managing Director 3.47 nil 7.27 50% 4 5% 6%<br />
2010-06 Rights (3) - Managing Director 3.30 nil 7.27 50% 5 5% 6%<br />
32 Remuneration of auditors<br />
Auditors’ remuneration paid or payable by members of the IOOF Holdings Ltd Group to the auditors of the corporate entities in<br />
relation to audit services of the corporate entities and products operated by the Group during the year and for the comparative prior<br />
period:<br />
Audit services<br />
Auditors of the Company<br />
Consolidated Parent<br />
<strong>2011</strong> 2010 <strong>2011</strong> 2010<br />
$ $ $ $<br />
KPMG Australia<br />
Audit and review of financial <strong>report</strong>s 1,978,315 1,808,510 304,000 225,522<br />
Other regulatory audit services 535,700 529,990 - -<br />
2,514,015 2,338,500 304,000 225,522<br />
Other auditors - 441,800 - -<br />
2,514,015 2,780,300 304,000 225,522<br />
Other services<br />
Auditors of the Company<br />
KPMG Australia<br />
Taxation services 332,880 446,680 - -<br />
Other services 87,292 51,772 - -<br />
420,172 498,452 - -<br />
Other auditors - 911,080 - -<br />
420,172 1,409,532 - -<br />
All amounts payable to the Auditors of the Company were paid by a Group subsidiary.<br />
page 101
IOOF | <strong>annual</strong> <strong>report</strong> <strong>2011</strong><br />
Notes to the financial statements (cont’d)<br />
For the year ended 30 June <strong>2011</strong><br />
33 Key management personnel<br />
The key management personnel compensation comprised:<br />
Consolidated Parent<br />
<strong>2011</strong> 2010 <strong>2011</strong> 2010<br />
$ $ $ $<br />
Short-term employee benefits 8,281,722 6,287,034 - -<br />
Post-employment benefits 226,525 183,959 - -<br />
Other long term benefits 64,593 - - -<br />
Share-based payments 1,867,224 707,330 - -<br />
Individual directors and executives compensation disclosures<br />
10,440,065 7,178,323 - -<br />
Information regarding individual directors and executives compensation and some equity instruments disclosures as required by<br />
Corporations Regulation 2M.3.03 is provided in the remuneration <strong>report</strong> section of the directors’ <strong>report</strong>.<br />
Information regarding individual directors and executives compensation and some equity instruments disclosures as required by<br />
Corporations Regulation 2M.3.03 is provided in the remuneration <strong>report</strong> section of the directors’ <strong>report</strong>.<br />
Apart from the details disclosed in this note, no director has entered into a material contract with the Group since the end of the<br />
previous financial year and there were no material contracts involving directors’ interests existing at year-end.<br />
34 Related party transactions<br />
(a) Transactions with key management<br />
personnel<br />
i. Key management personnel compensation<br />
Details of key management personnel compensation are<br />
disclosed in Note 33 to the financial statements and in the<br />
Remuneration Report.<br />
ii.<br />
Loans to key management personnel<br />
There are no loans between the Group and key management<br />
personnel.<br />
iii.<br />
Key management personnel equity holdings<br />
Fully paid ordinary shares of IOOF Holdings Ltd<br />
Ordinary shares Balance at 1 July Received on<br />
exercise of options<br />
Acquired via salary Net other change Balance at<br />
sacrifice (2) 30 June (1)<br />
No. No. No. No. No.<br />
Directors<br />
I Blair <strong>2011</strong> 30,477 - 4,259 - 34,736<br />
2010 25,215 - 5,262 - 30,477<br />
I Griffiths <strong>2011</strong> 4,280,280 - - - 4,280,280<br />
2010 4,626,695 - - (346,415) 4,280,280<br />
J Harvey <strong>2011</strong> 8,722 - 1,703 - 10,425<br />
2010 6,385 - 2,337 - 8,722<br />
C Kelaher <strong>2011</strong> 4,244,818 - - - 4,244,818<br />
2010 4,916,415 334,584 - (1,006,181) 4,244,818<br />
J Pfeiffer <strong>2011</strong> 26,855 - 5,941 - 32,796<br />
2010 19,483 - 7,372 - 26,855<br />
R Sexton <strong>2011</strong> 38,548 - 3,169 - 41,717<br />
2010 24,839 - 3,709 10,000 38,548<br />
G Venardos <strong>2011</strong> 20,013 - - - 20,013<br />
2010 15,013 - - 5,000 20,013<br />
(1) The equity holdings for the above individuals is inclusive of both direct and indirect shareholdings. Refer to the Remuneration Report for further information<br />
regarding individuals shareholdings.<br />
(2) Represent directors’ fees sacrificed into the Non-Executive Director Deferred Share Purchase Plan.<br />
page 102
IOOF | <strong>annual</strong> <strong>report</strong> <strong>2011</strong><br />
Ordinary shares<br />
Balance at<br />
1 July<br />
Received on exercise<br />
of options<br />
Received on vesting of<br />
performance rights<br />
Net other<br />
change<br />
Balance at<br />
30 June (1)<br />
No. No. No. No. No.<br />
Other Key Management Personnel of the Group<br />
S Abley <strong>2011</strong> 16,244 - - - 16,244<br />
2010 9,835 - 6,409 - 16,244<br />
M Carter <strong>2011</strong> 26,938 134,048 - (134,048) 26,938<br />
2010 26,938 - - - 26,938<br />
D Coulter <strong>2011</strong> 238 - - - 238<br />
2010 238 - - - 238<br />
S Merlicek <strong>2011</strong> - - - - -<br />
2010 - - - - -<br />
R Mota <strong>2011</strong> 19,794 - 14,657 2,325 36,776<br />
2010 9,944 - 9,850 - 19,794<br />
G Riordan <strong>2011</strong> - 53,619 - (53,619) -<br />
2010 - - - - -<br />
(1) The equity holdings for the above individuals is inclusive of both direct and indirect shareholdings. Refer to the Remuneration Report for further information<br />
regarding individuals shareholdings.<br />
iv.<br />
Other transactions with key management personnel of the Group<br />
There were no other transactions with key management personnel of the Group during the <strong>2011</strong> and 2010 financial years.<br />
(b) Transactions with other related parties<br />
Other related parties of the Group include associates listed in Note 16 and directors of any subsidiaries and associates not included as<br />
KMP of the Group.<br />
Consolidated<br />
<strong>2011</strong> 2010<br />
$ $<br />
Receipt of service charge revenue from associates 2,302,000 2,277,000<br />
Receipt of interest revenue from:<br />
Directors and executives of subsidiaries 151,995 60,835<br />
Other related parties 379,377 414,217<br />
531,372 475,052<br />
Payment of management fees to associates 13,922,647 12,163,353<br />
page 103
IOOF | <strong>annual</strong> <strong>report</strong> <strong>2011</strong><br />
Notes to the financial statements (cont’d)<br />
For the year ended 30 June <strong>2011</strong><br />
(c) Loans to directors of subsidiaries and associates<br />
Consolidated<br />
<strong>2011</strong> 2010<br />
$ $<br />
The aggregate value of loans to Directors of Group subsidiaries as at balance date amounted to:<br />
Directors of controlled and associated entities from the Group (i) 7,681,452 7,422,702<br />
Interest revenue of the Group on loans to :<br />
Directors of controlled and associated entities from the Group 406,052 385,092<br />
Interest repaid on loans from the Group during the year:<br />
Directors of controlled and associated entities from the Group 440,952 359,516<br />
Interest receivable balance on loans to Directors from the Group as at balance date:<br />
Directors of controlled entities as at balance date 108,450 143,968<br />
(i) The Director of an associate entity who received the loans referred to above was Mr J Murray. The amounts were advanced by Perennial Investment Partners Ltd for<br />
the specific purpose of assisting him to acquire an equity interest in another related party, Perennial Value Management Ltd. The parties to the loans are permitted to<br />
discharge the loans by transferring the shares to the lender. Secured interest bearing loans totalling $4,246,831 were made on commercial terms and conditions and<br />
unsecured loans to the value of $790,180 (2010: $790,180) are interest free.<br />
The loans referred to above relate to amounts advanced to the Directors of controlled entities, Mr A Patterson, Mr A Mulcahy, Mr L<br />
Mickelburough and Mr R Macdougall. The amounts were advanced by Perennial Investment Partners Ltd to Directors for the specific<br />
purpose of assisting them to acquire an equity interest in subsidiaries of IOOF or in the case of Mr A Patterson another related party,<br />
Perennial Value Management Ltd. The secured interest bearing loans totalling $1,718,790 were made on commercial terms and<br />
conditions and unsecured loans to the value of $925,650 (2010: $925,650) are interest free.<br />
(d) Loans to executives of the Group<br />
Consolidated<br />
<strong>2011</strong> 2010<br />
$ $<br />
The aggregate value of loans to Executives of the Group made by the Group as at balance date amounted to (i) 2,445,171 1,987,228<br />
Interest revenue of the Group on loans to executives 125,320 89,960<br />
Loans made to executives of the Group during the year by the Group 787,193 117,000<br />
Interest repaid during the year 121,217 68,085<br />
Interest written off during the year - -<br />
Interest receivable balance as at balance date 45,898 41,795<br />
Loans repaid during the year 329,250 9,921<br />
(i) The Executives referred to above were Mr P Durham, Mr S Bruce, Mr G Oshry, Mr D Cottier, Mr N Sladen, Mr A Sutherland and Mr B James. The amounts were advanced<br />
by Perennial Investment Partners Ltd for the specific purpose of assisting them to acquire an equity interest in subsidiaries of the Company or in the case of Mr P<br />
Durham, Mr S Bruce, D Cottier and Mr G Oshry another related party, Perennial Value Management Ltd. Unsecured interest bearing loans totalling $803,893 and<br />
secured interest bearing loans totalling $1,524,278 were made on commercial terms and conditions with the exception of loans advanced to Mr P Durham and Mr S<br />
Bruce for the amounts of $331,536 and $239,351 respectively that are interest free loans.<br />
(e) Ultimate parent entity<br />
IOOF Holdings Ltd is the ultimate parent entity in the Group.<br />
page 104
IOOF | <strong>annual</strong> <strong>report</strong> <strong>2011</strong><br />
35 Operating leases<br />
Commitments for minimum lease payments in relation to non-cancellable operating leases are payable as follows:<br />
Consolidated Parent<br />
<strong>2011</strong> 2010 <strong>2011</strong> 2010<br />
$’000 $’000 $’000 $’000<br />
Not later than one year 9,820 11,633 - -<br />
Later than one year, not later than five years 35,417 36,847 - -<br />
Later than five years 12,042 9,290 - -<br />
57,279 57,770 - -<br />
The Group leases a number of offices premises under non-cancellable operating leases expiring between one month to ten years. The<br />
leases have varying terms, escalation clauses and renewal rights. On renewal, the terms of the leases are renegotiated.<br />
The Group also lease various office equipment under non-cancellable operating leases expiring between 1 month to 3 years. The<br />
terms of some of these lease provided the Group with the option to purchase this equipment at the conclusion of these lease<br />
agreements.<br />
36 Capital commitments<br />
On 27 June <strong>2011</strong>, the Company announced that the Company and Deakin Financial Group (DKN) had entered into an agreement<br />
under which the Company, through a wholly owned subsidiary, proposes to acquire DKN via a scheme of arrangement. The<br />
arrangement to acquire 100% of shares not already owned by the Group for $0.80 cash is subject to shareholder approval and as a<br />
result, no amounts have been recognised in the profit or loss or financial position of the Group at balance date. If accepted, the total<br />
consideration payable to shareholders is estimated at $94 million.<br />
The Group has not entered into any non-cancellable capital expenditure commitments not already recognised or provided for.<br />
37 Contingencies<br />
Consolidated Parent<br />
<strong>2011</strong> 2010 <strong>2011</strong> 2010<br />
$’000 $’000 $’000 $’000<br />
Contingent liabilities<br />
Rental bond guarantees 4,596 4,744 - -<br />
ASX settlement bond guarantee 500 500 - -<br />
ASIC bond guarantees 60 100 - -<br />
5,156 5,344 - -<br />
page 105
IOOF | <strong>annual</strong> <strong>report</strong> <strong>2011</strong><br />
Notes to the financial statements (cont’d)<br />
For the year ended 30 June <strong>2011</strong><br />
Other contingent liabilities<br />
Estate and trustee operations<br />
Australian Executor Trustees Ltd, a subsidiary of IOOF Holdings<br />
Ltd, is currently defending claims brought against it in its<br />
capacity as trustee of estates and superannuation funds. In<br />
aggregate these total approximately $2,507,000. Professional<br />
indemnity insurance cover is held to meet any professional<br />
liabilities that may arise for individual claims above the<br />
applicable excess, the Group would be potentially liable for<br />
less than $488,000 of these claims.<br />
Financial advice division<br />
Bridges Financial Services Pty Ltd, a subsidiary of IOOF<br />
Holdings Ltd, is currently defending complaints made against<br />
the company in its capacity as Australian Financial Services<br />
Licensee. In aggregate these total approximately $696,000.<br />
Professional indemnity insurance cover is held to meet any<br />
professional liabilities that may arise for individual claims above<br />
the applicable excess, the Group would be potentially liable for<br />
less than $401,000 of these claims.<br />
Wealth Managers Pty Ltd, a subsidiary of IOOF Holdings Ltd,<br />
is currently defending complaints made against the company<br />
in its capacity as Australian Financial Services Licensee. In<br />
aggregate these total approximately $4,496,000. Professional<br />
indemnity insurance cover is held to meet any professional<br />
liabilities that may arise for individual claims above the<br />
applicable excess, the Group would be potentially liable for<br />
less than $100,000 of these claims.<br />
Consultum Financial Advisers Pty Ltd, a subsidiary of IOOF<br />
Holdings Ltd, is currently defending complaints made against<br />
the company in its capacity as Australian Financial Services<br />
Licensee. In aggregate these total approximately $2,467,000.<br />
Professional indemnity insurance cover is held to meet any<br />
professional liabilities that may arise for individual claims above<br />
the applicable excess, the Group would be potentially liable for<br />
less than $295,000 of these claims.<br />
Buyer of last resort facility<br />
Bridges Financial Services Pty Ltd<br />
Bridges Financial Services Pty Ltd (Bridges), a subsidiary of IOOF<br />
Holdings Ltd, has a contractual agreement with its planners<br />
to provide a put option “Buyer of Last Resort Facility” should<br />
a planner wish to sell their business and on the satisfaction of<br />
certain specific requirements.<br />
The terms and conditions provide that where the specific<br />
requirements have been met, the purchase price payable for<br />
the business is a market price mutually agreed with Bridges.<br />
Where agreement with Bridges is not reached, the market<br />
price is to be determined by an independent price expert.<br />
As at 30 June <strong>2011</strong>, Bridges had received one request from a<br />
planner which satisfied requirements to exercise its obligation.<br />
Bridges is now seeking valuation from an independent price<br />
expert. The resale value of such a business purchased may<br />
differ from the cost to Bridges.<br />
Consultum Financial Advisers Pty Ltd<br />
Consultum Financial Advisers Pty Ltd, a subsidiary of IOOF<br />
Holdings Ltd, and IOOF Holdings Ltd independently have<br />
contractual agreements with its planners to provide a put<br />
option “Buyer of Last Resort Facility” should a planner wish to<br />
sell their business and on the satisfaction of certain specific<br />
requirements. The terms and conditions provide that where<br />
the specific requirements have been met, a predetermined<br />
purchase price will be payable for the business as agreed by all<br />
parties over a predetermined period. Where certain terms and<br />
conditions have not been met, the predetermined purchase<br />
price will be discounted accordingly. As at 30 June <strong>2011</strong>,<br />
Consultum Financial Advisers Pty Ltd has not received any<br />
requests from planners that satisfy the specific requirements to<br />
exercise its obligation.<br />
Other<br />
Other contingent liabilities exist in relation to claims and/or<br />
possible claims which, at the date of signing these accounts,<br />
have not been resolved. An assessment of the likely loss to the<br />
Company and its controlled entities has been made in respect<br />
of the identified claims, on a claim by claim basis, and specific<br />
provision has been made where appropriate. The Group does<br />
not consider that the outcome of any current proceedings,<br />
either individually or in aggregate, is likely to materially affect<br />
its operations or financial position.<br />
page 106
IOOF | <strong>annual</strong> <strong>report</strong> <strong>2011</strong><br />
38 Reconciliation of cash flows from operating activities<br />
(a) Cash and cash equivalents<br />
Consolidated Parent<br />
<strong>2011</strong> 2010 <strong>2011</strong> 2010<br />
$’000 $’000 $’000 $’000<br />
Bank balances 152,999 132,780 45,959 617<br />
(b) Reconciliation of cash flows from operating activities<br />
Consolidated Parent<br />
<strong>2011</strong> 2010 <strong>2011</strong> 2010<br />
$’000 $’000 $’000 $’000<br />
Profit for the period 100,779 80,785 131,328 66,747<br />
Net profit contribution of insurance business 11 (171) - -<br />
Net depreciation/impairment on property and<br />
3,733 4,940 - -<br />
equipment<br />
Net amortisation of intangible assets 17,980 17,905 - -<br />
(Profit)/loss on disposal of assets (492) (1,217) - (1,001)<br />
Bad and doubtful debts - 74 - -<br />
Interest received and receivable (8,836) (5,671) (2,502) (1,937)<br />
Dividends received and receivable (1,960) (1,772) (129,911) (64,218)<br />
Dividends received from associates 9,378 6,353 - -<br />
Share of profits of associates accounted for using the<br />
(9,201) (7,588) - -<br />
equity method<br />
Share-based payments expense 3,232 2,027 - -<br />
Income tax benefit on disposal of treasury shares<br />
recognised directly in equity<br />
- (1,061) - -<br />
Changes in net operating assets and liabilities:<br />
(Increase)/decrease in receivables (5,175) 37,861 - 152<br />
(Increase)/decrease in other assets (1,927) 2,515 - 11<br />
(Increase)/decrease in current tax assets - - - 1,273<br />
(Increase)/decrease in other financial assets 44 810 - -<br />
(Increase)/decrease in deferred acquisition costs 4,775 - - -<br />
Increase/(decrease) in payables 2,265 (64,133) 68 (683)<br />
Increase/(decrease) in deferred revenue liabilities (4,084) - - -<br />
Increase/(decrease) in provisions (5,131) (4,315) 175 (1,542)<br />
Increase/(decrease) in income tax payable 9,015 25,054 (26,790) (12,005)<br />
Increase/(decrease) in other financial liabilities (5,474) (2,326) - -<br />
Increase/(decrease) in other liabilities 403 (1,843) - -<br />
Increase/(decrease) in deferred taxes 12,862 4,454 13,890 8,320<br />
Net cash provided by/(used in) operating activities 122,197 92,681 (13,742) (4,883)<br />
page 107
IOOF | <strong>annual</strong> <strong>report</strong> <strong>2011</strong><br />
Notes to the financial statements (cont’d)<br />
For the year ended 30 June <strong>2011</strong><br />
39 Group entities<br />
Parent entity<br />
Country of<br />
incorporation<br />
IOOF Holdings Ltd Australia<br />
Ownership interest<br />
Note <strong>2011</strong> 2010<br />
Subsidiaries<br />
Accountplan Pty Ltd Australia 100.0 100.0<br />
Accountplan Taxation Services Pty Ltd Australia 49.0 49.0<br />
ACN 073 215 684 Pty Ltd (formerly SMF Pty Ltd) (b) Australia 100.0 100.0<br />
AET SPV Management Pty Ltd Australia 100.0 100.0<br />
AET Structured Finance Services Pty Ltd Australia 100.0 100.0<br />
AET Super Solutions Pty Ltd Australia 100.0 100.0<br />
Australian Executor Trustees (NSW) Ltd Australia 100.0 100.0<br />
Australian Executor Trustees (Canberra) Ltd Australia 100.0 100.0<br />
Australian Executor Trustees (SA) Ltd Australia 100.0 100.0<br />
Australian Executor Trustees Ltd Australia 100.0 100.0<br />
Australian Wealth Management Ltd Australia 100.0 100.0<br />
Australian Wealth Management Service Co. Pty Ltd Australia 100.0 100.0<br />
Austselect Pty Ltd Australia 100.0 100.0<br />
B D Shepparton Pty Ltd Australia 75.0 75.0<br />
Bagot’s Executor & Trustee Company Ltd Australia 100.0 100.0<br />
Bagot’s Nominees Pty Ltd (b) Australia 100.0 100.0<br />
Bridges Financial Services Group Pty Ltd Australia 100.0 100.0<br />
Bridges Financial Services Pty Ltd Australia 100.0 100.0<br />
Bridges Nominee Pty Ltd Australia 100.0 100.0<br />
Cigar Nominee Pty Ltd Australia 100.0 100.0<br />
CK Brisbane Pty Ltd Australia 100.0 100.0<br />
Consultum Financial Advisers Pty Ltd Australia 100.0 100.0<br />
CU Financial Advisory Services Pty Ltd (b) Australia 100.0 100.0<br />
DD Charlestown Pty Ltd Australia 100.0 100.0<br />
Executive Wealth Management Financial Services Pty Ltd Australia 100.0 100.0<br />
Executive Wealth Management Pty Ltd Australia 100.0 100.0<br />
Executor Trustee Australia Ltd Australia 100.0 100.0<br />
Financial Lifestyle Partners (Doncaster) Pty Ltd Australia 65.0 65.0<br />
Financial Partnership Pty Ltd Australia 100.0 100.0<br />
Finium Trustees Pty Ltd (b) Australia 100.0 100.0<br />
Group Investments Nominee Pty Ltd Australia 100.0 100.0<br />
Holiday Coast Wealth Management Pty Ltd Australia 100.0 100.0<br />
IOOF Global One Ltd Australia 100.0 100.0<br />
IOOF Investment Holdings Pty Ltd Australia 100.0 100.0<br />
IOOF Investment Management Ltd Australia 100.0 100.0<br />
IOOF Life Pty Ltd Australia 100.0 100.0<br />
IOOF Ltd Australia 100.0 100.0<br />
IOOF Services Pty Ltd Australia 100.0 100.0<br />
IOOF Transition 2 Pty Ltd Australia 100.0 100.0<br />
IOOF Transition 3 Pty Ltd Australia 100.0 100.0<br />
page 108
IOOF | <strong>annual</strong> <strong>report</strong> <strong>2011</strong><br />
Country of<br />
incorporation<br />
Ownership interest<br />
Note <strong>2011</strong> 2010<br />
JK Rye Pty Ltd Australia 100.0 100.0<br />
KE Sunshine Coast Pty Ltd Australia 100.0 100.0<br />
NS Singleton Pty Ltd Australia 100.0 100.0<br />
NT Homebush Pty Ltd Australia 70.0 70.0<br />
Perennial Investment Partners (U.S.) Inc USA 100.0 100.0<br />
Perennial Fixed Interest Partners Pty Ltd (a) Australia 74.7 74.7<br />
Perennial Growth Management Pty Ltd Australia 60.0 60.0<br />
Perennial International Equities Management Pty Ltd Australia 100.0 100.0<br />
Perennial Investment Partners Asia Ltd Australia 94.9 94.9<br />
Perennial Investment Partners Ltd Australia 100.0 100.0<br />
Perennial Real Estate Investments Pty Ltd Australia 50.0 50.0<br />
Questor Financial Services Ltd Australia 100.0 100.0<br />
Security Management Services Pty Ltd Australia 100.0 100.0<br />
Select Managed Funds Ltd Australia 100.0 100.0<br />
SEM Group Administration Pty Ltd (b) Australia 100.0 100.0<br />
Sentinel Adviser Services Pty Ltd Australia 100.0 100.0<br />
SMF Pty Ltd (formerly JV1 Pty Ltd) Australia 100.0 100.0<br />
SMF Funds Management Ltd Australia 100.0 100.0<br />
SMF Investment Managers (Super & Pension Fund) Pty Ltd (b) Australia 100.0 100.0<br />
SMF SuperOptions Pty Ltd (b) Australia 100.0 100.0<br />
SMF Wealth Management Pty Ltd Australia 100.0 100.0<br />
Spectrum Managed Funds Pty Ltd (b) Australia 100.0 100.0<br />
Strategy Plus Financial Planning Pty Ltd Australia 100.0 100.0<br />
Super Choice Pty Ltd (b) Australia 100.0 100.0<br />
Tower Austrust Building Pty Ltd Australia 100.0 100.0<br />
United Funds Management Ltd Australia 100.0 100.0<br />
Wealth Managers Pty Ltd Australia 100.0 100.0<br />
Ord Minnett Holdings Pty Ltd Australia 70.0 70.0<br />
Ord Minnett Ltd Australia 70.0 70.0<br />
Ord Minnett Financial Planning Pty Ltd Australia 70.0 70.0<br />
Ord Minnett Management Ltd Australia 70.0 70.0<br />
A.C.N. 003 331 726 Pty Ltd (formerly Dicksons Ltd) Australia 70.0 70.0<br />
Contango Nominees Pty Ltd Australia 70.0 70.0<br />
Beaglemoat Nominees Pty Ltd Australia 70.0 70.0<br />
Minnett Nominees Pty Ltd Australia 70.0 70.0<br />
Caltowie Investments Pty Ltd Australia 70.0 70.0<br />
Ord Minnett Prime Nominees Pty Ltd Australia 70.0 70.0<br />
AETOML Nominees Pty Ltd Australia 70.0 70.0<br />
OMPL Pty Ltd Australia 70.0 70.0<br />
OMPYF Nominees Pty Ltd Australia 70.0 70.0<br />
IOOF Executive Performance Share Plan Trust Australia 100.0 100.0<br />
(a) The investment in Perennial Fixed Interest Partners Pty Ltd is through Perennial Investment Partners Ltd which directly holds a 70.2% (2010: 70.2%) shareholding in this<br />
entity and through IOOF Holdings Ltd which directly holds a 4.5% (2010: 4.5%) shareholding in this entity.<br />
(b) The Group is currently in the process of deregistration of this dormant subsidiary in accordance with a corporate simplification project.<br />
page 109
IOOF | <strong>annual</strong> <strong>report</strong> <strong>2011</strong><br />
Notes to the financial statements (cont’d)<br />
For the year ended 30 June <strong>2011</strong><br />
40 Life Insurance Business<br />
A subsidiary of the Company, IOOF Ltd, is a friendly society in accordance with the Life Insurance Act 1995.<br />
(a) Assets relating to insurance business<br />
Statutory<br />
<strong>2011</strong> 2010<br />
$’000 $’000<br />
Cash at bank 6,269 12,902<br />
Receivables 13,836 19,633<br />
Certificates of deposit and bank bills 46,672 173,196<br />
Debt securities 180,084 171,148<br />
Shares in listed companies 18,815 3,246<br />
Unlisted unit trusts 680,841 615,888<br />
Derivatives 35 1,278<br />
Loans to policyholders 9,530 9,994<br />
Mortgages 117 268<br />
Margin accounts 1,771 1,287<br />
Deferred tax assets 10,047 14,636<br />
Investments backing policyholder liabilities designated at fair value through profit or loss 968,017 1,023,476<br />
Investments held in the life insurance Statutory Funds (including the Benefit Funds) are subject to the distribution and transfer<br />
restrictions and other requirements of the Life Insurance Act 1995. Monies held in the benefit funds and controlled trusts are held for<br />
the benefit of the members of those funds, and are subject to the constitution and rules of those funds.<br />
Accordingly, with the exception of permitted profit distributions, the investments held in the statutory funds are not available for use<br />
by other parties of the Group.<br />
(b) Policy liabilities<br />
Policy liabilities have been determined in accordance with applicable accounting standards. Policy liabilities for life insurance contracts<br />
are valued in accordance with AASB 1038, whereas life investment contracts are valued in accordance with AASB 139 and AASB 118.<br />
There are differences between the valuation requirements of the accounting standards and those of the Life Insurance Act 1995.<br />
Statutory<br />
<strong>2011</strong> 2010<br />
$’000 $’000<br />
Payables 19,476 15,963<br />
Contract policy liabilities - investment contracts with DPF 427,323 447,048<br />
Policy liabilities ceded under reinsurance - 322<br />
Investment contract liabilities 411,737 403,100<br />
Non-controlling interests in controlled trusts 109,481 156,297<br />
968,017 1,022,730<br />
(c) Reconciliation of movements in policy liabilities<br />
Statutory<br />
<strong>2011</strong> 2010<br />
$’000 $’000<br />
Contract policy liabilities<br />
Insurance contract liabilities at beginning of the year 447,048 466,199<br />
Net increase in life insurance contract policy liabilities 15,974 19,475<br />
Life insurance contract contributions 13,563 13,577<br />
Life insurance contract withdrawals (49,262) (52,203)<br />
Insurance contract liabilities at end of the year 427,323 447,048<br />
page 110
IOOF | <strong>annual</strong> <strong>report</strong> <strong>2011</strong><br />
(d) Contribution to profit or loss of life insurance business<br />
Statutory<br />
<strong>2011</strong> 2010<br />
$’000 $’000<br />
Revenue<br />
Interest income 1,009 818<br />
Dividends and distributions received 34,396 22,286<br />
Net fair value gains/(losses) on other financial assets at fair value through profit or loss 24,342 64,451<br />
Contributions received - investment contracts with DPF 13,563 13,577<br />
DPF policy holder liability increase 19,725 19,151<br />
Non - DPF policyholder liability decrease (13,021) (54,855)<br />
Other fee revenue 5,246 5,254<br />
85,260 70,682<br />
(e) Expenses<br />
Service and marketing fees expense 14,751 14,377<br />
Life insurance operating expenses 127 444<br />
Investment contracts with DPF:<br />
Benefits and withdrawals paid 49,017 51,979<br />
Termination bonuses 245 224<br />
Distribution to policyholders 7,146 6,258<br />
Interest 363 539<br />
71,649 73,821<br />
(f)<br />
Actuarial assumptions and methods<br />
The effective date of the actuarial <strong>report</strong> on the policy liabilities<br />
and solvency reserves is 30 June <strong>2011</strong>. The actuarial <strong>report</strong> for<br />
IOOF Ltd was prepared by Mr Kent Griffin, FIAA, and was dated<br />
23 August <strong>2011</strong>. The actuarial <strong>report</strong> indicates that Mr Griffin is<br />
satisfied as to the accuracy of the data upon which the policy<br />
liabilities have been determined.<br />
Actuarial Methods<br />
Policy liabilities have been calculated in accordance with<br />
relevant actuarial guidance issued by the Australian Prudential<br />
Regulatory Authority under the Life Insurance Act 1995. Policy<br />
liabilities are based on a systematic release of planned margins<br />
as services are provided to policyholders and premiums are<br />
received.<br />
Processes used to select assumptions<br />
Mortality and Morbidity<br />
All mortality and morbidity risk is fully reinsured and the<br />
gross risk to the Group is low. The mortality and morbidity<br />
assumptions have been taken to be equal to the reinsurer’s<br />
mortality and morbidity assumptions.<br />
Other Assumptions<br />
In adopting the accumulation method to assess the policy<br />
liabilities, one material assumption is required. It is assumed<br />
that the future overall experience as to expense levels,<br />
surrender/lapse rates and discount rates will likely remain<br />
within a satisfactory range so that the policies produce future<br />
profits for the business. In which case, there is no need to set<br />
aside provisions, in addition to the accumulation amounts, for<br />
future losses (i.e. there is no loss recognition concerns for the<br />
business). This assumption has been adopted on the basis that,<br />
based on the current actual experience of the business, the<br />
policies are producing satisfactory profits for the business and<br />
there are no circumstances known that would indicate that the<br />
current position (i.e. general experience levels and ongoing<br />
profitability) will not continue into the future.<br />
Sensitivity analysis<br />
The policy liabilities are not sensitive to changes in variables<br />
within a moderate range. Increases in mortality and morbidity<br />
assumptions will result in an increase gross policy liabilities<br />
for IOOF Ltd, however as the mortality and morbidity risk is<br />
fully reinsured any change in these assumptions would be<br />
consistent with the reinsurer’s assumptions and the net change<br />
in policy liabilities would be nil.<br />
page 111
IOOF | <strong>annual</strong> <strong>report</strong> <strong>2011</strong><br />
Notes to the financial statements (cont’d)<br />
For the year ended 30 June <strong>2011</strong><br />
Solvency requirements<br />
Solvency reserves are required to meet the prudential standards determined in accordance with Prudential Standard LPS 2.04<br />
“Solvency Standard” issued by the Australian Prudential Regulatory Authority under Section 65 of the Life Insurance Act 1995. Solvency<br />
reserves provide additional protection to policy holders against the impact of fluctuations and unexpected adverse circumstances on<br />
the Company.<br />
(g) Disclosures on asset restrictions, managed assets and trustee activities<br />
(i)<br />
Restrictions on assets<br />
Investments held in life statutory funds can only be used in accordance with the relevant regulatory restrictions imposed under the<br />
Life Act and associated rules and regulations. The main restrictions are that the assets in a life statutory fund can only be used to meet<br />
the liabilities and expenses of that life statutory fund, to acquire investments to further the business of the life statutory fund or as<br />
distributions when solvency, capital adequacy and other regulatory requirements are met.<br />
(ii)<br />
Managed Funds and other fiduciary duties<br />
Entities in the IOOF Holdings Ltd Group, including the IOOF Ltd Benefit Funds, hold controlling investments in managed funds. A<br />
subsidiary of the company is the Responsible Entity for these managed funds and has a fiduciary responsibility for managing these<br />
trusts. Arrangements are in place to ensure that such activities are managed separately from the other activities of the IOOF Holdings<br />
Ltd Group.<br />
(h) Solvency requirements<br />
Solvency reserves are required to meet the prudential standards determined in accordance with Prudential Standard LPS 2.04<br />
“Solvency Standard” issued by the Australian Prudential Regulatory Authority under Section 65 of the Life Insurance Act 1995. Solvency<br />
reserves provide additional protection to policy holders against the impact of fluctuations and unexpected adverse circumstances on<br />
the Company.<br />
The figures in the table below represent the number of times coverage of the aggregate of all benefit funds and statutory funds in the<br />
Life Group over the solvency reserve.<br />
<strong>2011</strong> 2010<br />
$’000 $’000<br />
Solvency requirement A 851,622 857,861<br />
Represented by:<br />
Minimum Termination Value (1) 837,194 848,130<br />
Other Liabilities 12,338 7,692<br />
Solvency Reserve B 2,090 2,039<br />
851,622 857,861<br />
Assets Available for Solvency C 9,023 10,237<br />
Comprised of:<br />
Excess of Net Policy Liability over Minimum Termination Value 1,870 2,333<br />
Net Assets 7,153 7,904<br />
9,023 10,237<br />
Solvency Reserve % ( B / ( A - B )) x 100 0.25% 0.24%<br />
Coverage of Solvency Reserve C/ B 4.32 5.02<br />
For detailed solvency information on a statutory fund basis, users of this <strong>annual</strong> <strong>report</strong> should refer to the financial statements<br />
prepared by the life insurer.<br />
(1) The Minimum Termination Value is determined in accordance with the Solvency Standard and is the base figure upon which reserves against liability and asset risks<br />
are layered in determining the Solvency Requirement. The Minimum Termination Value represents the minimum obligation of the company to policy owners at the<br />
<strong>report</strong>ing date.<br />
page 112
IOOF | <strong>annual</strong> <strong>report</strong> <strong>2011</strong><br />
41 Subsequent events<br />
On 27 June <strong>2011</strong>, the Company announced that the Company<br />
and Deakin Financial Group (DKN) had entered into an<br />
agreement under which the Company, through a wholly<br />
owned subsidiary, proposes to acquire DKN via a scheme of<br />
arrangement. The arrangement to acquire 100% of shares<br />
not already owned by the Group for $0.80 cash is subject to<br />
DKN shareholder approval and as a result, no amounts have<br />
been recognised in the profit or loss or financial position of<br />
the Group at balance date. If accepted, the total consideration<br />
payable to shareholders is estimated at $94 million.<br />
The funds to be provided by the Company will be sourced<br />
from existing cash reserves and an undrawn facility<br />
arrangement with the Commonwealth Bank of Australia (CBA)<br />
(Loan Facility). The Company and the CBA have entered into a<br />
loan commitment letter and term sheet in relation to the Loan<br />
Facility. Under the Loan Facility, CBA has agreed to provide<br />
funding up to $75 million for the purpose of the Company<br />
satisfying the Group’s obligations under the Scheme (including<br />
the payment of the aggregate scheme consideration).<br />
The right of the Company to access funds under the Loan<br />
Facility is subject to certain conditions which will need to be<br />
satisfied or waived by CBA. The interest and establishment<br />
costs associated with the Loan Facility are on commercial<br />
terms.<br />
On 25 August <strong>2011</strong>, the Directors declared a final dividend<br />
of 22 cents (2010: 18.0 cents) per ordinary share fully franked<br />
at 30% tax rate in relation to the financial year ended 30 June<br />
<strong>2011</strong>. The dividend will be paid on 20 October <strong>2011</strong>. The total<br />
final dividend payment is estimated at $51,019,000.<br />
On 11 August <strong>2011</strong>, Perennial Investment Partners Ltd (a<br />
subsidiary of IOOF Holdings Ltd) received one notice from<br />
a non-controlling shareholder to exercise a buy-back of<br />
shares in Perennial Real Estate Investments Pty Ltd (PREI). The<br />
consideration for the share buy-back is not expected to exceed<br />
$3 million subject to an independent valuation of PREI.<br />
The Directors are not aware of any other event or circumstance<br />
since the end of the financial year not otherwise dealt with in<br />
this consolidated financial <strong>report</strong> that has or may significantly<br />
affect the operations of the consolidated entity, the results<br />
of those operations or the state of affairs of the consolidated<br />
entity in subsequent financial years.<br />
page 113
IOOF | <strong>annual</strong> <strong>report</strong> <strong>2011</strong><br />
Shareholder information<br />
Share capital<br />
IOOF has on issue 231,903,558 fully paid ordinary shares held by 56,521 holders as at 23 September <strong>2011</strong>. All ordinary shares of the<br />
company carry one vote per share.<br />
Twenty largest shareholders<br />
Rank Investor name Total units % of issued capital<br />
1 Trust Company Fiduciary Services Limited 27,412,867 11.82<br />
2 National Nominees Limited 23,046,896 9.94<br />
3 JP Morgan Nominees Australia Limited 21,425,549 9.24<br />
4 Sandhurst Trustees Limited 17,938,337 7.74<br />
5 HSBC Custody Nominees (Australia) Limited 17,278,335 7.45<br />
6 Citicorp Nominees Pty Limited 9,515,257 4.10<br />
7 UBS Wealth Management Australia Nominees Pty Ltd 7,805,873 3.37<br />
8 Cogent Nominees Pty Limited 7,434,413 3.21<br />
9 JP Morgan Nominees Australia Limited 4,526,038 1.95<br />
10 AMP Life Limited 3,473,087 1.50<br />
11 Cogent Nominees Pty Limited 2,007,661 0.87<br />
12 Queensland Investment Corp 1,641,341 0.71<br />
13 Mr Ian Gregory Griffiths 1,340,483 0.58<br />
14 Citicorp Nominees Pty Limited 1,152,104 0.50<br />
15 David Vautin Pty Ltd 961,248 0.41<br />
16 Custodial Services Limited 937,526 0.40<br />
17 Australian Reward Investment Alliance 829,670 0.36<br />
18 Warbont Nominees Pty Ltd 572,773 0.25<br />
19 Mr Neil Patrick Bigg 510,000 0.22<br />
20 Lujeta Pty Ltd 500,000 0.22<br />
20 Mr Michael Kenneth Harvey & Ms Susan Lea Harvey 500,000 0.22<br />
20 IOOF Holdings Trustee Pty Ltd IOOF Foundation 500,000 0.22<br />
TOTAL 151,309,458 65.25<br />
Distribution of equity securities<br />
a Analysis of number of shareholders by size of holding<br />
Range No. of holders No. of Units % Issued Capital<br />
1 – 1,000 40,718 13,021,110 72.04<br />
1001 – 5000 13,285 28,509,939 23.50<br />
5001 – 10,000 1,634 11,663,596 2.89<br />
10,001 – 100,000 817 18,229,147 1.45<br />
100,001 + 67 160,488,766 0.12<br />
TOTAL 56,521 231,903,558 100.00<br />
b There were 8,288 shareholders holding less than a marketable parcel ($500) based on a market price of $5.28 at the close of trading<br />
on 23 September <strong>2011</strong>.<br />
page 114
IOOF | <strong>annual</strong> <strong>report</strong> <strong>2011</strong><br />
Shareholder information (cont’d)<br />
Substantial shareholdings<br />
The following substantial shareholder notices have been lodged in accordance with section 671B of the Corporations Act 2001:<br />
Name Date of Notice No. of Ord. Shares % of Issued Capital<br />
Trust Company Fiduciary Services Ltd 12 May 2009 27,834,878 11.93<br />
Bendigo and Adelaide Bank Ltd 12 May 2009 17,938,337 7.8<br />
Share register and other enquiries<br />
If you have any questions in relation to your shareholding, share transfers or dividends, please contact our share registry:<br />
Link Market Services<br />
Locked Bag A14<br />
Sydney South NSW 1235<br />
Australian callers: 1300 554 474<br />
Telephone: +61 2 8280 7111<br />
Email:<br />
registrars@linkmarketservices.com.au<br />
Website: www.linkmarketservices.com.au<br />
Please include your shareholder reference number (SRN) or holder identification number (HIN) in all correspondence to the share registry.<br />
page 115
IOOF | <strong>annual</strong> <strong>report</strong> <strong>2011</strong><br />
Corporate directory<br />
(as at the date of this <strong>report</strong>)<br />
Directors<br />
Mr Ian Blair<br />
OAM, MMgt, FCA<br />
Chairman<br />
Mr Christopher Kelaher<br />
B.Ec, LL.B, F Fin<br />
Managing Director<br />
Dr Roger Sexton<br />
B.Ec. (Hons), M.Ec. Ph.D (Econ), FAICD, FAIM. FFin,<br />
C. P Mgr, C.Univ<br />
Mr Ian Griffiths<br />
C.Acc, DipAll, MIIA.<br />
Ms Jane Harvey<br />
B.Com, MBA, FCA, FAICD.<br />
Mr George Venardos<br />
BComm, FCA, FCIS, FAICD, FTIA<br />
Company Secretary<br />
Ms Danielle Corcoran<br />
Notice of Annual General Meeting<br />
The Annual General Meeting of IOOF Holdings Ltd will be held<br />
at the offices of:<br />
Ord Minnett Limited<br />
Level 23, 120 Collins Street<br />
Melbourne, Victoria, 3000<br />
Time 9.30am<br />
Date 23 November <strong>2011</strong><br />
A formal notice of meeting is available on our website and has<br />
been sent to shareholders<br />
Principal registered office in Australia<br />
Level 6, 161 Collins Street<br />
Melbourne, VIC 3000<br />
Share registry<br />
Link Market Services Limited<br />
Level 1, 333 Collins Street<br />
Melbourne, VIC 3000<br />
Telephone 1300 552 203 (Australia)<br />
612 8280 7111 (Outside Australia)<br />
Auditor<br />
KPMG<br />
147 Collins Street Melbourne, VIC 3000<br />
Solicitors<br />
Blake Dawson Waldron<br />
Level 26, 181 William Street<br />
Melbourne, VIC 3000<br />
Mallesons Stephen Jaques<br />
Bourke Place, 600 Bourke Street<br />
Melbourne, VIC 3000<br />
Freehills<br />
MLC Centre, 19 Martin Place<br />
Sydney, NSW 2000<br />
Bankers<br />
Commonwealth Bank Limited<br />
Tower 1, 201 Sussex Street<br />
Sydney, NSW 2000<br />
Securities exchange listing<br />
IOOF Holdings Ltd shares are listed on the Australian Securities<br />
Exchange (ASX: IFL)<br />
Website address<br />
www.ioof.com.au<br />
(03) 8614 4400<br />
page 116