annual report 2011
annual report 2011
annual report 2011

You also want an ePaper? Increase the reach of your titles
YUMPU automatically turns print PDFs into web optimized ePapers that Google loves.
IOOF | <strong>annual</strong> <strong>report</strong> <strong>2011</strong><br />
Remuneration <strong>report</strong> (cont’d)<br />
Remuneration components as a percentage of total remuneration<br />
Remuneration components (based on <strong>annual</strong>ised amounts)<br />
Name Fixed Total Incentive Compensation Award Total Remuneration<br />
<strong>2011</strong> 2010 <strong>2011</strong> 2010 <strong>2011</strong> 2010<br />
% % % % % %<br />
C Kelaher 46 53 54 47 100 100<br />
S Abley 61 79 39 21 100 100<br />
M Carter 51 76 49 24 100 100<br />
D Coulter 54 83 46 17 100 100<br />
S Merlicek 63 83 37 17 100 100<br />
R Mota 55 66 45 34 100 100<br />
A Patterson 58 87 42 13 100 100<br />
G Riordan 53 74 47 26 100 100<br />
K Morris 100 100 - - 100 100<br />
T Gunning 56 n/a 44 n/a 100 n/a<br />
Consequences of performance on shareholder wealth<br />
In considering the Group’s performance and benefits for shareholder wealth, the remuneration committee have regard to the<br />
following indices in respect of the current financial year and the previous four financial years.<br />
<strong>2011</strong> 2010 2009 2008 2007<br />
Profit attributable to owners of the Company ($’000s) 99,489 77,371 9,044 24,286 26,476<br />
UNPAT ($’000s) 93,470 79,261 49,100 25,900 29,300<br />
Basic EPS (cents per share) 43.1 33.7 7.4 35.6 41.5<br />
Share price at start of year $5.99 $4.04 $5.10 $10.19 $8.50<br />
Share price at end of year $6.60 $5.99 $4.04 $5.10 $10.19<br />
Change in share price $0.61 $1.95 $(1.06) $(5.09) $1.69<br />
Dividends paid (cents per share) 39.0 34.0 15.0 33.0 30.0<br />
Return on equity (non-statutory measure) 12.9% 11.4% 11.3% 14.1% 16.8%<br />
Total bonuses paid to key management personnel ($’000s) 1,022 995 1,321 945 844<br />
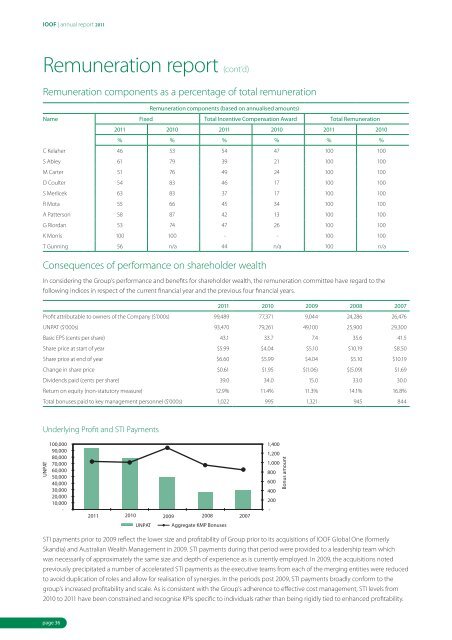
Underlying Profit and STI Payments<br />
UNPAT<br />
100,000<br />
90,000<br />
80,000<br />
70,000<br />
60,000<br />
50,000<br />
40,000<br />
30,000<br />
20,000<br />
10,000<br />
-<br />
<strong>2011</strong> 2010 2009 2008 2007<br />
UNPAT<br />
Aggregate KMP Bonuses<br />
1,400<br />
1,200<br />
1,000<br />
800<br />
600<br />
400<br />
200<br />
-<br />
Bonus amount<br />
STI payments prior to 2009 reflect the lower size and profitability of Group prior to its acquisitions of IOOF Global One (formerly<br />
Skandia) and Australian Wealth Management in 2009. STI payments during that period were provided to a leadership team which<br />
was necessarily of approximately the same size and depth of experience as is currently employed. In 2009, the acquisitions noted<br />
previously precipitated a number of accelerated STI payments as the executive teams from each of the merging entities were reduced<br />
to avoid duplication of roles and allow for realisation of synergies. In the periods post 2009, STI payments broadly conform to the<br />
group’s increased profitability and scale. As is consistent with the Group’s adherence to effective cost management, STI levels from<br />
2010 to <strong>2011</strong> have been constrained and recognise KPIs specific to individuals rather than being rigidly tied to enhanced profitability.<br />
page 36