annual report 2011
annual report 2011
annual report 2011

You also want an ePaper? Increase the reach of your titles
YUMPU automatically turns print PDFs into web optimized ePapers that Google loves.
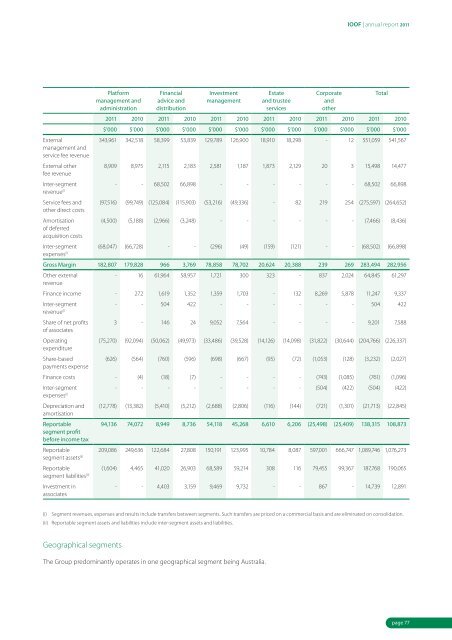
IOOF | <strong>annual</strong> <strong>report</strong> <strong>2011</strong><br />
External<br />
management and<br />
service fee revenue<br />
External other<br />
fee revenue<br />
Platform<br />
management and<br />
administration<br />
Financial<br />
advice and<br />
distribution<br />
Investment<br />
management<br />
Estate<br />
and trustee<br />
services<br />
Corporate<br />
and<br />
other<br />
<strong>2011</strong> 2010 <strong>2011</strong> 2010 <strong>2011</strong> 2010 <strong>2011</strong> 2010 <strong>2011</strong> 2010 <strong>2011</strong> 2010<br />
$’000 $’000 $’000 $’000 $’000 $’000 $’000 $’000 $’000 $’000 $’000 $’000<br />
343,961 342,518 58,399 53,839 129,789 126,900 18,910 18,298 - 12 551,059 541,567<br />
8,909 8,975 2,115 2,183 2,581 1,187 1,873 2,129 20 3 15,498 14,477<br />
Inter-segment<br />
- - 68,502 66,898 - - - - - - 68,502 66,898<br />
revenue (i)<br />
Service fees and (97,516) (99,749) (125,084) (115,903) (53,216) (49,336) - 82 219 254 (275,597) (264,652)<br />
other direct costs<br />
Amortisation<br />
(4,500) (5,188) (2,966) (3,248) - - - - - - (7,466) (8,436)<br />
of deferred<br />
acquisition costs<br />
Inter-segment (68,047) (66,728) - - (296) (49) (159) (121) - - (68,502) (66,898)<br />
expenses (i)<br />
Gross Margin 182,807 179,828 966 3,769 78,858 78,702 20,624 20,388 239 269 283,494 282,956<br />
Other external<br />
- 16 61,964 58,957 1,721 300 323 - 837 2,024 64,845 61,297<br />
revenue<br />
Finance income - 272 1,619 1,352 1,359 1,703 - 132 8,269 5,878 11,247 9,337<br />
Inter-segment<br />
- - 504 422 - - - - - - 504 422<br />
revenue (i)<br />
Share of net profits 3 - 146 24 9,052 7,564 - - - - 9,201 7,588<br />
of associates<br />
Operating<br />
(75,270) (92,094) (50,062) (49,973) (33,486) (39,528) (14,126) (14,098) (31,822) (30,644) (204,766) (226,337)<br />
expenditure<br />
Share-based<br />
(626) (564) (760) (596) (698) (667) (95) (72) (1,053) (128) (3,232) (2,027)<br />
payments expense<br />
Finance costs - (4) (18) (7) - - - - (743) (1,085) (761) (1,096)<br />
Inter-segment<br />
- - - - - - - - (504) (422) (504) (422)<br />
expenses (i)<br />
Depreciation and (12,778) (13,382) (5,410) (5,212) (2,688) (2,806) (116) (144) (721) (1,301) (21,713) (22,845)<br />
amortisation<br />
Reportable<br />
94,136 74,072 8,949 8,736 54,118 45,268 6,610 6,206 (25,498) (25,409) 138,315 108,873<br />
segment profit<br />
before income tax<br />
Reportable<br />
209,086 249,636 122,684 27,808 150,191 123,995 10,784 8,087 597,001 666,747 1,089,746 1,076,273<br />
segment assets (ii)<br />
Reportable<br />
(1,604) 4,465 41,020 26,903 68,589 59,214 308 116 79,455 99,367 187,768 190,065<br />
segment liabilities (ii)<br />
Investment in<br />
associates<br />
- - 4,403 3,159 9,469 9,732 - - 867 - 14,739 12,891<br />
Total<br />
(i) Segment revenues, expenses and results include transfers between segments. Such transfers are priced on a commercial basis and are eliminated on consolidation.<br />
(ii) Reportable segment assets and liabilities include inter-segment assets and liabilities.<br />
Geographical segments<br />
The Group predominantly operates in one geographical segment being Australia.<br />
page 77