Instructions for Analyzing Data from CAHPS Surveys
Instructions for Analyzing Data from CAHPS Surveys
Instructions for Analyzing Data from CAHPS Surveys

You also want an ePaper? Increase the reach of your titles
YUMPU automatically turns print PDFs into web optimized ePapers that Google loves.
<strong>CAHPS</strong> ® <strong>Surveys</strong> and <strong>Instructions</strong><br />
This example follows two paths <strong>for</strong> the analysis of the composite measure Q1 and Q2.<br />
One uses no adjuster variables, Run 1, and the other uses the two adjusters, A1 and<br />
A2, without imputation of missing values of the adjuster’s mean within plan, Run 2.<br />
The macro cleans (making sure the values are within the valid range <strong>for</strong> the given<br />
variable type) the items being analyzed, Q1 and Q2. In the macro call they were<br />
indicated as being a type 3 variable, which means the response values must be a 1, 2,<br />
3, or 4. Any other response value is set to missing. In our small data set (observation<br />
10), Q1 has a value of 7 so it is set to missing; all other values are fine. The adjuster<br />
values are not cleaned in the macro, so all values are accepted.<br />
The first step in the macro that begins to prepare the data <strong>for</strong> the reports is the<br />
“USABLE” section of the macro. This checks <strong>for</strong> missing values in each<br />
observation and determines whether to keep the record based on the macro<br />
arguments. The results may differ depending on whether adjusters are used and<br />
whether missing adjusters get an imputed mean value. The observations that are<br />
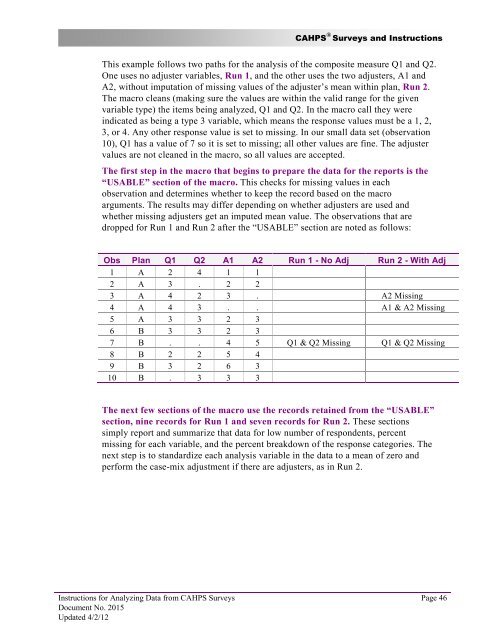
dropped <strong>for</strong> Run 1 and Run 2 after the “USABLE” section are noted as follows:<br />
Obs Plan Q1 Q2 A1 A2 Run 1 - No Adj Run 2 - With Adj<br />
1 A 2 4 1 1<br />
2 A 3 . 2 2<br />
3 A 4 2 3 . A2 Missing<br />
4 A 4 3 . . A1 & A2 Missing<br />
5 A 3 3 2 3<br />
6 B 3 3 2 3<br />
7 B . . 4 5 Q1 & Q2 Missing Q1 & Q2 Missing<br />
8 B 2 2 5 4<br />
9 B 3 2 6 3<br />
10 B . 3 3 3<br />
The next few sections of the macro use the records retained <strong>from</strong> the “USABLE”<br />
section, nine records <strong>for</strong> Run 1 and seven records <strong>for</strong> Run 2. These sections<br />
simply report and summarize that data <strong>for</strong> low number of respondents, percent<br />
missing <strong>for</strong> each variable, and the percent breakdown of the response categories. The<br />
next step is to standardize each analysis variable in the data to a mean of zero and<br />
per<strong>for</strong>m the case-mix adjustment if there are adjusters, as in Run 2.<br />
<strong>Instructions</strong> <strong>for</strong> <strong>Analyzing</strong> <strong>Data</strong> <strong>from</strong> <strong>CAHPS</strong> <strong>Surveys</strong><br />
Document No. 2015<br />
Updated 4/2/12<br />
Page 46