The achievement of Australia's Indigenous students in PISA ... - ACER
The achievement of Australia's Indigenous students in PISA ... - ACER
The achievement of Australia's Indigenous students in PISA ... - ACER
Create successful ePaper yourself
Turn your PDF publications into a flip-book with our unique Google optimized e-Paper software.
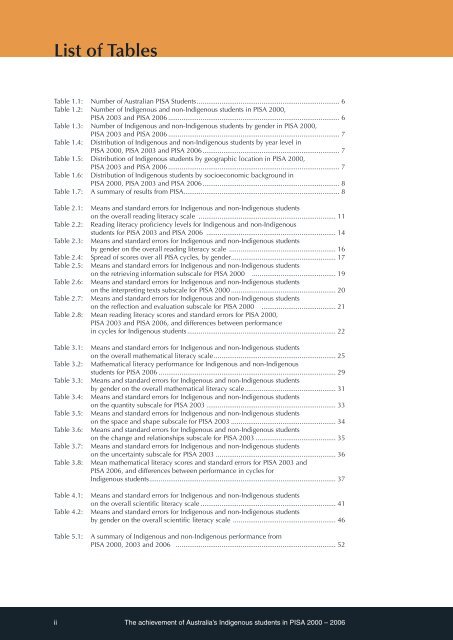
List <strong>of</strong> Tables<br />
Table 1.1: Number <strong>of</strong> Australian <strong>PISA</strong> Students............................................................................ 6<br />
Table 1.2: Number <strong>of</strong> <strong>Indigenous</strong> and non-<strong>Indigenous</strong> <strong>students</strong> <strong>in</strong> <strong>PISA</strong> 2000,<br />
<strong>PISA</strong> 2003 and <strong>PISA</strong> 2006........................................................................................... 6<br />
Table 1.3: Number <strong>of</strong> <strong>Indigenous</strong> and non-<strong>Indigenous</strong> <strong>students</strong> by gender <strong>in</strong> <strong>PISA</strong> 2000,<br />
<strong>PISA</strong> 2003 and <strong>PISA</strong> 2006........................................................................................... 7<br />
Table 1.4: Distribution <strong>of</strong> <strong>Indigenous</strong> and non-<strong>Indigenous</strong> <strong>students</strong> by year level <strong>in</strong><br />
<strong>PISA</strong> 2000, <strong>PISA</strong> 2003 and <strong>PISA</strong> 2006........................................................................ 7<br />
Table 1.5: Distribution <strong>of</strong> <strong>Indigenous</strong> <strong>students</strong> by geographic location <strong>in</strong> <strong>PISA</strong> 2000,<br />
<strong>PISA</strong> 2003 and <strong>PISA</strong> 2006........................................................................................... 7<br />
Table 1.6: Distribution <strong>of</strong> <strong>Indigenous</strong> <strong>students</strong> by socioeconomic background <strong>in</strong><br />
<strong>PISA</strong> 2000, <strong>PISA</strong> 2003 and <strong>PISA</strong> 2006........................................................................ 8<br />
Table 1.7: A summary <strong>of</strong> results from <strong>PISA</strong>.................................................................................. 8<br />
Table 2.1: Means and standard errors for <strong>Indigenous</strong> and non-<strong>Indigenous</strong> <strong>students</strong><br />
on the overall read<strong>in</strong>g literacy scale ......................................................................... 11<br />
Table 2.2: Read<strong>in</strong>g literacy pr<strong>of</strong>iciency levels for <strong>Indigenous</strong> and non-<strong>Indigenous</strong><br />
<strong>students</strong> for <strong>PISA</strong> 2003 and <strong>PISA</strong> 2006 ..................................................................... 14<br />
Table 2.3: Means and standard errors for <strong>Indigenous</strong> and non-<strong>Indigenous</strong> <strong>students</strong><br />
by gender on the overall read<strong>in</strong>g literacy scale ......................................................... 16<br />
Table 2.4: Spread <strong>of</strong> scores over all <strong>PISA</strong> cycles, by gender....................................................... 17<br />
Table 2.5: Means and standard errors for <strong>Indigenous</strong> and non-<strong>Indigenous</strong> <strong>students</strong><br />
on the retriev<strong>in</strong>g <strong>in</strong>formation subscale for <strong>PISA</strong> 2000 ............................................. 19<br />
Table 2.6: Means and standard errors for <strong>Indigenous</strong> and non-<strong>Indigenous</strong> <strong>students</strong><br />
on the <strong>in</strong>terpret<strong>in</strong>g texts subscale for <strong>PISA</strong> 2000........................................................ 20<br />
Table 2.7: Means and standard errors for <strong>Indigenous</strong> and non-<strong>Indigenous</strong> <strong>students</strong><br />
on the reflection and evaluation subscale for <strong>PISA</strong> 2000 ........................................ 21<br />
Table 2.8: Mean read<strong>in</strong>g literacy scores and standard errors for <strong>PISA</strong> 2000,<br />
<strong>PISA</strong> 2003 and <strong>PISA</strong> 2006, and differences between performance<br />
<strong>in</strong> cycles for <strong>Indigenous</strong> <strong>students</strong>............................................................................... 22<br />
Table 3.1:<br />
Table 3.2:<br />
Table 3.3:<br />
Table 3.4:<br />
Table 3.5:<br />
Table 3.6:<br />
Table 3.7:<br />
Table 3.8:<br />
Table 4.1:<br />
Table 4.2:<br />
Table 5.1:<br />
Means and standard errors for <strong>Indigenous</strong> and non-<strong>Indigenous</strong> <strong>students</strong><br />
on the overall mathematical literacy scale................................................................. 25<br />
Mathematical literacy performance for <strong>Indigenous</strong> and non-<strong>Indigenous</strong><br />
<strong>students</strong> for <strong>PISA</strong> 2006.............................................................................................. 29<br />
Means and standard errors for <strong>Indigenous</strong> and non-<strong>Indigenous</strong> <strong>students</strong><br />
by gender on the overall mathematical literacy scale................................................ 31<br />
Means and standard errors for <strong>Indigenous</strong> and non-<strong>Indigenous</strong> <strong>students</strong><br />
on the quantity subscale for <strong>PISA</strong> 2003..................................................................... 33<br />
Means and standard errors for <strong>Indigenous</strong> and non-<strong>Indigenous</strong> <strong>students</strong><br />
on the space and shape subscale for <strong>PISA</strong> 2003........................................................ 34<br />
Means and standard errors for <strong>Indigenous</strong> and non-<strong>Indigenous</strong> <strong>students</strong><br />
on the change and relationships subscale for <strong>PISA</strong> 2003........................................... 35<br />
Means and standard errors for <strong>Indigenous</strong> and non-<strong>Indigenous</strong> <strong>students</strong><br />
on the uncerta<strong>in</strong>ty subscale for <strong>PISA</strong> 2003................................................................ 36<br />
Mean mathematical literacy scores and standard errors for <strong>PISA</strong> 2003 and<br />
<strong>PISA</strong> 2006, and differences between performance <strong>in</strong> cycles for<br />
<strong>Indigenous</strong> <strong>students</strong>.................................................................................................. 37<br />
Means and standard errors for <strong>Indigenous</strong> and non-<strong>Indigenous</strong> <strong>students</strong><br />
on the overall scientific literacy scale........................................................................ 41<br />
Means and standard errors for <strong>Indigenous</strong> and non-<strong>Indigenous</strong> <strong>students</strong><br />
by gender on the overall scientific literacy scale ...................................................... 46<br />
A summary <strong>of</strong> <strong>Indigenous</strong> and non-<strong>Indigenous</strong> performance from<br />
<strong>PISA</strong> 2000, 2003 and 2006 ..................................................................................... 52<br />
ii <strong>The</strong> <strong>achievement</strong> <strong>of</strong> Australia’s <strong>Indigenous</strong> <strong>students</strong> <strong>in</strong> <strong>PISA</strong> 2000 – 2006


