The achievement of Australia's Indigenous students in PISA ... - ACER
The achievement of Australia's Indigenous students in PISA ... - ACER
The achievement of Australia's Indigenous students in PISA ... - ACER
Create successful ePaper yourself
Turn your PDF publications into a flip-book with our unique Google optimized e-Paper software.
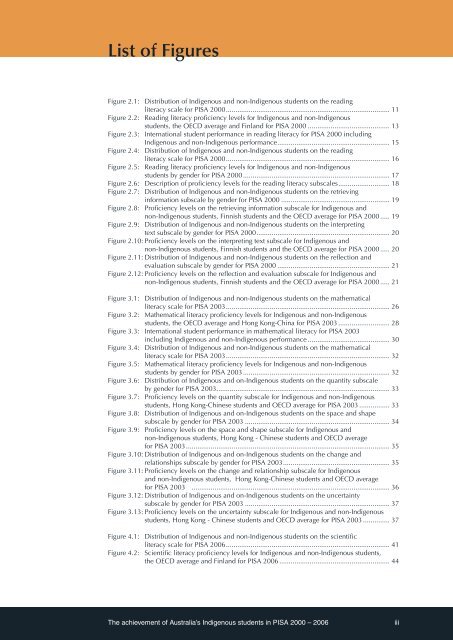
List <strong>of</strong> Figures<br />
Figure 2.1: Distribution <strong>of</strong> <strong>Indigenous</strong> and non-<strong>Indigenous</strong> <strong>students</strong> on the read<strong>in</strong>g<br />
literacy scale for <strong>PISA</strong> 2000...................................................................................... 11<br />
Figure 2.2: Read<strong>in</strong>g literacy pr<strong>of</strong>iciency levels for <strong>Indigenous</strong> and non-<strong>Indigenous</strong><br />
<strong>students</strong>, the OECD average and F<strong>in</strong>land for <strong>PISA</strong> 2000............................................ 13<br />
Figure 2.3: International student performance <strong>in</strong> read<strong>in</strong>g literacy for <strong>PISA</strong> 2000 <strong>in</strong>clud<strong>in</strong>g<br />
<strong>Indigenous</strong> and non-<strong>Indigenous</strong> performance........................................................... 15<br />
Figure 2.4: Distribution <strong>of</strong> <strong>Indigenous</strong> and non-<strong>Indigenous</strong> <strong>students</strong> on the read<strong>in</strong>g<br />
literacy scale for <strong>PISA</strong> 2000...................................................................................... 16<br />
Figure 2.5: Read<strong>in</strong>g literacy pr<strong>of</strong>iciency levels for <strong>Indigenous</strong> and non-<strong>Indigenous</strong><br />
<strong>students</strong> by gender for <strong>PISA</strong> 2000.............................................................................. 17<br />
Figure 2.6: Description <strong>of</strong> pr<strong>of</strong>iciency levels for the read<strong>in</strong>g literacy subscales........................... 18<br />
Figure 2.7: Distribution <strong>of</strong> <strong>Indigenous</strong> and non-<strong>Indigenous</strong> <strong>students</strong> on the retriev<strong>in</strong>g<br />
<strong>in</strong>formation subscale by gender for <strong>PISA</strong> 2000.......................................................... 19<br />
Figure 2.8: Pr<strong>of</strong>iciency levels on the retriev<strong>in</strong>g <strong>in</strong>formation subscale for <strong>Indigenous</strong> and<br />
non-<strong>Indigenous</strong> <strong>students</strong>, F<strong>in</strong>nish <strong>students</strong> and the OECD average for <strong>PISA</strong> 2000...... 19<br />
Figure 2.9: Distribution <strong>of</strong> <strong>Indigenous</strong> and non-<strong>Indigenous</strong> <strong>students</strong> on the <strong>in</strong>terpret<strong>in</strong>g<br />
text subscale by gender for <strong>PISA</strong> 2000...................................................................... 20<br />
Figure 2.10: Pr<strong>of</strong>iciency levels on the <strong>in</strong>terpret<strong>in</strong>g text subscale for <strong>Indigenous</strong> and<br />
non-<strong>Indigenous</strong> <strong>students</strong>, F<strong>in</strong>nish <strong>students</strong> and the OECD average for <strong>PISA</strong> 2000...... 20<br />
Figure 2.11: Distribution <strong>of</strong> <strong>Indigenous</strong> and non-<strong>Indigenous</strong> <strong>students</strong> on the reflection and<br />
evaluation subscale by gender for <strong>PISA</strong> 2000............................................................ 21<br />
Figure 2.12: Pr<strong>of</strong>iciency levels on the reflection and evaluation subscale for <strong>Indigenous</strong> and<br />
non‐<strong>Indigenous</strong> <strong>students</strong>, F<strong>in</strong>nish <strong>students</strong> and the OECD average for <strong>PISA</strong> 2000...... 21<br />
Figure 3.1: Distribution <strong>of</strong> <strong>Indigenous</strong> and non-<strong>Indigenous</strong> <strong>students</strong> on the mathematical<br />
literacy scale for <strong>PISA</strong> 2003...................................................................................... 26<br />
Figure 3.2: Mathematical literacy pr<strong>of</strong>iciency levels for <strong>Indigenous</strong> and non-<strong>Indigenous</strong><br />
<strong>students</strong>, the OECD average and Hong Kong-Ch<strong>in</strong>a for <strong>PISA</strong> 2003............................ 28<br />
Figure 3.3: International student performance <strong>in</strong> mathematical literacy for <strong>PISA</strong> 2003<br />
<strong>in</strong>clud<strong>in</strong>g <strong>Indigenous</strong> and non-<strong>Indigenous</strong> performance............................................ 30<br />
Figure 3.4: Distribution <strong>of</strong> <strong>Indigenous</strong> and non-<strong>Indigenous</strong> <strong>students</strong> on the mathematical<br />
literacy scale for <strong>PISA</strong> 2003...................................................................................... 32<br />
Figure 3.5: Mathematical literacy pr<strong>of</strong>iciency levels for <strong>Indigenous</strong> and non-<strong>Indigenous</strong><br />
<strong>students</strong> by gender for <strong>PISA</strong> 2003.............................................................................. 32<br />
Figure 3.6: Distribution <strong>of</strong> <strong>Indigenous</strong> and on-<strong>Indigenous</strong> <strong>students</strong> on the quantity subscale<br />
by gender for <strong>PISA</strong> 2003........................................................................................... 33<br />
Figure 3.7: Pr<strong>of</strong>iciency levels on the quantity subscale for <strong>Indigenous</strong> and non-<strong>Indigenous</strong><br />
<strong>students</strong>, Hong Kong-Ch<strong>in</strong>ese <strong>students</strong> and OECD average for <strong>PISA</strong> 2003................. 33<br />
Figure 3.8: Distribution <strong>of</strong> <strong>Indigenous</strong> and on-<strong>Indigenous</strong> <strong>students</strong> on the space and shape<br />
subscale by gender for <strong>PISA</strong> 2003............................................................................. 34<br />
Figure 3.9: Pr<strong>of</strong>iciency levels on the space and shape subscale for <strong>Indigenous</strong> and<br />
non-<strong>Indigenous</strong> <strong>students</strong>, Hong Kong - Ch<strong>in</strong>ese <strong>students</strong> and OECD average<br />
for <strong>PISA</strong> 2003........................................................................................................... 35<br />
Figure 3.10: Distribution <strong>of</strong> <strong>Indigenous</strong> and on-<strong>Indigenous</strong> <strong>students</strong> on the change and<br />
relationships subscale by gender for <strong>PISA</strong> 2003........................................................ 35<br />
Figure 3.11: Pr<strong>of</strong>iciency levels on the change and relationship subscale for <strong>Indigenous</strong><br />
and non-<strong>Indigenous</strong> <strong>students</strong>, Hong Kong-Ch<strong>in</strong>ese <strong>students</strong> and OECD average<br />
for <strong>PISA</strong> 2003 ........................................................................................................ 36<br />
Figure 3.12: Distribution <strong>of</strong> <strong>Indigenous</strong> and on-<strong>Indigenous</strong> <strong>students</strong> on the uncerta<strong>in</strong>ty<br />
subscale by gender for <strong>PISA</strong> 2003............................................................................. 37<br />
Figure 3.13: Pr<strong>of</strong>iciency levels on the uncerta<strong>in</strong>ty subscale for <strong>Indigenous</strong> and non-<strong>Indigenous</strong><br />
<strong>students</strong>, Hong Kong - Ch<strong>in</strong>ese <strong>students</strong> and OECD average for <strong>PISA</strong> 2003............... 37<br />
Figure 4.1: Distribution <strong>of</strong> <strong>Indigenous</strong> and non-<strong>Indigenous</strong> <strong>students</strong> on the scientific<br />
literacy scale for <strong>PISA</strong> 2006...................................................................................... 41<br />
Figure 4.2: Scientific literacy pr<strong>of</strong>iciency levels for <strong>Indigenous</strong> and non-<strong>Indigenous</strong> <strong>students</strong>,<br />
the OECD average and F<strong>in</strong>land for <strong>PISA</strong> 2006........................................................... 44<br />
<strong>The</strong> <strong>achievement</strong> <strong>of</strong> Australia’s <strong>Indigenous</strong> <strong>students</strong> <strong>in</strong> <strong>PISA</strong> 2000 – 2006<br />
iii


