2005 Yearbook of Immigration Statistics - Homeland Security
2005 Yearbook of Immigration Statistics - Homeland Security
2005 Yearbook of Immigration Statistics - Homeland Security

You also want an ePaper? Increase the reach of your titles
YUMPU automatically turns print PDFs into web optimized ePapers that Google loves.
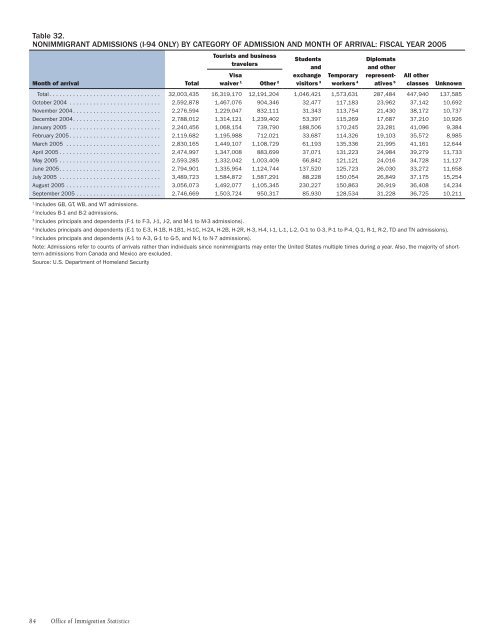
Table 32.<br />
NONIMMIGRANT ADMISSIONS (I-94 ONLY) BY CATEGORY OF ADMISSION AND MONTH OF ARRIVAL: FISCAL YEAR <strong>2005</strong><br />
Month <strong>of</strong> arrival<br />
Total<br />
Tourists and business<br />
travelers<br />
Visa<br />
waiver 1 Other 2<br />
Students<br />
and<br />
exchange<br />
visitors 3<br />
Temporary<br />
workers 4<br />
Diplomats<br />
and other<br />
representatives<br />
5<br />
All other<br />
classes<br />
Unknown<br />
Total . . . . . . . . . . . . . . . . . . . . . . . . . . . . . . . . . 32,003,435 16,319,170 12,191,204 1,046,421 1,573,631 287,484 447,940 137,585<br />
October 2004 . . . . . . . . . . . . . . . . . . . . . . . . . . . 2,592,878 1,467,076 904,346 32,477 117,183 23,962 37,142 10,692<br />
November 2004 . . . . . . . . . . . . . . . . . . . . . . . . . . 2,276,594 1,229,047 832,111 31,343 113,754 21,430 38,172 10,737<br />
December 2004 . . . . . . . . . . . . . . . . . . . . . . . . . . 2,788,012 1,314,121 1,239,402 53,397 115,269 17,687 37,210 10,926<br />
January <strong>2005</strong> . . . . . . . . . . . . . . . . . . . . . . . . . . . 2,240,456 1,068,154 739,790 188,506 170,245 23,281 41,096 9,384<br />
February <strong>2005</strong> . . . . . . . . . . . . . . . . . . . . . . . . . . . 2,119,682 1,195,988 712,021 33,687 114,326 19,103 35,572 8,985<br />
March <strong>2005</strong> . . . . . . . . . . . . . . . . . . . . . . . . . . . . 2,830,165 1,449,107 1,108,729 61,193 135,336 21,995 41,161 12,644<br />
April <strong>2005</strong> . . . . . . . . . . . . . . . . . . . . . . . . . . . . . . 2,474,997 1,347,008 883,699 37,071 131,223 24,984 39,279 11,733<br />
May <strong>2005</strong> . . . . . . . . . . . . . . . . . . . . . . . . . . . . . . 2,593,285 1,332,042 1,003,409 66,842 121,121 24,016 34,728 11,127<br />
June <strong>2005</strong> . . . . . . . . . . . . . . . . . . . . . . . . . . . . . . 2,794,901 1,335,954 1,124,744 137,520 125,723 26,030 33,272 11,658<br />
July <strong>2005</strong> . . . . . . . . . . . . . . . . . . . . . . . . . . . . . . 3,489,723 1,584,872 1,587,291 88,228 150,054 26,849 37,175 15,254<br />
August <strong>2005</strong> . . . . . . . . . . . . . . . . . . . . . . . . . . . . 3,056,073 1,492,077 1,105,345 230,227 150,863 26,919 36,408 14,234<br />
September <strong>2005</strong> . . . . . . . . . . . . . . . . . . . . . . . . . 2,746,669 1,503,724 950,317 85,930 128,534 31,228 36,725 10,211<br />
1<br />
Includes GB, GT, WB, and WT admissions.<br />
2<br />
Includes B-1 and B-2 admissions.<br />
3<br />
Includes principals and dependents (F-1 to F-3, J-1, J-2, and M-1 to M-3 admissions).<br />
4<br />
Includes principals and dependents (E-1 to E-3, H-1B, H-1B1, H-1C, H-2A, H-2B, H-2R, H-3, H-4, I-1, L-1, L-2, O-1 to O-3, P-1 to P-4, Q-1, R-1, R-2, TD and TN admissions).<br />
5<br />
Includes principals and dependents (A-1 to A-3, G-1 to G-5, and N-1 to N-7 admissions).<br />
Note: Admissions refer to counts <strong>of</strong> arrivals rather than individuals since nonimmigrants may enter the United States multiple times during a year. Also, the majority <strong>of</strong> shortterm<br />
admissions from Canada and Mexico are excluded.<br />
Source: U.S. Department <strong>of</strong> <strong>Homeland</strong> <strong>Security</strong><br />
84 Office <strong>of</strong> <strong>Immigration</strong> <strong>Statistics</strong>