Table 36. DEPORTABLE ALIENS LOCATED BY PROGRAM AND BORDER PATROL SECTOR AND INVESTIGATIONS SPECIAL AGENT IN CHARGE (SAC) JURISDICTION: FISCAL YEARS 1996 TO <strong>2005</strong> Program and sector/ jurisdiction 1996 1997 1998 1999 2000 2001 2002 2003 2004 <strong>2005</strong> PROGRAM Total . . . . . . . . . . . . . . . . . . . . . . 1,649,986 1,536,520 1,679,439 1,714,035 1,814,729 1,387,486 1,062,270 1,046,422 1,264,232 1,291,142 Border Patrol . . . . . . . . . . . . . . . . . 1,549,876 1,412,953 1,555,776 1,579,010 1,676,438 1,266,214 955,310 931,557 1,160,395 1,189,108 Investigations . . . . . . . . . . . . . . . . 100,110 123,567 123,663 135,025 138,291 121,272 106,960 114,865 103,837 102,034 BORDER PATROL SECTOR 2 Total . . . . . . . . . . . . . . . . . . . . . . 1,549,876 1,412,953 1,555,776 1,579,010 1,676,438 1,266,214 955,310 931,557 1,160,395 1,189,108 Southwest sectors . . . . . . . . . . . . . 1,507,020 1,368,707 1,516,680 1,537,000 1,643,679 1,235,718 929,809 905,065 1,139,282 1,171,428 San Diego, CA . . . . . . . . . . . . . . . 483,815 283,889 248,092 182,267 151,681 110,075 100,681 111,515 138,608 126,909 EL Centro, CA . . . . . . . . . . . . . . . . 66,873 146,210 226,695 225,279 238,126 172,852 108,273 92,099 74,467 55,726 Yuma, AZ . . . . . . . . . . . . . . . . . . . 28,310 30,177 76,195 93,388 108,747 78,385 42,654 56,638 98,060 138,438 Tucson, AZ . . . . . . . . . . . . . . . . . . 305,348 272,397 387,406 470,449 616,346 449,675 333,648 347,263 491,771 439,090 EL Paso, TX . . . . . . . . . . . . . . . . . 145,929 124,376 125,035 110,857 115,696 112,857 94,154 88,816 104,399 122,689 Marfa, TX . . . . . . . . . . . . . . . . . . . 13,214 12,692 14,509 14,952 13,689 12,087 11,392 10,319 10,530 10,536 Del Rio, TX . . . . . . . . . . . . . . . . . . 121,137 113,280 131,058 156,653 157,178 104,875 66,985 50,145 53,794 68,510 Laredo, TX . . . . . . . . . . . . . . . . . . 131,841 141,893 103,433 114,004 108,973 87,068 82,095 70,521 74,706 75,342 Rio Grande Valley, TX . . . . . . . . . . 210,553 243,793 204,257 169,151 133,243 107,844 89,927 77,749 92,947 134,188 Other sectors . . . . . . . . . . . . . . . . . 42,856 44,246 39,096 42,010 32,759 30,496 25,501 26,492 21,113 17,680 Blaine, WA . . . . . . . . . . . . . . . . . . 2,224 2,684 2,403 2,421 2,581 2,089 1,732 1,380 1,354 1,001 Buffalo, NY . . . . . . . . . . . . . . . . . 2,090 2,065 1,640 1,666 1,570 1,434 1,102 564 671 400 Detroit, MI . . . . . . . . . . . . . . . . . . 1,304 1,500 1,768 1,838 2,057 2,106 1,511 2,345 1,912 1,792 Grand Forks, ND . . . . . . . . . . . . . . 1,334 1,978 905 656 562 921 1,369 1,223 1,225 754 Havre, MT . . . . . . . . . . . . . . . . . . 1,483 2,813 1,145 1,448 1,568 1,305 1,463 1,406 986 949 Houlton, ME . . . . . . . . . . . . . . . . . 247 309 307 461 489 685 432 292 263 233 Livermore, CA 1 . . . . . . . . . . . . . . . 12,756 10,607 11,633 11,198 6,205 5,211 4,371 3,565 1,850 117 Miami, FL . . . . . . . . . . . . . . . . . . . 8,258 8,305 6,065 6,961 6,237 5,962 5,143 5,931 4,602 7,243 New Orleans, LA . . . . . . . . . . . . . . 8,642 9,094 8,008 10,777 6,478 5,033 4,665 5,151 2,889 1,358 Ramey, PR . . . . . . . . . . . . . . . . . . 1,454 896 1,244 1,405 1,731 1,952 835 1,688 1,813 1,619 Spokane, WA . . . . . . . . . . . . . . . . 1,352 2,331 2,176 1,308 1,324 1,335 1,142 992 847 279 Swanton, VT . . . . . . . . . . . . . . . . . 1,712 1,664 1,802 1,871 1,957 2,463 1,736 1,955 2,701 1,935 INVESTIGATIONS SAC JURISDICTION Total . . . . . . . . . . . . . . . . . . . . . . 100,110 123,567 123,663 135,025 138,291 121,272 106,960 114,865 103,837 102,034 Atlanta, GA . . . . . . . . . . . . . . . . . . 1,997 2,748 2,584 2,607 2,786 3,300 2,689 3,528 3,237 3,659 Baltimore, MD . . . . . . . . . . . . . . . . 1,026 1,003 1,095 1,059 809 1,032 768 1,135 990 980 Boston, MA . . . . . . . . . . . . . . . . . . 2,194 2,210 2,656 2,538 2,751 2,719 2,276 3,318 3,141 3,248 Buffalo, NY . . . . . . . . . . . . . . . . . . 2,606 2,602 3,168 3,475 3,366 3,209 3,426 3,751 1,031 892 Chicago, IL . . . . . . . . . . . . . . . . . . . 4,518 5,794 4,187 4,761 6,493 7,835 7,748 8,572 8,113 7,056 Dallas, TX . . . . . . . . . . . . . . . . . . . 7,882 10,502 10,948 10,387 11,387 8,046 4,263 3,787 5,160 4,902 Denver, CO . . . . . . . . . . . . . . . . . . . 3,710 3,895 2,985 4,305 10,576 7,661 7,422 7,916 5,943 4,440 Detroit, MI . . . . . . . . . . . . . . . . . . . 1,474 2,096 1,709 1,264 1,152 1,447 1,693 2,552 2,239 2,480 EL Paso, TX . . . . . . . . . . . . . . . . . . 2,176 3,014 4,801 6,272 6,377 5,022 2,842 2,258 2,017 1,624 Honolulu, HI . . . . . . . . . . . . . . . . . . 384 479 602 1,678 453 418 469 633 425 251 Houston, TX . . . . . . . . . . . . . . . . . . 5,588 9,743 9,487 8,459 7,678 6,436 5,472 6,473 4,251 4,449 Los Angeles, CA . . . . . . . . . . . . . . . 14,387 13,329 10,935 12,688 14,386 12,852 12,478 11,094 13,253 11,514 Miami, FL . . . . . . . . . . . . . . . . . . . . 1,251 2,297 1,914 2,191 1,779 1,854 1,654 1,849 1,815 1,980 New Orleans, LA . . . . . . . . . . . . . . . 1,785 3,043 2,915 2,568 3,551 3,322 3,227 3,280 2,357 2,220 New York, NY . . . . . . . . . . . . . . . . . 4,801 5,962 6,589 7,029 5,238 4,105 2,977 4,468 4,019 4,953 Newark, NJ . . . . . . . . . . . . . . . . . . 1,209 1,304 1,095 464 1,046 1,063 1,186 1,963 1,892 1,594 Philadelphia, PA . . . . . . . . . . . . . . . 1,426 1,890 1,967 1,721 1,658 1,815 2,455 3,543 2,506 2,696 Phoenix, AZ . . . . . . . . . . . . . . . . . . 9,484 7,776 10,640 15,644 13,946 8,079 7,112 7,768 12,385 10,621 Saint Paul, MN . . . . . . . . . . . . . . . . 2,048 3,209 3,855 4,523 5,668 5,105 5,909 5,437 2,596 2,925 San Antonio, TX . . . . . . . . . . . . . . . 3,534 5,412 9,552 8,776 9,791 8,434 7,267 7,115 3,943 3,244 San Diego, CA . . . . . . . . . . . . . . . . 4,381 4,595 4,745 4,368 3,357 4,573 3,276 3,277 5,291 4,703 San Francisco, CA . . . . . . . . . . . . . 14,781 21,192 15,958 19,850 16,109 14,687 11,321 12,125 9,088 11,089 San Juan, PR . . . . . . . . . . . . . . . . . 1,454 1,009 696 1,010 1,376 1,521 1,755 893 1,185 1,691 Seattle, WA . . . . . . . . . . . . . . . . . . 4,621 5,954 5,849 5,115 4,746 4,911 4,983 4,855 3,254 4,302 Tampa, FL . . . . . . . . . . . . . . . . . . . 593 910 1,283 1,232 1,268 1,231 1,430 1,730 1,571 2,226 Washington, DC . . . . . . . . . . . . . . . 800 1,599 1,448 1,041 544 595 862 1,545 2,135 2,295 1 Livermore sector closed August 31, 2004. 2 <strong>2005</strong> data reported as <strong>of</strong> April 13, 2006. Source: U.S. Department <strong>of</strong> <strong>Homeland</strong> <strong>Security</strong> Office <strong>of</strong> <strong>Immigration</strong> <strong>Statistics</strong> 93
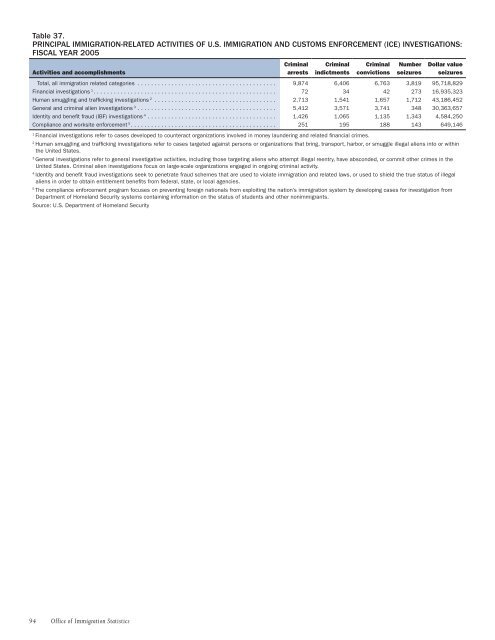
Table 37. PRINCIPAL IMMIGRATION-RELATED ACTIVITIES OF U.S. IMMIGRATION AND CUSTOMS ENFORCEMENT (ICE) INVESTIGATIONS: FISCAL YEAR <strong>2005</strong> Activities and accomplishments Criminal arrests Criminal indictments Criminal convictions Number seizures Dollar value seizures Total, all immigration related categories . . . . . . . . . . . . . . . . . . . . . . . . . . . . . . . . . . . . . . . . . 9,874 6,406 6,763 3,819 95,718,829 Financial investigations 1 . . . . . . . . . . . . . . . . . . . . . . . . . . . . . . . . . . . . . . . . . . . . . . . . . . . . . . 72 34 42 273 16,935,323 Human smuggling and trafficking investigations 2 . . . . . . . . . . . . . . . . . . . . . . . . . . . . . . . . . . . . 2,713 1,541 1,657 1,712 43,186,452 General and criminal alien investigations 3 . . . . . . . . . . . . . . . . . . . . . . . . . . . . . . . . . . . . . . . . . 5,412 3,571 3,741 348 30,363,657 Identity and benefit fraud (IBF) investigations 4 . . . . . . . . . . . . . . . . . . . . . . . . . . . . . . . . . . . . . . 1,426 1,065 1,135 1,343 4,584,250 Compliance and worksite enforcement 5 . . . . . . . . . . . . . . . . . . . . . . . . . . . . . . . . . . . . . . . . . . . 251 195 188 143 649,146 1 Financial investigations refer to cases developed to counteract organizations involved in money laundering and related financial crimes. 2 Human smuggling and trafficking investigations refer to cases targeted against persons or organizations that bring, transport, harbor, or smuggle illegal aliens into or within the United States. 3 General investigations refer to general investigative activities, including those targeting aliens who attempt illegal reentry, have absconded, or commit other crimes in the United States. Criminal alien investigations focus on large-scale organizations engaged in ongoing criminal activity. 4 Identity and benefit fraud investigations seek to penetrate fraud schemes that are used to violate immigration and related laws, or used to shield the true status <strong>of</strong> illegal aliens in order to obtain entitlement benefits from federal, state, or local agencies. 5 The compliance enforcement program focuses on preventing foreign nationals from exploiting the nation’s immigration system by developing cases for investigation from Department <strong>of</strong> <strong>Homeland</strong> <strong>Security</strong> systems containing information on the status <strong>of</strong> students and other nonimmigrants. Source: U.S. Department <strong>of</strong> <strong>Homeland</strong> <strong>Security</strong> 94 Office <strong>of</strong> <strong>Immigration</strong> <strong>Statistics</strong>