

PDF: 667 KB - Bureau of Infrastructure, Transport and Regional ...
PDF: 667 KB - Bureau of Infrastructure, Transport and Regional ...
PDF: 667 KB - Bureau of Infrastructure, Transport and Regional ...

Create successful ePaper yourself
Turn your PDF publications into a flip-book with our unique Google optimized e-Paper software.
BTRE | Working Paper 70.2<br />
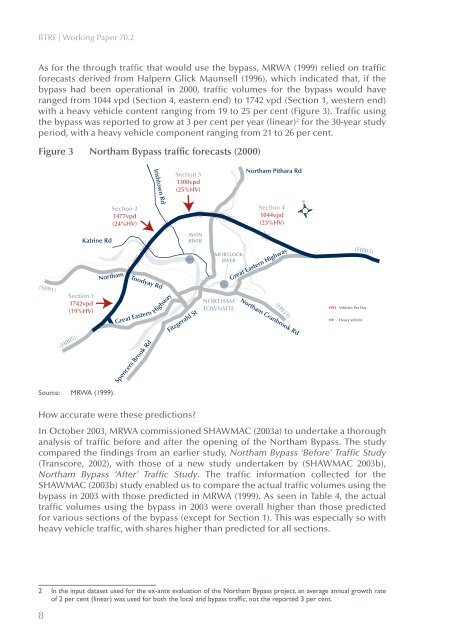
As for the through traffic that would use the bypass, MRWA (1999) relied on traffic<br />
forecasts derived from Halpern Glick Maunsell (1996), which indicated that, if the<br />
bypass had been operational in 2000, traffic volumes for the bypass would have<br />
ranged from 1044 vpd (Section 4, eastern end) to 1742 vpd (Section 1, western end)<br />
with a heavy vehicle content ranging from 19 to 25 per cent (Figure 3). Traffic using<br />
the bypass was reported to grow at 3 per cent per year (linear) 2 for the 30-year study<br />
period, with a heavy vehicle component ranging from 21 to 26 per cent.<br />
Figure 3 Northam Bypass traffic forecasts (2000)<br />
Section 3<br />
1300vpd<br />
(25%HV)<br />
Northam Pithara Rd<br />
Irishtown Rd<br />
Section 2<br />
1477vpd<br />
(24%HV)<br />
Section 4<br />
1044vpd<br />
(23%HV)<br />
Katrine Rd<br />
AVON<br />
RIVER<br />
Northam<br />
MORTLOCK<br />
RIVER<br />
Great Eastern Highway<br />
(H005)<br />
(S091)<br />
Section 1<br />
1742vpd<br />
(19%HV)<br />
(H005)<br />
Toodyay Rd<br />
Great Eastern<br />
Spencers Brook Rd<br />
Highway<br />
Fitzgerald St<br />
NORTHAM<br />
TOWNSITE<br />
Northam Cranbrook Rd<br />
(H031)<br />
VPD Vehicles Per Day<br />
HV<br />
Heavy Vehicle<br />
Source: MRWA (1999).<br />
How accurate were these predictions<br />
In October 2003, MRWA commissioned SHAWMAC (2003a) to undertake a thorough<br />
analysis <strong>of</strong> traffic before <strong>and</strong> after the opening <strong>of</strong> the Northam Bypass. The study<br />
compared the findings from an earlier study, Northam Bypass ‘Before’ Traffic Study<br />
(Transcore, 2002), with those <strong>of</strong> a new study undertaken by (SHAWMAC 2003b),<br />
Northam Bypass ‘After’ Traffic Study. The traffic information collected for the<br />
SHAWMAC (2003b) study enabled us to compare the actual traffic volumes using the<br />
bypass in 2003 with those predicted in MRWA (1999). As seen in Table 4, the actual<br />
traffic volumes using the bypass in 2003 were overall higher than those predicted<br />
for various sections <strong>of</strong> the bypass (except for Section 1). This was especially so with<br />
heavy vehicle traffic, with shares higher than predicted for all sections.<br />
2 In the input dataset used for the ex-ante evaluation <strong>of</strong> the Northam Bypass project, an average annual growth rate<br />
<strong>of</strong> 2 per cent (linear) was used for both the local <strong>and</strong> bypass traffic, not the reported 3 per cent.


