PDF: 667 KB - Bureau of Infrastructure, Transport and Regional ...
PDF: 667 KB - Bureau of Infrastructure, Transport and Regional ...
PDF: 667 KB - Bureau of Infrastructure, Transport and Regional ...
Create successful ePaper yourself
Turn your PDF publications into a flip-book with our unique Google optimized e-Paper software.
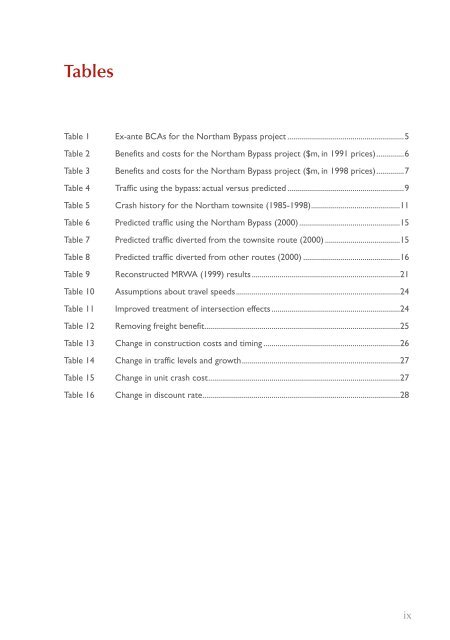
Tables<br />
Table 1 Ex-ante BCAs for the Northam Bypass project............................................................5<br />
Table 2 Benefits <strong>and</strong> costs for the Northam Bypass project ($m, in 1991 prices)..............6<br />
Table 3 Benefits <strong>and</strong> costs for the Northam Bypass project ($m, in 1998 prices)..............7<br />
Table 4 Traffic using the bypass: actual versus predicted ...........................................................9<br />
Table 5 Crash history for the Northam townsite (1985-1998).............................................11<br />
Table 6 Predicted traffic using the Northam Bypass (2000)...................................................15<br />
Table 7 Predicted traffic diverted from the townsite route (2000).......................................15<br />
Table 8 Predicted traffic diverted from other routes (2000)..................................................16<br />
Table 9 Reconstructed MRWA (1999) results...........................................................................21<br />
Table 10 Assumptions about travel speeds...................................................................................24<br />
Table 11 Improved treatment <strong>of</strong> intersection effects .................................................................24<br />
Table 12 Removing freight benefit...................................................................................................25<br />
Table 13 Change in construction costs <strong>and</strong> timing......................................................................26<br />
Table 14 Change in traffic levels <strong>and</strong> growth................................................................................27<br />
Table 15 Change in unit crash cost.................................................................................................27<br />
Table 16 Change in discount rate....................................................................................................28<br />
ix


