

PDF: 667 KB - Bureau of Infrastructure, Transport and Regional ...
PDF: 667 KB - Bureau of Infrastructure, Transport and Regional ...
PDF: 667 KB - Bureau of Infrastructure, Transport and Regional ...

Create successful ePaper yourself
Turn your PDF publications into a flip-book with our unique Google optimized e-Paper software.
Chapter 3 | Review <strong>of</strong> ex-ante BCA analyses<br />
Savings in crash costs<br />
According to MRWA (1999), safety benefits as a result <strong>of</strong> the bypass would be<br />
$4.9m in present value terms, representing 7.6 per cent <strong>of</strong> the total road user benefits<br />
(Table 3).<br />
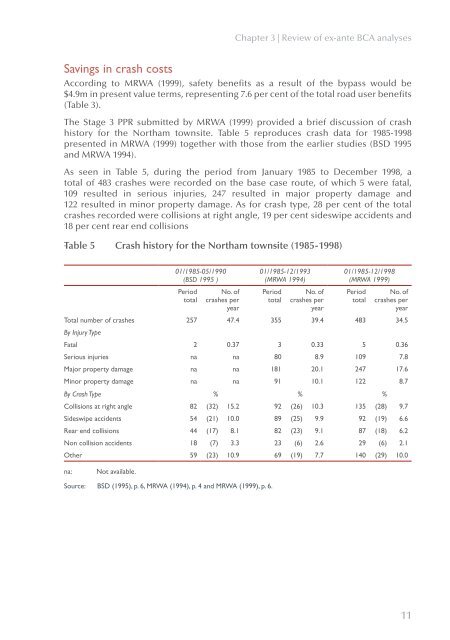
The Stage 3 PPR submitted by MRWA (1999) provided a brief discussion <strong>of</strong> crash<br />
history for the Northam townsite. Table 5 reproduces crash data for 1985-1998<br />
presented in MRWA (1999) together with those from the earlier studies (BSD 1995<br />
<strong>and</strong> MRWA 1994).<br />
As seen in Table 5, during the period from January 1985 to December 1998, a<br />
total <strong>of</strong> 483 crashes were recorded on the base case route, <strong>of</strong> which 5 were fatal,<br />
109 resulted in serious injuries, 247 resulted in major property damage <strong>and</strong><br />
122 resulted in minor property damage. As for crash type, 28 per cent <strong>of</strong> the total<br />
crashes recorded were collisions at right angle, 19 per cent sideswipe accidents <strong>and</strong><br />
18 per cent rear end collisions<br />
. Table 5 Crash history for the Northam townsite (1985-1998)<br />
01/1985-05/1990<br />
(BSD 1995 )<br />
Period<br />
total<br />
No. <strong>of</strong><br />
crashes per<br />
year<br />
01/1985-12/1993<br />
(MRWA 1994)<br />
Period<br />
total<br />
No. <strong>of</strong><br />
crashes per<br />
year<br />
01/1985-12/1998<br />
(MRWA 1999)<br />
Period<br />
total<br />
No. <strong>of</strong><br />
crashes per<br />
year<br />
Total number <strong>of</strong> crashes 257 47.4 355 39.4 483 34.5<br />
By Injury Type<br />
Fatal 2 0.37 3 0.33 5 0.36<br />
Serious injuries na na 80 8.9 109 7.8<br />
Major property damage na na 181 20.1 247 17.6<br />
Minor property damage na na 91 10.1 122 8.7<br />
By Crash Type % % %<br />
Collisions at right angle 82 (32) 15.2 92 (26) 10.3 135 (28) 9.7<br />
Sideswipe accidents 54 (21) 10.0 89 (25) 9.9 92 (19) 6.6<br />
Rear end collisions 44 (17) 8.1 82 (23) 9.1 87 (18) 6.2<br />
Non collision accidents 18 (7) 3.3 23 (6) 2.6 29 (6) 2.1<br />
Other 59 (23) 10.9 69 (19) 7.7 140 (29) 10.0<br />
na:<br />
Not available.<br />
Source: BSD (1995), p. 6, MRWA (1994), p. 4 <strong>and</strong> MRWA (1999), p. 6.<br />
11


