Digital Oscilloscope Mixed Signal Oscilloscope
Digital Oscilloscope Mixed Signal Oscilloscope
Digital Oscilloscope Mixed Signal Oscilloscope

Create successful ePaper yourself
Turn your PDF publications into a flip-book with our unique Google optimized e-Paper software.
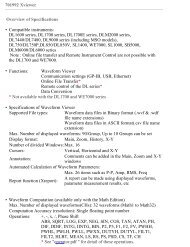
Search & Zoom — Extract the desired waveforms for detailed analysis<br />
Quickly extract locations and abnormalities you wish to analyze from the<br />
acquired waveform data, and zoom in anywhere on waveform details.<br />
The DL6000/DLM6000 series has enhanced Search and Zoom functions that<br />
allow you to search for desired portions of waveform data and observe those<br />
waveforms in detail.<br />
- Search function for extracting abnormal phenomena<br />
The Search function can search both analog and logic signals in History Memory (History search).<br />
Search for address and data on I 2 C bus<br />
Scroll<br />
Zoom<br />
Main search functions:<br />
• State search (Hi/Lo setting of each channel)<br />
• Serial pattern (I 2 C, SPI, CAN, general-use pattern) search<br />
• Polygon zone search<br />
• Waveform zone search<br />
• Parameter search (Measured parameters, FFT, etc.)<br />
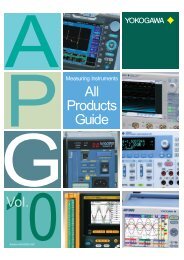
- Display two zoomed areas<br />
simultaneously<br />
Because the DL6000/DLM6000 series lets you set zoom<br />
factors independently, you can display two zoomed<br />
waveform areas with different time axis scales at the<br />
same time.<br />
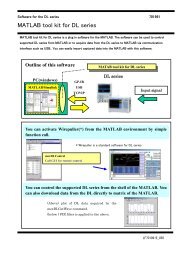
- Zoom and scroll with<br />
the zoom knob and jog shuttle<br />
Intuitively adjust the zoom factor with the zoom knob, and<br />
the scroll with the jog shuttle. You can also scroll the<br />
zoom window automatically with the Auto Scroll function.<br />
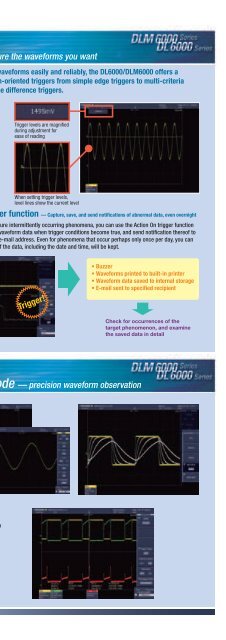
Automated measurement of waveform parameters — Automatically display numeric values<br />
Automated measurement of waveform parameters -Automatically display waveform values<br />
• Vertical waveform parameters such as amplitude, RMS<br />
• Time axis waveform parameters such as frequency, startup time<br />
• Delay time between specified signal edges<br />
• Automatic measurement of time axis waveform parameters is even possible<br />
on logic signals<br />
• Measurement Location Indicator indicates the measured location<br />
of a specified item<br />
• Display the statistics on the automated measurement values<br />
of waveform parameters.<br />
• Normal statistical processing (Continuous)<br />
• Statistical processing for each period (Cycle)<br />
• Statistical processing of history waveforms (History)<br />
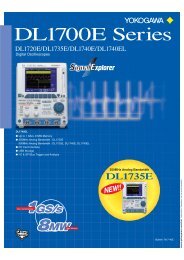
- Measure a variety of parameters automatically<br />
Simply select the check boxes of the parameters you wish to measure automatically<br />
in the setting screen's parameter list.<br />
Simultaneously display up to 16 measured parameters during acquisition. Additional<br />
measured values can be obtained in the analysis screen, or via PC communication.<br />
You can measure waveform parameters of periodic waveforms each<br />
period, and display them in lists and trend graphs. This is useful when<br />
evaluating period-by-period waveform fluctuations or loss in switching<br />
circuits.<br />
6