Miguel A. Diaz , Koichi Kusunoki , and Akira Tasai
Miguel A. Diaz , Koichi Kusunoki , and Akira Tasai
Miguel A. Diaz , Koichi Kusunoki , and Akira Tasai

Create successful ePaper yourself
Turn your PDF publications into a flip-book with our unique Google optimized e-Paper software.
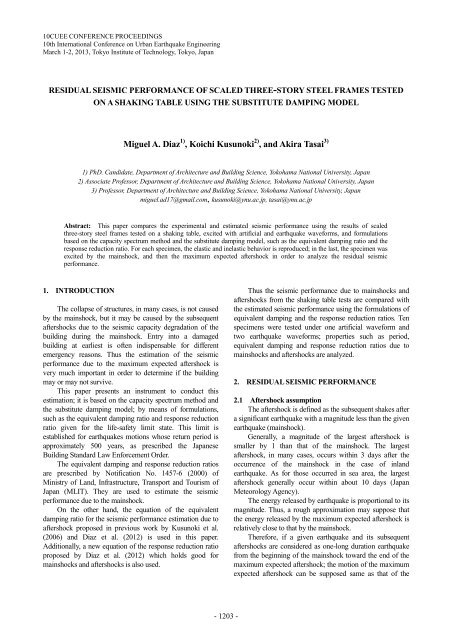
10CUEE CONFERENCE PROCEEDINGS<br />
10th International Conference on Urban Earthquake Engineering<br />
March 1-2, 2013, Tokyo Institute of Technology, Tokyo, Japan<br />
RESIDUAL SEISMIC PERFORMANCE OF SCALED THREE-STORY STEEL FRAMES TESTED<br />
ON A SHAKING TABLE USING THE SUBSTITUTE DAMPING MODEL<br />
<strong>Miguel</strong> A. <strong>Diaz</strong> 1) , <strong>Koichi</strong> <strong>Kusunoki</strong> 2) , <strong>and</strong> <strong>Akira</strong> <strong>Tasai</strong> 3)<br />
1) PhD. C<strong>and</strong>idate, Department of Architecture <strong>and</strong> Building Science, Yokohama National University, Japan<br />
2) Associate Professor, Department of Architecture <strong>and</strong> Building Science, Yokohama National University, Japan<br />
3) Professor, Department of Architecture <strong>and</strong> Building Science, Yokohama National University, Japan<br />
miguel.ad17@gmail.com, kusunoki@ynu.ac.jp, tasai@ynu.ac.jp<br />
Abstract: This paper compares the experimental <strong>and</strong> estimated seismic performance using the results of scaled<br />
three-story steel frames tested on a shaking table, excited with artificial <strong>and</strong> earthquake waveforms, <strong>and</strong> formulations<br />
based on the capacity spectrum method <strong>and</strong> the substitute damping model, such as the equivalent damping ratio <strong>and</strong> the<br />
response reduction ratio. For each specimen, the elastic <strong>and</strong> inelastic behavior is reproduced; in the last, the specimen was<br />
excited by the mainshock, <strong>and</strong> then the maximum expected aftershock in order to analyze the residual seismic<br />
performance.<br />
1. INTRODUCTION<br />
The collapse of structures, in many cases, is not caused<br />
by the mainshock, but it may be caused by the subsequent<br />
aftershocks due to the seismic capacity degradation of the<br />
building during the mainshock. Entry into a damaged<br />
building at earliest is often indispensable for different<br />
emergency reasons. Thus the estimation of the seismic<br />
performance due to the maximum expected aftershock is<br />
very much important in order to determine if the building<br />
may or may not survive.<br />
This paper presents an instrument to conduct this<br />
estimation; it is based on the capacity spectrum method <strong>and</strong><br />
the substitute damping model; by means of formulations,<br />
such as the equivalent damping ratio <strong>and</strong> response reduction<br />
ratio given for the life-safety limit state. This limit is<br />
established for earthquakes motions whose return period is<br />
approximately 500 years, as prescribed the Japanese<br />
Building St<strong>and</strong>ard Law Enforcement Order.<br />
The equivalent damping <strong>and</strong> response reduction ratios<br />
are prescribed by Notification No. 1457-6 (2000) of<br />
Ministry of L<strong>and</strong>, Infrastructure, Transport <strong>and</strong> Tourism of<br />
Japan (MLIT). They are used to estimate the seismic<br />
performance due to the mainshock.<br />
On the other h<strong>and</strong>, the equation of the equivalent<br />
damping ratio for the seismic performance estimation due to<br />
aftershock proposed in previous work by <strong>Kusunoki</strong> et al.<br />
(2006) <strong>and</strong> <strong>Diaz</strong> et al. (2012) is used in this paper.<br />
Additionally, a new equation of the response reduction ratio<br />
proposed by <strong>Diaz</strong> et al. (2012) which holds good for<br />
mainshocks <strong>and</strong> aftershocks is also used.<br />
Thus the seismic performance due to mainshocks <strong>and</strong><br />
aftershocks from the shaking table tests are compared with<br />
the estimated seismic performance using the formulations of<br />
equivalent damping <strong>and</strong> the response reduction ratios. Ten<br />
specimens were tested under one artificial waveform <strong>and</strong><br />
two earthquake waveforms; properties such as period,<br />
equivalent damping <strong>and</strong> response reduction ratios due to<br />
mainshocks <strong>and</strong> aftershocks are analyzed.<br />
2. RESIDUAL SEISMIC PERFORMANCE<br />
2.1 Aftershock assumption<br />
The aftershock is defined as the subsequent shakes after<br />
a significant earthquake with a magnitude less than the given<br />
earthquake (mainshock).<br />
Generally, a magnitude of the largest aftershock is<br />
smaller by 1 than that of the mainshock. The largest<br />
aftershock, in many cases, occurs within 3 days after the<br />
occurrence of the mainshock in the case of inl<strong>and</strong><br />
earthquake. As for those occurred in sea area, the largest<br />
aftershock generally occur within about 10 days (Japan<br />
Meteorology Agency).<br />
The energy released by earthquake is proportional to its<br />
magnitude. Thus, a rough approximation may suppose that<br />
the energy released by the maximum expected aftershock is<br />
relatively close to that by the mainshock.<br />
Therefore, if a given earthquake <strong>and</strong> its subsequent<br />
aftershocks are considered as one-long duration earthquake<br />
from the beginning of the mainshock toward the end of the<br />
maximum expected aftershock; the motion of the maximum<br />
expected aftershock can be supposed same as that of the<br />
- 1203 -
mainshock, then neglect the inner shakes, because they do<br />
not produce larger responses than the maximum expected<br />
aftershock.<br />
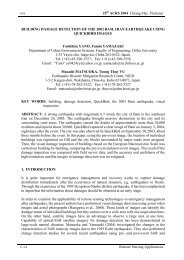
Using this assumption, the total motion to conduct the<br />
residual seismic performance analysis is given by the<br />
earthquake inputted twice, mainshock <strong>and</strong> aftershock, <strong>and</strong> a<br />
gap between both. The duration of this gap is set in the<br />
measure that the system vibration converges to zero, as<br />
shown in Figure 1.<br />
Eq. (2) is also prescribed by Notification No. 1457-6<br />
(2000), based on the substitute structural method (Shibata<br />
<strong>and</strong> Sozen, 1976). It estimates the equivalent damping ratio<br />
of an equivalent SDOF system as the weighted average<br />
respect to the strain energy with a viscous damping ratio of<br />
0.05 for the first-mode at the damaged-initiation limit state,<br />
since at this stage the building behavior remains elastic.<br />
m W i is the strain energy dissipated in member i.<br />
1.00<br />
0.75<br />
0.50<br />
0.25<br />
0.00<br />
-0.25<br />
-0.50<br />
-0.75<br />
-1.00<br />
1.00<br />
0.75<br />
0.50<br />
0.25<br />
0.00<br />
-0.25<br />
-0.50<br />
-0.75<br />
-1.00<br />
Mainshock<br />
Inner shakes<br />
Gap until system reaches rest<br />
Maximum expected<br />
Aftershock<br />
h eq = ∑<br />
m h eq−i∙ m W i<br />
+ 0.05 (2)<br />
∑ m W i<br />
2.3 Response reduction ratio<br />
The response reduction ratio reduces the elastic spectral<br />
response to the inelastic response. Notification No. 1457-6<br />
(2000) also prescribes the response reduction ratio as Eq. (3),<br />
which guarantees the life-safety limit state.<br />
F h = 1.5<br />
1+10∙h eq<br />
(3)<br />
Figure 1 Aftershock assumption<br />
2.2 Equivalent damping ratio<br />
The equivalent damping ratio for yielding structures<br />
can be determined by the hysteresis damping in terms of the<br />
elastic strain energy of a structure by means of the geometric<br />
stiffness method (Jennings, 1968).<br />
Notification No. 1457-6 (2000) prescribes the<br />
equivalent damping ratio m h eq−i of a structural member i<br />
in Eq. (1) for the life-safety limit state.<br />
h eq−i m<br />
= γ ∙ (1 − 1⁄ √μ) (1)<br />
The coefficient γ in Eq. (1) is assumed as 0.25 in case<br />
of material which constitutes the member, <strong>and</strong> the joint<br />
connected to the adjacent member are rigid; <strong>and</strong> as 0.20 in<br />
cases of members or braced members where the buckling<br />
strength is degraded by the compressive forces when seismic<br />
forces acts (member exhibits a slip-type characteristic), as<br />
prescribed Notification No. 1457-6 (2000).<br />
The coefficient γ in Eq. (1) may hold good for the<br />
estimation of the equivalent damping ratio due to<br />
mainshocks; otherwise the energy dissipation (or equivalent<br />
damping) due to the aftershock is less than or equal to that<br />
due to its corresponding mainshock. Therefore, this<br />
coefficient can be conveniently reduced in order to obtain<br />
larger responses, such as responses during an aftershock,<br />
since the response reduction ratio in Eq. (3) is inversely<br />
proportional to the equivalent damping ratio in Eq. (1). Thus,<br />
the coefficient γ is reduced to 0.12 <strong>and</strong> 0.08 by an<br />
appropriate curve fitting based on a series of nonlinear<br />
simulations obtained for systems under aftershocks (<strong>Diaz</strong> et<br />
al., 2012).<br />
Additionally, previous work by <strong>Diaz</strong> et al. (2012)<br />
proposes a new equation of the response reduction ratio,<br />
given by Eq. (4). It is developed solving the equation of<br />
motion under the stationary vibration, <strong>and</strong> then adapting it to<br />
the non-stationary vibration, such as earthquake motions, by<br />
means of curve fitting to analytical response of a series of<br />
nonlinear simulations.<br />
F h ∗ = √ 1.1+α∙h eq 2<br />
1+(40+α)∙h eq<br />
2 (4)<br />
The Japanese Building St<strong>and</strong>ard Law Enforcement<br />
Order requires that spectral acceleration of a structure at a<br />
limit state should be higher than the corresponding<br />
acceleration of the reduced dem<strong>and</strong> spectrum using the<br />
equivalent damping ratio at the same limit state.<br />
2.4 Seismic performance evaluation<br />
During a damaging earthquake, some buildings may<br />
survive, but the subsequent aftershocks may or may not<br />
cause the building collapse; that’s why, it is desirable to<br />
recognize the building state (seismic performance) after a<br />
mainshock, <strong>and</strong> to estimate the seismic performance due to<br />
the maximum expected aftershock in order to anticipate if<br />
the building may or may not survive, <strong>and</strong> so safeguard life.<br />
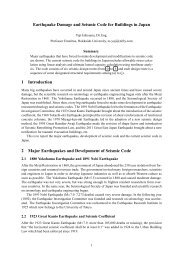
The seismic performance of a building due to a given<br />
earthquake motion is examined by comparing the capacity<br />
curve <strong>and</strong> dem<strong>and</strong> spectrum in terms of S a − S d relations,<br />
as shown in Figure 2. The intersection between the capacity<br />
curve <strong>and</strong> the dem<strong>and</strong> spectrum for an appropriate<br />
equivalent damping ratio which represents the inelastic<br />
response under the given earthquake, is called the<br />
performance point (ATC-40, 1996).<br />
- 1204 -
Representative restoring force (S a )<br />
Dem<strong>and</strong> spectrum<br />
(A)<br />
(B) (C)<br />
(D)<br />
Representative displacement (S d )<br />
Yield point<br />
Performance point due to<br />
mainshock<br />
Performance point due to<br />
aftershock<br />
Performance point at<br />
ultimate state<br />
Curve-1 (for mainshock)<br />
Curve-2 (for aftershock)<br />
Capacity curve<br />
Figure 2 Scheme of the seismic performance evaluation<br />
The concept of the seismic performance evaluation<br />
method is represented by the scheme shown in Figure 2. The<br />
performance point due to the mainshock is represented by<br />
the point (B) on the capacity curve, in this figure; the<br />
dem<strong>and</strong> spectrum is reduced by increasing the viscous<br />
damping ratio until it intersects the point (B). Thus the<br />
reduced dem<strong>and</strong> spectrum is represented as curve-1 in<br />
Figure 2, <strong>and</strong> the converged viscous damping ratio is defined<br />
as the equivalent damping ratio for mainshock.<br />
The maximum response during the maximum expected<br />
aftershock, represented by the performance point (C) on the<br />
capacity curve in Figure 2, is larger than or equal to that<br />
during the mainshock, represented by the performance point<br />
(B) in the same figure. Thus the equivalent damping ratio for<br />
aftershock is less than or equal to that for mainshock, as<br />
observed in Figure 2, because the energy dissipation (or<br />
equivalent damping) during the maximum expected<br />
aftershock is less than or nearly equal to energy dissipation<br />
during its corresponding mainshock. Then the dem<strong>and</strong><br />
spectrum is again reduced until it intersects the performance<br />
point (C) in Figure 2; the reduced dem<strong>and</strong> spectrum is<br />
represented as curve-2 <strong>and</strong> the converged viscous damping<br />
ratio is defined as the equivalent damping ratio for<br />
aftershock.<br />
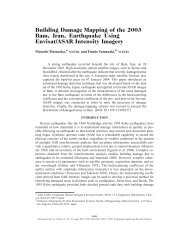
3.1 Tests specimens<br />
The specimen consists in a scaled three-story <strong>and</strong><br />
one-bay steel plane frames; their members are connected by<br />
bolts to a rigid joint, as shown in Figure 3.<br />
The bay width is 1000 mm, the first-story height varies<br />
from 805 mm to 1005 mm, <strong>and</strong> the second <strong>and</strong> third stories<br />
heights are 700 mm. The beams are rectangular bars of<br />
100×6 mm widened at the middle to support the<br />
accelerometer on each level. The first-story is constituted by<br />
rectangular bars as columns without braces; the second <strong>and</strong><br />
third stories are braced frames with rectangular bars of<br />
100×6 mm as columns, <strong>and</strong> circular bars M10 as braces (a<br />
pair in each front).<br />
The design of the specimen supposed that the columns<br />
of the first-level would be only affected during the tests, due<br />
to the soft-story behavior of this structure. The sections of<br />
these columns were reduced in 50% at the bottom in order to<br />
provide to the specimen a plastic hinge to control the failure<br />
mechanism.<br />
Thus, the properties of the specimen depend on the<br />
dimensions of first-story columns (thickness <strong>and</strong> height); the<br />
second, third braced frames are preserved for all tests.<br />
However, the second <strong>and</strong> third braced frames are also<br />
observed by the measurement system.<br />
Rigid<br />
joint<br />
Braces<br />
Device for<br />
U<br />
rocking<br />
Shaking table<br />
base<br />
Accelerometer<br />
Displacement<br />
transducer<br />
Fix supports<br />
To be replaced<br />
by stiff springs<br />
3. SHAKING TABLE TESTS<br />
The experimental tests are based on the assumption<br />
described in Section 2.1. The testing program consists in<br />
four series of excitation. The first excitation was produced<br />
by the white-noise in order to evaluate the dynamic<br />
properties. The second excitation was the test using the input<br />
motion with small acceleration amplitude to induce an<br />
elastic response. The third excitation was the test using large<br />
acceleration amplitude, so that the specimen was within the<br />
inelastic range (mainshock). And, the fourth excitation was<br />
the test using the previous acceleration amplitude (or slightly<br />
less) to produce the maximum expected aftershock.<br />
E<br />
Figure 3 Configuration of specimens<br />
The specimens Frame1a, Frame2a,b <strong>and</strong> S-F01,02,03<br />
are fixed support; while specimens S-S01,02,03,04 are also<br />
fixed support, but the base (ground) includes a small rocking<br />
effect due to the adding of stiff springs (K spring =500 N/mm)<br />
between supports <strong>and</strong> base, as shown Figure 3. The initial<br />
compressive deformations of springs were 1 mm <strong>and</strong> 7 mm<br />
for S-S01,02 <strong>and</strong> S-S03,04, respectively. Members of these<br />
specimens consisted of SS400 (326 MPa). Table 1 presents<br />
characteristics of these specimens.<br />
- 1205 -
Table 1 Characteristics of specimens<br />
Specimen<br />
Thickness<br />
1 st F<br />
column<br />
(mm)<br />
Height<br />
1 st F<br />
(mm)<br />
Total<br />
weight<br />
(kN)<br />
Natural<br />
period<br />
(s)<br />
Yield.<br />
Disp.<br />
(mm)<br />
Frame1 a 4.5 805 1.450 1.03 66<br />
Frame2 a, b 4.5 1005 1.464 1.66 101<br />
S-F 01, 02, 03 6.0 1000 1.485 0.93 71<br />
S-S 01, 02 6.0 1000 1.485 0.99 73<br />
S-S 03, 04 6.0 1000 1.485 0.98 73<br />
a) Velocity response spectra<br />
The measurement system was given by accelerometers<br />
at the base <strong>and</strong> beams of each level, <strong>and</strong> displacement<br />
transducers connected at each eastern rigid joint, as shown in<br />
Figure 3.<br />
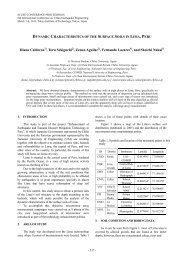
3.2 Input waveforms<br />
The input motions to conduct this study were one<br />
artificial wave: the WG60, <strong>and</strong> two earthquake records: the<br />
KOBE-NS (Kobe, 1995) <strong>and</strong> the MYG013 (Tohoku, 2011).<br />
The input motions were scaled in order to induce different<br />
performance levels on the specimen within elastic <strong>and</strong><br />
inelastic ranges, both mainshocks <strong>and</strong> aftershocks. Figure 4<br />
shows the WG60, the KOBE-NS <strong>and</strong> the MYG013<br />
waveforms.<br />
b) Displacement <strong>and</strong> acceleration response spectra<br />
Figure 5 Response spectra<br />
3.3 Equivalent SDOF<br />
In order to conduct the residual seismic performance<br />
analysis, it is necessary to transform the capacity curve of<br />
the specimen in terms of S a − S d relations.<br />
The probable value of the maximum response is usually<br />
given by the square root of the sum of square (SRSS) of the<br />
maximum modal response components. Then the maximum<br />
displacement at i-th story <strong>and</strong> the base shear force can be<br />
expressed approximately by Eq. (5) <strong>and</strong> Eq. (6) (Shibata,<br />
2010), respectively; where s S d , s S a is the spectral<br />
displacement <strong>and</strong> spectral acceleration for the s-th mode.<br />
The base shear force of N-DOF is given by Eq. (7).<br />
|δ i | max ≈ √∑<br />
N<br />
| s β ∙ s u i ∙ S d<br />
s | 2<br />
S=1 (5)<br />
Figure 4 Input waveforms<br />
Figure 5 shows their respective a) normalized velocity<br />
response spectra respect to the maximum spectral velocity,<br />
<strong>and</strong> b) normalized response spectra respect to peak ground<br />
acceleration (PGA) <strong>and</strong> maximum spectral displacement.<br />
The maximum spectral response with viscous damping ratio<br />
of 0.05 was obtained at periods of 1.27 seconds, 0.87<br />
seconds <strong>and</strong> 0.67 seconds for the WG60, the KOBE-NS <strong>and</strong><br />
the MYG013 waveforms, respectively (Figure 5a).<br />
N N<br />
S=1 i=1<br />
+ (6)<br />
Q ≈ √∑ *∑ m i ∙ s β ∙ s u i ∙ s S a<br />
N<br />
Q = ∑i=1 m i ∙ (ẍ i + ẍ g) (7)<br />
Particularly, the specimens can be assumed as 3-DOF<br />
systems. Their configuration allows that second <strong>and</strong> third<br />
participation factor can be neglected, <strong>and</strong> the first-mode<br />
distribution can be assumed as the unit { 1 u} ≈ *1+. Then<br />
Eq. (5) is rewritten as Eq. (8) to calculate the spectral<br />
acceleration, <strong>and</strong> Eq. (7) into Eq. (6) is rewritten as Eq. (9) to<br />
calculate the spectral displacement.<br />
- 1206 -
1 S d ≈ |δ i | max<br />
sui<br />
(8)<br />
1 S a = ∑ 3<br />
i=1 m i∙(ẍ i+ẍ g)<br />
∑3<br />
i=1 m i<br />
(9)<br />
3.4 Tests results<br />
The representative response or spectral response is<br />
calculated by Eq. (8) <strong>and</strong> Eq. (9), using experimental data<br />
such as the displacement from transducers <strong>and</strong> the absolute<br />
acceleration from accelerometers on each level. The<br />
responses during mainshocks <strong>and</strong> aftershocks, in terms of<br />
S a − S d relations, with different maximum acceleration<br />
amplitudes of waveforms are plotted in Figure 6, Figure 7<br />
<strong>and</strong> Figure 8, where g is the acceleration of gravity.<br />
Figure 6 shows the response during the WG60<br />
waveform for four specimens, namely: Frame1a, S-F01,<br />
S-S01 <strong>and</strong> S-S04 with maximum acceleration amplitude of<br />
waveform of 0.36g, both mainshock <strong>and</strong> aftershock.<br />
a) Frame2a (0.17g) b) Frame2b (0.33g→0.25g)<br />
c) S-S02 (0.38g) d) S-S03 (0.38g)<br />
e) S-F02 (0.38g)<br />
a) Frame1a (0.36g) b) S-F01 (0.36g)<br />
Figure 7 Response during the KOBE-NS waveform<br />
Figure 8 shows the response during the MYG013<br />
waveform for the specimen S-F03 with maximum<br />
acceleration amplitude of waveform of 0.39g, both<br />
mainshock <strong>and</strong> aftershock.<br />
c) S-S01 (0.36g) d) S-S04 (0.36g)<br />
Figure 6 Response during the WG60 waveform<br />
Figure 7 shows the response during the KOBE-NS<br />
waveform for five specimens, namely: Frame2a with<br />
maximum acceleration amplitude of waveform of 0.17g<br />
(mainshock <strong>and</strong> aftershock), Frame2b with 0.33g for<br />
mainshock <strong>and</strong> 0.25g for aftershock; <strong>and</strong> S-F02, S-S02 <strong>and</strong><br />
S-S03 with 0.38g, both mainshock <strong>and</strong> aftershock.<br />
In Figure 7b, a negative slope arose in the<br />
representative acceleration; it is because the specimen<br />
Frame2b is slender <strong>and</strong> long-period frame (see Table 1), <strong>and</strong><br />
suffered the P-Δ effect (its capacity is reduced in front of the<br />
gravity effect). The maximum response within the inelastic<br />
range was larger than the elastic spectral response with<br />
damping ratio of 0.05.<br />
a) S-F03 (0.39g)<br />
Figure 8 Response during the MYG013 waveform<br />
In the previous experimental study (<strong>Diaz</strong>, <strong>Kusunoki</strong> <strong>and</strong><br />
<strong>Tasai</strong>, 2012), the equivalent damping ratio was estimated<br />
using the maximum response amplitude, negative or positive,<br />
to estimate the equivalent damping ratio; by increasing the<br />
damping ratio until the resulting dem<strong>and</strong> spectrum is<br />
intersected with this maximum response amplitude, as<br />
described Section 2.4 in Figure 2.<br />
Those results showed that some responses such as those<br />
from specimens S-F02, S-S02 <strong>and</strong> S-S03 were unsafely<br />
- 1207 -
estimated using the formulations of the equivalent damping<br />
<strong>and</strong> response reduction ratios presented in this paper. It is<br />
because the fundamental period of these specimens are close<br />
to the predominant period of the corresponding input<br />
waveform (KOBE-NS). Also, the specimen Frame2b could<br />
not be used because it suffered the P-Δ effect <strong>and</strong> its<br />
maximum response amplitude is larger than the elastic<br />
spectral response with damping ratio of 0.05.<br />
On the other h<strong>and</strong>, the equation of equivalent damping<br />
ratio given in Eq. (1) is developed by the geometric stiffness<br />
method which supposes that the positive <strong>and</strong> negative<br />
amplitudes of the hysteresis loop are equal. Although, as<br />
shown in Figure 6a, 6c, 7b, 7c, 7d <strong>and</strong> 7e, the hysteresis<br />
loops are shifted in many cases toward negative or positive<br />
direction, <strong>and</strong> amplitudes (negative <strong>and</strong> positive) turn out to<br />
be quite different; this shifting is intensified during<br />
aftershocks, where a residual deformation due to the<br />
mainshock may occur.<br />
Thus the energy dissipation, or equivalent damping, is<br />
represented much closer to the true value when both<br />
amplitudes, negative <strong>and</strong> positive, are used to estimate an<br />
equivalent period (peak-to-peak), <strong>and</strong> then defining the<br />
equivalent amplitude.<br />
An important characteristic is that the envelope of the<br />
spectral response during the mainshock maintains the same<br />
shape during the aftershock, but moved toward one direction<br />
or another, <strong>and</strong> the residual deformation becomes the new<br />
origin. It means the capacity curve preserves the same shape<br />
until the structure sustains major damage (large deformation).<br />
This phenomenon can be observed in Figure 9, the envelope<br />
of the response during mainshock looks like moved toward<br />
positive direction during the aftershock, <strong>and</strong> the new origin<br />
is relocated at 3.2 cm.<br />
Therefore, the equivalent damping <strong>and</strong> response<br />
reduction ratios are calculated after defining the equivalent<br />
amplitude as the intersection between the line parallel to the<br />
resulting line of joining the peak amplitudes (peak-to-peak)<br />
which crosses the origin <strong>and</strong> the negative or positive branch<br />
of the envelope of the spectral response (Figure 9a). In case<br />
of the response during the aftershock (Figure 9b), the<br />
parallel line crosses the new origin (residual deformation).<br />
After defining the equivalent amplitude, the equivalent<br />
damping ratio is calculated by reducing the dem<strong>and</strong> curve<br />
toward the equivalent amplitude, as describe in Section 2.4.<br />
Then the response reduction ratio is calculated as the ratio of<br />
the equivalent amplitude to the elastic response. The elastic<br />
response corresponds to the intersection between the parallel<br />
with the dem<strong>and</strong> spectrum with damping ratio of 0.05, as<br />
shown in Figure 9a. In case of aftershocks, the dem<strong>and</strong><br />
spectrum is moved toward the residual deformation as<br />
shown in Figure 9b.<br />
4. ANALYSIS OF RESULTS<br />
Figure 10 shows the relation between the ductility<br />
factors due to mainshocks <strong>and</strong> aftershocks, using the<br />
absolute maximum displacement (maximum amplitude),<br />
<strong>and</strong> the negative <strong>and</strong> positive maximum displacement<br />
(equivalent amplitude).<br />
a) Response during mainshock<br />
Figure 10 Relation between ductility factors<br />
b) Response during aftershock<br />
Figure 9 Estimation of parameters using the equivalent<br />
amplitude<br />
Table 2, Table 3, Table 4 <strong>and</strong> Table 5 show the ductility<br />
factor (μ), the equivalent damping ratio (h eq ) <strong>and</strong> the<br />
response reduction ratio (F h ) obtained from the experimental<br />
tests, <strong>and</strong> the estimated response reduction ratio. In order to<br />
- 1208 -
estimate the response reduction ratio, the ductility factor is<br />
evaluated into Eq. (2) to estimate the equivalent damping<br />
ratio <strong>and</strong> then it is evaluated into Eq. (3) <strong>and</strong> Eq. (4), F h<br />
<strong>and</strong> F h ∗ , respectively.<br />
Table 2 <strong>and</strong> Table 3 show results due to mainshocks <strong>and</strong><br />
aftershocks, respectively, using the maximum absolute<br />
displacement. As shown in these tables, the equivalent<br />
damping <strong>and</strong> response reduction ratios are not calculated for<br />
the specimen Frame-2b, because the inelastic response is<br />
much larger than the spectral response with damping ratio of<br />
0.05, both mainshock <strong>and</strong> aftershock.<br />
Table 2 Results due to mainshock using the maximum<br />
absolute amplitude<br />
Specimen waveform<br />
Experimental<br />
Estimated<br />
μ h eq F h F h F h<br />
∗<br />
Frame-1a WG60 1.73 16.57% 0.540 0.714 0.874<br />
Frame-2a KOBE-NS 0.82 5.19% 0.968 1.081 1.018<br />
Frame-2b KOBE-NS 1.66 - - - -<br />
S-F01 WG60 1.72 11.24% 0.651 0.915 0.974<br />
S-F02 KOBE-NS 2.18 4.42% 1.028 0.879 0.960<br />
S-F03 MYG013 1.37 7.57% 0.770 0.935 0.981<br />
S-S01 WG60 1.98 10.62% 0.672 0.895 0.966<br />
S-S02 KOBE-NS 1.90 6.48% 0.907 0.890 0.964<br />
S-S03 KOBE-NS 1.99 5.57% 0.959 0.882 0.961<br />
S-S04 WG60 1.76 10.91% 0.665 0.897 0.967<br />
Table 3 Results due to aftershock using the maximum<br />
absolute amplitude<br />
Specimen waveform<br />
Experimental<br />
Estimated<br />
μ h eq F h F h F h<br />
∗<br />
Frame-1a WG60 1.80 16.41% 0.542 0.831 0.939<br />
Frame-2a KOBE-NS 0.83 4.99% 0.976 1.056 1.013<br />
Frame-2b KOBE-NS 2.23 - - - -<br />
S-F01 WG60 1.76 10.83% 0.671 0.905 0.970<br />
S-F02 KOBE-NS 2.59 5.19% 1.002 0.858 0.951<br />
S-F03 MYG013 1.39 7.37% 0.778 0.929 0.978<br />
S-S01 WG60 1.87 10.04% 0.699 0.901 0.968<br />
S-S02 KOBE-NS 2.23 5.95% 0.981 0.872 0.957<br />
S-S03 KOBE-NS 2.39 5.60% 0.987 0.855 0.950<br />
S-S04 WG60 1.83 10.07% 0.691 0.884 0.962<br />
Table 4 <strong>and</strong> Table 5 show results due to mainshocks <strong>and</strong><br />
aftershocks, respectively, using the equivalent amplitude<br />
defined by the positive <strong>and</strong> negative peak amplitudes<br />
(peak-to-peak). Contrasting with the maximum absolute<br />
amplitude, the equivalent amplitude allows calculating the<br />
equivalent damping <strong>and</strong> response reduction ratios for the<br />
specimen Frame-2b, which suffered P-Δ effect.<br />
Table 4 Results due to mainshock using the equivalent<br />
amplitude<br />
Specimen waveform<br />
Experimental<br />
Estimated<br />
μ h eq F h F h F h<br />
∗<br />
Frame-1a WG60 1.63 17.95% 0.525 0.735 0.887<br />
Frame-2a KOBE-NS 0.56 16.09% 0.639 1.305 1.044<br />
Frame-2b KOBE-NS 1.44 7.83% 0.885 0.984 0.996<br />
S-F01 WG60 1.66 11.82% 0.642 0.927 0.978<br />
S-F02 KOBE-NS 2.01 7.70% 0.892 0.892 0.965<br />
S-F03 MYG013 1.36 7.83% 0.757 0.939 0.982<br />
S-S01 WG60 1.79 10.99% 0.613 0.909 0.971<br />
S-S02 KOBE-NS 1.89 6.49% 0.912 0.894 0.966<br />
S-S03 KOBE-NS 1.95 6.19% 0.946 0.887 0.963<br />
S-S04 WG60 1.72 11.29% 0.648 0.901 0.968<br />
Table 5 Results due to aftershock using the equivalent<br />
amplitude<br />
Specimen waveform<br />
Experimental<br />
Estimated<br />
μ h eq F h F h F h<br />
∗<br />
Frame-1a WG60 1.61 16.50% 0.498 0.855 0.950<br />
Frame-2a KOBE-NS 0.75 6.93% 0.886 1.084 1.019<br />
Frame-2b KOBE-NS 1.13 16.14% 0.698 0.985 0.996<br />
S-F01 WG60 1.71 11.24% 0.663 0.924 0.977<br />
S-F02 KOBE-NS 2.03 8.38% 0.870 0.890 0.964<br />
S-F03 MYG013 1.39 7.61% 0.772 0.935 0.980<br />
S-S01 WG60 1.80 10.80% 0.644 0.907 0.971<br />
S-S02 KOBE-NS 1.98 5.98% 0.955 0.888 0.963<br />
S-S03 KOBE-NS 1.98 6.70% 0.927 0.882 0.961<br />
S-S04 WG60 1.77 10.84% 0.669 0.896 0.966<br />
Figure 11 shows the relationship between the ductility<br />
factor <strong>and</strong> the equivalent damping ratio from the<br />
experimental test using the maximum absolute amplitude<br />
<strong>and</strong> the equivalent amplitude due to a) mainshocks <strong>and</strong> b)<br />
aftershocks.<br />
a) mainshocks b) aftershocks<br />
Figure 11 Estimation of equivalent damping ratio<br />
Results in Figure 11 are compared with the estimated<br />
equivalent damping ratio which is defined by the curve<br />
heq-0.25 <strong>and</strong> heq-0.12, for mainshock <strong>and</strong> aftershock,<br />
- 1209 -
espectively. It corresponds to coefficients γ 0.25 <strong>and</strong> 0.12<br />
in Eq. (1), because the hysteretic behavior is quiet close to<br />
the perfect elasto-plastic bilinear model.<br />
The equivalent damping ratio becomes larger using the<br />
equivalent amplitude than using the maximum absolute<br />
amplitude, it is observed in Figure 11. It means that the<br />
equation of the equivalent damping ratio can be estimated<br />
more safely these values using the equivalent amplitude.<br />
In order to compare the experimental <strong>and</strong> estimated<br />
response, the response reduction ratio is calculated from the<br />
shaking table tests <strong>and</strong> formulations. The response is safely<br />
estimated when the actual response reduction ratio<br />
(experimental) is less than or equal to the estimated response<br />
reduction ratio using the formulations presented in this paper,<br />
both mainshock <strong>and</strong> aftershock, whichever is applicable.<br />
F h experimental ≤ F h<br />
estimated<br />
(10)<br />
The comparison between the estimated response<br />
reduction ratio <strong>and</strong> the experimental response reduction ratio<br />
due to mainshocks <strong>and</strong> aftershocks is presented in Figure 12<br />
<strong>and</strong> Figure 13, using Eq. (3) <strong>and</strong> Eq. (4), respectively. These<br />
figures show this comparison using a) the maximum<br />
absolute amplitude <strong>and</strong> b) the equivalent amplitude. Here,<br />
the response safely estimated are represented by points<br />
above the line (y=x).<br />
a) maximum amplitude b) equivalent amplitude<br />
Figure 12 Response reduction ratio by F h , Eq. (3)<br />
a) maximum amplitude b) equivalent amplitude<br />
Figure 13 Response reduction ratio by F h ∗ , Eq. (4)<br />
5. CONCLUSIONS<br />
From the analysis conducted for the experimental <strong>and</strong><br />
estimated results, the following conclusion can be drawn:<br />
o Ten scale three-story steel frames were tested on a<br />
shaking table, seismic performance is determined from<br />
the experimental results <strong>and</strong> compared with the<br />
estimated values.<br />
o The definition of the equivalent amplitude allows<br />
calculating responses where the maximum absolute<br />
amplitude exceeds the elastic spectral response, even<br />
for the specimen which suffered the P-Δ effect.<br />
o The equivalent damping ratio can be more safely<br />
estimated when the equivalent amplitude is defined<br />
instead of the maximum absolute amplitude.<br />
o The formulations estimated safely the equivalent<br />
damping ratio <strong>and</strong> then the response reduction ratio due<br />
to mainshocks <strong>and</strong> aftershocks using the peak<br />
amplitudes to define the equivalent amplitude. The<br />
response reduction ratio is more safely estimated using<br />
Eq. (4) than Eq. (3).<br />
However, this technique would become safer for the<br />
seismic performance estimation if an equation to estimate<br />
the shifting displacement is incorporated.<br />
Acknowledgements:<br />
Authors acknowledge Miho Yamashita, Yuichi Hatanaka, Daiki<br />
Hinata, <strong>and</strong> Yuki Hattori for their great contributions during the tests.<br />
The installation <strong>and</strong> maintenance of the measurement system has<br />
been supported by Mr. Masayuki Araki, Mr. Takamori Ito <strong>and</strong> other<br />
staffs of aLab Co. Also, the authors would like to express their<br />
gratitude to the Japan Science <strong>and</strong> Technology Agency (JST)<br />
through the Science <strong>and</strong> Technology Research Partnership for<br />
Sustainable Development (SATREPS) project “Enhancement of<br />
earthquake <strong>and</strong> tsunami disaster mitigation technology in Peru” for<br />
the fellowship during this research.<br />
References:<br />
Ministry of L<strong>and</strong>, Infrastructure, Transport <strong>and</strong> Tourism (2000).<br />
“Notification No. 1457-6.” Technical St<strong>and</strong>ard for Structural<br />
Calculation of Response <strong>and</strong> Limit Strength of Buildings.<br />
Jennings P. (1968). “Equivalent Viscous Damping for Yielding<br />
Structures.” Proceedings of ASCE, Vol.94, No. 1, 103-116.<br />
<strong>Kusunoki</strong>, K. (2006) “Analytical Study on Estimation of Equivalent<br />
Viscous Damping Ratio for aftershock”, Proceedings of the<br />
Japan Concrete Institute Proceedings of the Japan Concrete<br />
Institute 28(2), 1057-1062.<br />
<strong>Diaz</strong> M., <strong>Kusunoki</strong> K. <strong>and</strong> <strong>Tasai</strong> A. (2012). “Analytical Study of<br />
Residual Seismic Performance by Estimation of Response<br />
Reduction Ratio <strong>and</strong> Equivalent Damping for Aftershocks.”<br />
Proceedings of 15th World Conference on Earthquake<br />
Engineering, Paper ID 1950.<br />
Shibata A. <strong>and</strong> Sozen M. (1976). “The Substitute Structure Method<br />
for Seismic Design in RC.” Proceedings of ASCE, Journal on<br />
Structural Division, Vol. 102, No. 1, 1-18.<br />
ATC-40 (1996). Seismic Evaluation <strong>and</strong> Retrofit of Concrete<br />
Buildings, Report No. SS 96-01, Applied Technology Council.<br />
Shibata A. (2010). “Dynamic Analysis of Earthquake Resistant<br />
Structures”, Tohoku University Press.<br />
<strong>Diaz</strong> M., <strong>Kusunoki</strong> K. <strong>and</strong> <strong>Tasai</strong> A. (2012). “Experimental Study on<br />
Residual Seismic Performance of Scaled Three-Story Steel<br />
Frames Tested on a Shaking Table.” Proceedings of<br />
International Symposium on Earthquake Engineering, 349-356.<br />
- 1210 -