Assessment of Water Quality in the Brokenhead River Watershed
Assessment of Water Quality in the Brokenhead River Watershed
Assessment of Water Quality in the Brokenhead River Watershed

You also want an ePaper? Increase the reach of your titles
YUMPU automatically turns print PDFs into web optimized ePapers that Google loves.
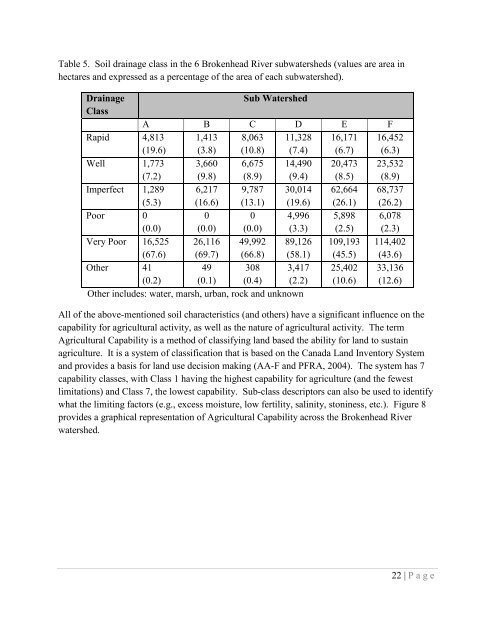
Table 5. Soil dra<strong>in</strong>age class <strong>in</strong> <strong>the</strong> 6 <strong>Brokenhead</strong> <strong>River</strong> subwatersheds (values are area <strong>in</strong><br />
hectares and expressed as a percentage <strong>of</strong> <strong>the</strong> area <strong>of</strong> each subwatershed).<br />
Dra<strong>in</strong>age<br />
Sub <strong>Water</strong>shed<br />
Class<br />
A B C D E F<br />
Rapid 4,813<br />
(19.6)<br />
1,413<br />
(3.8)<br />
8,063<br />
(10.8)<br />
11,328<br />
(7.4)<br />
16,171<br />
(6.7)<br />
16,452<br />
(6.3)<br />
Well 1,773<br />
(7.2)<br />
3,660<br />
(9.8)<br />
6,675<br />
(8.9)<br />
14,490<br />
(9.4)<br />
20,473<br />
(8.5)<br />
23,532<br />
(8.9)<br />
Imperfect 1,289<br />
(5.3)<br />
6,217<br />
(16.6)<br />
9,787<br />
(13.1)<br />
30,014<br />
(19.6)<br />
62,664<br />
(26.1)<br />
68,737<br />
(26.2)<br />
Poor 0<br />
(0.0)<br />
0<br />
(0.0)<br />
0<br />
(0.0)<br />
4,996<br />
(3.3)<br />
5,898<br />
(2.5)<br />
6,078<br />
(2.3)<br />
Very Poor 16,525<br />
(67.6)<br />
26,116<br />
(69.7)<br />
49,992<br />
(66.8)<br />
89,126<br />
(58.1)<br />
109,193<br />
(45.5)<br />
114,402<br />
(43.6)<br />
O<strong>the</strong>r 41<br />
(0.2)<br />
49<br />
(0.1)<br />
308<br />
(0.4)<br />
3,417<br />
(2.2)<br />
25,402<br />
(10.6)<br />
33,136<br />
(12.6)<br />
O<strong>the</strong>r <strong>in</strong>cludes: water, marsh, urban, rock and unknown<br />
All <strong>of</strong> <strong>the</strong> above-mentioned soil characteristics (and o<strong>the</strong>rs) have a significant <strong>in</strong>fluence on <strong>the</strong><br />
capability for agricultural activity, as well as <strong>the</strong> nature <strong>of</strong> agricultural activity. The term<br />
Agricultural Capability is a method <strong>of</strong> classify<strong>in</strong>g land based <strong>the</strong> ability for land to susta<strong>in</strong><br />
agriculture. It is a system <strong>of</strong> classification that is based on <strong>the</strong> Canada Land Inventory System<br />
and provides a basis for land use decision mak<strong>in</strong>g (AA-F and PFRA, 2004). The system has 7<br />
capability classes, with Class 1 hav<strong>in</strong>g <strong>the</strong> highest capability for agriculture (and <strong>the</strong> fewest<br />
limitations) and Class 7, <strong>the</strong> lowest capability. Sub-class descriptors can also be used to identify<br />
what <strong>the</strong> limit<strong>in</strong>g factors (e.g., excess moisture, low fertility, sal<strong>in</strong>ity, ston<strong>in</strong>ess, etc.). Figure 8<br />
provides a graphical representation <strong>of</strong> Agricultural Capability across <strong>the</strong> <strong>Brokenhead</strong> <strong>River</strong><br />
watershed.<br />
22 | P age