Assessment of Water Quality in the Brokenhead River Watershed
Assessment of Water Quality in the Brokenhead River Watershed
Assessment of Water Quality in the Brokenhead River Watershed

You also want an ePaper? Increase the reach of your titles
YUMPU automatically turns print PDFs into web optimized ePapers that Google loves.
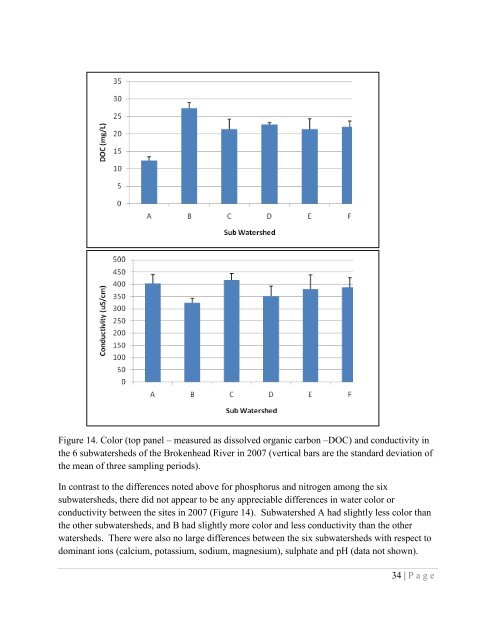
Figure 14. Color (top panel – measured as dissolved organic carbon –DOC) and conductivity <strong>in</strong><br />
<strong>the</strong> 6 subwatersheds <strong>of</strong> <strong>the</strong> <strong>Brokenhead</strong> <strong>River</strong> <strong>in</strong> 2007 (vertical bars are <strong>the</strong> standard deviation <strong>of</strong><br />
<strong>the</strong> mean <strong>of</strong> three sampl<strong>in</strong>g periods).<br />
In contrast to <strong>the</strong> differences noted above for phosphorus and nitrogen among <strong>the</strong> six<br />
subwatersheds, <strong>the</strong>re did not appear to be any appreciable differences <strong>in</strong> water color or<br />
conductivity between <strong>the</strong> sites <strong>in</strong> 2007 (Figure 14). Subwatershed A had slightly less color than<br />
<strong>the</strong> o<strong>the</strong>r subwatersheds, and B had slightly more color and less conductivity than <strong>the</strong> o<strong>the</strong>r<br />
watersheds. There were also no large differences between <strong>the</strong> six subwatersheds with respect to<br />
dom<strong>in</strong>ant ions (calcium, potassium, sodium, magnesium), sulphate and pH (data not shown).<br />
34 | P age