Market Analysis Tools and Services - UNCTAD Virtual Institute
Market Analysis Tools and Services - UNCTAD Virtual Institute
Market Analysis Tools and Services - UNCTAD Virtual Institute

You also want an ePaper? Increase the reach of your titles
YUMPU automatically turns print PDFs into web optimized ePapers that Google loves.
<strong>Market</strong> <strong>Analysis</strong> <strong>Tools</strong><br />
<strong>and</strong> <strong>Services</strong><br />
<strong>UNCTAD</strong> <strong>Virtual</strong> <strong>Institute</strong> Visit to ITC
<strong>Market</strong> <strong>Analysis</strong> <strong>and</strong> Research<br />
Enhancing Underst<strong>and</strong>ing of International Trade Opportunities <strong>and</strong><br />
Obstacles<br />
ITC’s <strong>Market</strong> <strong>Analysis</strong> <strong>and</strong> Research (MAR) section produces <strong>and</strong> disseminates online market analysis<br />
tools, conducts market research <strong>and</strong> trade analysis, <strong>and</strong> delivers capacity building programmes in market<br />
analysis for the business community, trade support institutions <strong>and</strong> policy makers in developing countries.<br />
MARKET ANALYSIS TOOLS<br />
Enhancing transparency with statistics on global trade, market access <strong>and</strong> Foreign Direct Investment<br />
(FDI)<br />
ITC has created for developing countries a range of market analysis tools – Trade Map, <strong>Market</strong> Access<br />
Map, Investment Map <strong>and</strong> Trade Competitiveness Map.<br />
Developing countries can use these tools to help grow their exports by identifying opportunities for<br />
product <strong>and</strong> market diversification. A wide range of navigation options, combined with a powerful set of<br />
analytical outputs – tables, maps <strong>and</strong> charts - make it easy to analyse trade-related information for sets of<br />
products, sectors or countries.<br />
Users in developing countries can benefit from FREE access to the tools thanks to financial<br />
contribution from donors to ITC’s Trust Fund. To get your free password, register at<br />
www.intracen.org/marketanalysis
INTERNATIONAL TRADE CENTRE<br />
Trade Map<br />
• Includes time series trade statistics (HS 2, 4 <strong>and</strong> 6-digit), market shares, trends, <strong>and</strong> other trade<br />
indicators for 220 countries <strong>and</strong> territories. More detailed statistics – at national tariff line level – are<br />
available for 120+ countries, <strong>and</strong> current monthly or quarterly data is included for more than 78 countries.<br />
<strong>Market</strong> Access Map<br />
• Includes customs tariffs (including tariff preferences) applied by 187 countries <strong>and</strong> faced by 239<br />
countries <strong>and</strong> territories; rules/certificates of origin; <strong>and</strong> bound tariffs of WTO members. Enables the<br />
aggregation of products <strong>and</strong> countries as well as simulation of tariff reduction scenarios. A new version<br />
will be launched in 2011 bringing together functionality of <strong>Market</strong> Access Map <strong>and</strong> the World Bank’s<br />
WITS.<br />
Investment Map<br />
• Includes statistics on FDI flows <strong>and</strong> stocks by country <strong>and</strong> industry (ISIC Rev. 3) for 100 countries,<br />
together with information on the operations of foreign affiliate companies active in developing countries.<br />
St<strong>and</strong>ards Map<br />
• Improves information transparency about voluntary sustainability st<strong>and</strong>ards, covering 30 st<strong>and</strong>ards<br />
<strong>and</strong> up to 60 product groups. The tool enables producers in developing countries, public procurement<br />
officials <strong>and</strong> SME procurers to better underst<strong>and</strong> the requirements, costs <strong>and</strong> benefits of st<strong>and</strong>ards<br />
including Fair Trade, Rainforest Alliance, IFOAM, <strong>and</strong> Global Gap among others.<br />
COUNTRY-LEVEL TRADE DIAGNOSTICS & CUSTOMIZED MARKET RESEARCH<br />
AND ANALYSIS<br />
ITC’s research <strong>and</strong> analysis helps trade policy makers allocate scarce resources towards sectors <strong>and</strong><br />
markets with greatest export potential. They also help in refining trade negotiation positions, modeling the<br />
impact of economic <strong>and</strong> trade trends <strong>and</strong> assessing the impact of trade agreements. Our analysts bring<br />
together the most current <strong>and</strong> detailed trade-related data with state-of-the-art analytical survey<br />
methodologies <strong>and</strong> models. Our core competencies include:<br />
• Assessment of Non-Tariff Measures (NTMs) as barriers to export, through comprehensive<br />
national surveys of enterprises <strong>and</strong> official NTM sources<br />
• Customized analysis <strong>and</strong> reports on other market access issues, including tariffs, <strong>and</strong><br />
support in preparing negotiation positions in multilateral or regional trade talks.<br />
• Assessments of export diversification opportunities by sector, country or region through<br />
detailed statistical analysis <strong>and</strong> qualitative research<br />
• Assessment of national trade competitiveness vis-à-vis benchmark countries<br />
CAPACITY BUILDING SERVICES<br />
Providing foundations for successful export strategies<br />
ITC’s <strong>Market</strong> <strong>Analysis</strong> <strong>and</strong> Research offers a wide range<br />
of capacity building activities for export oriented<br />
managers, trade support institutions <strong>and</strong> trade policy<br />
makers to support market analysis, one of the<br />
foundations of successful export strategies <strong>and</strong> trade<br />
policies.<br />
Workshops, seminars <strong>and</strong> mentoring activities take place<br />
in partner countries, in Geneva or by web conferencing<br />
(Webinar).
INTERNATIONAL TRADE CENTRE<br />
Capacity Building Workshops:<br />
• Introduction to Researching & Analysing Export <strong>Market</strong>s<br />
• Introduction to ITC’s <strong>Market</strong> <strong>Analysis</strong> <strong>Tools</strong><br />
• Analysing Export Opportunities for a Target <strong>Market</strong><br />
• Preparing a <strong>Market</strong> Profile<br />
• Mentoring on Export Potential Assessment<br />
• Advanced <strong>Market</strong> Access <strong>Analysis</strong><br />
• Analysing Voluntary Sustainability St<strong>and</strong>ards<br />
More in-depth capacity building programmes can also be customized to partners’ specific needs.<br />
PUBLICATION COLLABORATIONS:<br />
World Tariff Profiles – Published annually by ITC, WTO <strong>and</strong> <strong>UNCTAD</strong><br />
A 200-page comprehensive overview of bound <strong>and</strong> applied tariffs for WTO member countries <strong>and</strong> applied<br />
tariffs for non-WTO members.<br />
MAR also contributes to:<br />
World Trade Indicators - a World Bank publication<br />
The Global Enabling Trade Report - a World Economic Forum publication<br />
The Global Trade <strong>Analysis</strong> Project (GTAP): data <strong>and</strong> aggregations<br />
For more information about any of our activities – including costs where relevant, please contact:<br />
marketanalysis@intracen.org or visit www.intracen.org/marketanalysis
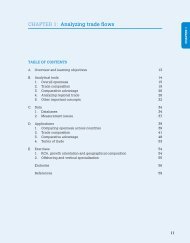
Introduction<br />
ITC's <strong>Market</strong> <strong>Analysis</strong> <strong>Tools</strong> <strong>and</strong> trade<br />
analysis<br />
What is ITC<br />
The UN body for design of policy<br />
recommendations to achieve<br />
economic <strong>and</strong> social development<br />
through trade <strong>and</strong> investment.<br />
The forum to negotiate multilateral<br />
trade rules, monitor their<br />
implementation <strong>and</strong> h<strong>and</strong>le trade<br />
disputes<br />
ITC works with local <strong>and</strong> regional<br />
institutions <strong>and</strong> businesspeople to<br />
promote exports <strong>and</strong> trade.<br />
• Mission<br />
ITC enables small business export success in developing<br />
countries by providing, with partners, trade development<br />
solutions to the private sector, trade support institutions<br />
<strong>and</strong> policy-makers
ITC activities<br />
Activities<br />
ITC Clients<br />
ITC Beneficiaries<br />
ITC Development<br />
Outcomes<br />
Business <strong>and</strong> Trade Policy<br />
Export Strategy<br />
Trade Intelligence<br />
Trade Support Institution<br />
Exporter Competitiveness<br />
Policy<br />
Makers<br />
Trade<br />
Support<br />
Institutions<br />
Business<br />
Community<br />
Micro,<br />
Small <strong>and</strong><br />
Medium-Sized<br />
Exporters<br />
Export Impact for Good<br />
Generating sustainable<br />
incomes <strong>and</strong> livelihoods<br />
especially for poor<br />
households, by connecting<br />
enterprises to global markets<br />
One One Many<br />
ITC organisational chart
MAR activities<br />
I. <strong>Market</strong> <strong>Analysis</strong> <strong>Tools</strong><br />
Trade Map<br />
<strong>Market</strong> Access Map<br />
II. Tailored <strong>Analysis</strong><br />
Trade Competitiveness<br />
Assessment<br />
Export Potential Assessment<br />
III. Capacity Building <strong>and</strong><br />
Training<br />
Introduction to <strong>Market</strong> <strong>Analysis</strong><br />
Preparation of <strong>Market</strong> Profiles<br />
Investment Map<br />
Trade Competitiveness Map<br />
Export Opportunity Scan<br />
Sector Competitiveness Scan<br />
Customised analyses<br />
Training–of–Trainers<br />
Mentoring for Tailored<br />
Analyses<br />
Face-to-face <strong>and</strong> E-training<br />
Customised training<br />
Workshop objectives<br />
• Underst<strong>and</strong> some of the main trends in the current global trade<br />
environment<br />
• Introduce ITC's <strong>Market</strong> <strong>Analysis</strong> <strong>Tools</strong> <strong>and</strong> become<br />
knowledgeable in their use<br />
• Gain an insight into how these tools can facilitate trade analysis
Some trends...<br />
...of the current trading environment<br />
Trade is enormous...<br />
$12,650,000,000,000<br />
or $401,128 per second<br />
• Globalization has accelerated over the last 20 years<br />
• The volume of trade as a percentage of global GDP has more<br />
than doubled since 1960
...<strong>and</strong> it's more dynamic than the economy...<br />
13%<br />
World Trade vs. GDP Growth<br />
1960-2009<br />
11%<br />
9%<br />
GDP<br />
Trade<br />
7%<br />
5%<br />
3%<br />
1%<br />
-1%<br />
1960-<br />
70<br />
1970-<br />
80<br />
1980-<br />
90<br />
1991-<br />
94<br />
1995-<br />
98<br />
1999 2000 2001 2002 2003 2004 2005 2006 2007 2008 2009<br />
Source: WTO<br />
... but it's not immune to the downturn...<br />
Annual Growth of Imports by Level of Development of Countries<br />
2002-2007<br />
Source: ITC Trade Map
...although downturn is not uniform...<br />
GDP <strong>and</strong> merch<strong>and</strong>ise trade by region, 2005-07<br />
Annual % change at constant prices<br />
Source: WTO<br />
... TRADE GREW STEADILY THIS DECADE<br />
UNTIL 2008<br />
Growth of trade volumes<br />
Annual % change<br />
Source: World Bank, Global Economic Prospects 2009
Global trade patterns are changing...<br />
• Trade flows within regions account for a higher share of world<br />
trade than flows between regions<br />
• Asia Pacific & EU trade more within their regions<br />
• However many regions trade more with other regions than<br />
internally: Africa, South <strong>and</strong> Central America, Middle East <strong>and</strong><br />
CIS<br />
...with developing countries gaining ground...<br />
Share in total world exports, percentages<br />
Developing countries LDCs Developed countries<br />
80%<br />
70%<br />
60%<br />
50%<br />
40%<br />
30%<br />
20%<br />
10%<br />
0%<br />
1991 1992 1993 1994 1995 1996 1997 1998 1999 2000 2001 2002 2003 2004 2005 2006 2007 2008<br />
Source: ITC<br />
LDC list comes from UN. Developed countries are current OECD countries less Chile, Korea, Mexico <strong>and</strong> Turkey. The<br />
remainder are developing. Graph is based on data reported by 198 countries <strong>and</strong> territories. The composition of groups can<br />
vary slightly depending on the data availability
…<strong>and</strong> increasingly trade with other<br />
developing countries…<br />
50%<br />
40%<br />
30%<br />
20%<br />
10%<br />
0%<br />
33% 35% 39% 43%<br />
16%<br />
18%<br />
19% 22%<br />
2002<br />
2005<br />
2008<br />
2009<br />
Share of Developing<br />
Countries exports that are<br />
exported to China, Hong<br />
Kong, Chinese Taipei <strong>and</strong><br />
India<br />
Share of developing countries<br />
exports that are exported to<br />
other developing countries<br />
50%<br />
40%<br />
30%<br />
20%<br />
15%<br />
28%<br />
44% 47%<br />
34%<br />
24% 30%<br />
32%<br />
Share of exports of Least<br />
Developed Countries that go<br />
to China, Hong Kong,<br />
Chinese Taipei <strong>and</strong> India<br />
10%<br />
0%<br />
2002<br />
2005<br />
2008<br />
2009<br />
Share of exports of Least<br />
Developed Countries that go<br />
to Developing countries<br />
The mix of products traded is changing...<br />
Global trade by type of commodity<br />
% of total trade<br />
Source: ITC Trade Map
…partly due to commodities prices…<br />
Real prices of internationally traded commodity prices in developing countries<br />
CPI-deflated Indices, Jan. 2000=100<br />
Energy<br />
Food<br />
Metals <strong>and</strong><br />
minerals<br />
Source:World Bank, Global Economic Prospects 2009<br />
... but not all sectors are equally successful<br />
The best performing exports from developing country exporters tend to be manufactured<br />
products, with high value-addition<br />
Top export industries for highperformance<br />
developing countries<br />
(but not from struggling developing countries)<br />
Electrical, electronic equipment<br />
Top export industries for struggling<br />
developing countries<br />
(but not from struggling developing countries)<br />
Cotton<br />
Machinery, boilers, etc.<br />
Precision instruments<br />
Plastics <strong>and</strong> articles thereof<br />
Organic chemicals<br />
Articles of iron <strong>and</strong> steel<br />
Copper <strong>and</strong> articles thereof<br />
Furniture, lighting, prefab buildings<br />
Toys, games, sports requisites<br />
Ships, boats<br />
Footwear, gaiters, parts thereof<br />
Wood <strong>and</strong> art of wood, wood charcoal<br />
Other made textile articles, worn clothing<br />
Fish, crustaceans, mulluscs<br />
Edible vegetables, roots & tubers<br />
Edible fruits, nuts, melons<br />
Raw hides, skins, leather<br />
Cereals<br />
Cocoa & cocoa preparations<br />
Coffee, tea, mate <strong>and</strong> spices<br />
Nickel <strong>and</strong> articles thereof
<strong>Market</strong> access issues are changing:<br />
• Trade agreements proliferate...<br />
Number of Free Trade Agreements Notified to WTO<br />
1958 – 2009<br />
Source: WTO<br />
… reducing tariffs…<br />
Applied MFN Tariffs, All Products, By Level of Income<br />
Source: World Trade Indicators, World Bank
1975<br />
1977<br />
1979<br />
1981<br />
1983<br />
1985<br />
1987<br />
1989<br />
1991<br />
1993<br />
1995<br />
1997<br />
1999<br />
2001<br />
2003<br />
2005<br />
2007<br />
… <strong>and</strong> making NTMs more important<br />
Unprompted, Combined Mentions in ITC 2008 client survey<br />
2009 Survey– NTMs still an<br />
issue for exporters but<br />
overshadowed by the<br />
economic crisis – finance<br />
<strong>and</strong> fall in dem<strong>and</strong><br />
Trade in services grows quickly...<br />
12<br />
Trade in <strong>Services</strong> as % of GDP<br />
1975 – 2007<br />
11<br />
10<br />
9<br />
8<br />
7<br />
6<br />
Source: World Development Indicators, World Bank
...significantly due to FDI...<br />
• In spite of quick growth in value, over the past 30 years the<br />
share of services, excluding Mode 3: commercial presence, in<br />
global trade has been quite stable around 20%<br />
• BUT, Mode 3 is not captured in trade in services statistics<br />
• FDI data shows that more than half of FDI flows are in the<br />
services sector<br />
• FDI keeps on growing globally...<br />
…which is ever more important<br />
FDI as % of World GDP<br />
1985 – 2007<br />
Source: World Development Indicators, World Bank
Business environment affects trade<br />
Source: World Trade Indicators 2008, World Bank<br />
Register to access ITC’s<br />
<strong>Market</strong> <strong>Analysis</strong> <strong>Tools</strong>
Free to users from developing countries<br />
Thanks to financial contributions from ITC's Global Trust Fund <strong>and</strong> the<br />
World Bank, as of the 1st January 2008, all users from developing<br />
countries <strong>and</strong> territories may access ITC's market analysis tools free<br />
of charge.<br />
http://www.intracen.org/marketanalysis
Free to users from developing countries<br />
Coming soon – New MAcMap
Trade Map<br />
Trade statistics for international business development<br />
Trade Map - www.trademap.org - is an interactive online database on international trade statistics <strong>and</strong><br />
presents indicators on export performance, international dem<strong>and</strong>, alternative markets <strong>and</strong> the role of<br />
competitors from both the product <strong>and</strong> country perspective.<br />
Trade Map covers the annual trade flows (mirror <strong>and</strong> direct) of over 220 countries <strong>and</strong> territories <strong>and</strong><br />
5,300 products defined at the 2, 4 or 6-digit level of the Harmonized System with different trade indicators<br />
(indices, values, quantities, trends, market share <strong>and</strong> unit values) <strong>and</strong> times series since 2001 displayed<br />
in graphic, map or tabular format. Trade values can be selected from 16 different currencies. 2010<br />
monthly trade statistics for over 80 countries are updated on a constant basis as well as 2010 first <strong>and</strong><br />
second quarter data are available for more than 60 countries.<br />
Trade Map's features include:<br />
• <strong>Analysis</strong> of present export markets: Examine the profile <strong>and</strong> dynamics of export markets for any<br />
product, assess the value, size <strong>and</strong> concentration of exports <strong>and</strong> highlight countries where market shares<br />
have increased.<br />
• Pre-selection of priority markets: View the world’s major importing countries, illustrate the extent<br />
of import concentration <strong>and</strong> in which countries dem<strong>and</strong> has increased over the past five years.<br />
• Overview of competitors in global <strong>and</strong> specific markets: Identify the leading exporting countries<br />
for a given product; highlight a country’s position in world exports or in the imports of partner <strong>and</strong><br />
neighbouring countries.<br />
• Review of opportunities for product diversification in a specific market: Make a comparative<br />
assessment of import dem<strong>and</strong> for related products in an export market; identify imports of similar<br />
products <strong>and</strong> possible synergies.<br />
• Visualisation of trends <strong>and</strong> seasonality: display the monthly data on graphs <strong>and</strong> identify slopes<br />
<strong>and</strong> regular peaks in values as well as in quantities <strong>and</strong> in unit values.<br />
• Identification of existing <strong>and</strong> potential bilateral trade with any partner country: Identify productspecific<br />
opportunities by comparing actual bilateral trade, the total import dem<strong>and</strong> of partner countries<br />
<strong>and</strong> the overall export supply capacity of the home country.<br />
• Data export: convert all what you get from Trade Map into a file; download not only trade data as<br />
Excel or text files but also graphs as images.<br />
• Information on tariffs: View information on tariff equivalent ad valorem faced by countries in their<br />
exportations or applied by importing countries.<br />
Thanks to financial contributions from ITC's Global Trust Fund <strong>and</strong> the World Bank, users in developing<br />
countries <strong>and</strong> territories can register at www.intracen.org/marketanalysis to access ITC’s market<br />
analysis tools free of charge. Users in developed countries <strong>and</strong> territories can register to get a one-week<br />
free trial access or subscribe for a longer access.<br />
The <strong>Market</strong> <strong>Analysis</strong> <strong>and</strong> Research Section of ITC also conducts tailored studies <strong>and</strong> training<br />
programmes on market analysis. Please visit our website for more information:<br />
www.intracen.org/marketanalysis
INTERNATIONAL TRADE CENTRE<br />
See below, some examples of tables <strong>and</strong> graphs generated by Trade Map
Trade Map<br />
A web-based trade flow analysis tool<br />
Introduction<br />
• An exporter of pineapples is looking to diversify its client<br />
base…Which country should be targeted<br />
• A shoe exporter needs an overview of trade barriers he/she<br />
would face for exports to Malaysia…<br />
• A trade mission needs to know our top export products to<br />
Germany…<br />
• Where could you import automotive components from<br />
Who are the largest suppliers in your region<br />
• What is the current trade between your country <strong>and</strong> the United<br />
States<br />
Initial answers to these questions <strong>and</strong> many<br />
more are easily found in Trade Map
Trade Map<br />
• Online application to produce reports on international trade<br />
flows<br />
• Every product (HS-6) to <strong>and</strong> from (almost) every country<br />
• Based on probably the largest trade flow database in the<br />
world<br />
• User-friendly interface, report-ready outputs<br />
• Flexibility for customising reports, analysis<br />
• Graphic presentation of outputs to facilitate analysis<br />
Key characteristics<br />
• Where does the data come from<br />
• National Authorities<br />
• COMTRADE, produced by the United Nations Statistics Division database<br />
• What is Trade Map’s geographical coverage<br />
• Information for over 220 countries <strong>and</strong> territories using data reported by 170<br />
countries <strong>and</strong> territories (not all have reported each year)<br />
• Data for non-reporting countries is derived from mirror statistics<br />
• What is Trade Map’s product coverage<br />
• For the Harmonized System<br />
• over 5,300 products at the 6 digit level<br />
• For the National Tariff Line<br />
• up to 30,000 products for 150 countries (~85% of world trade)<br />
• What is Trade Map’s time horizon<br />
• Yearly, quarterly <strong>and</strong> monthly data
Data classification<br />
• The Harmonized System (HS)<br />
• Is used as a basis for the collection of Custom duties <strong>and</strong><br />
international trade statistics by almost all countries, representing<br />
about 98% of world trade<br />
• Developed by the World Customs Organisation – WCO<br />
(www.wcoomd.org)<br />
• Implemented late 1980s.<br />
• Harmonised different existing nomenclatures<br />
• Adopted by almost all countries in the world<br />
• Basis for all trade conversations internationally<br />
• Revisions in 1996, 2002 <strong>and</strong> 2007<br />
Data classification<br />
• The Harmonized System (HS)<br />
• Is a numerical classification system of<br />
products used as a basis for international<br />
trade statistics by almost all countries.<br />
• Is harmonized up to six digits (HS-6) - You<br />
can compare HS data between countries.<br />
• Is broken down into 3 clusters:<br />
• HS-2: the chapter of the good (sector)<br />
• E.g. 09 = Coffee, Tea, Mate <strong>and</strong> Spices<br />
• HS-4: groupings within the chapter (sub-sector)<br />
• E.g. 0902 = Tea, whether or not flavoured<br />
• HS-6: product(s) within the grouping (product<br />
level)<br />
• E.g. 090210 = Green tea (not fermented)<br />
HS-2<br />
HS-4<br />
HS-6
Data classification<br />
• National Tariff Lines (NTL) codes<br />
• Classification of goods after the 6 digit level of<br />
the Harmonized System classification.<br />
• National Tariff Lines go from 8 digits to 12<br />
digits.<br />
• Why use the HS <strong>and</strong> NTL classification<br />
• The HS classification is st<strong>and</strong>ardised<br />
internationally<br />
• The NTL classification is not st<strong>and</strong>ardised<br />
internationally.<br />
Each country decides its own further<br />
classification after the Harmonized System.<br />
Hence, National Tariff Line codes can be<br />
different from a country to another.<br />
HS-2<br />
HS-4<br />
HS-6<br />
NTL<br />
Data classification<br />
HS<br />
(Internationa<br />
l st<strong>and</strong>ard)<br />
08 Edible fruit <strong>and</strong> nuts; peel of citrus fruit or melons.<br />
08.04 Dates, figs, pineapples, avocados, guavas,<br />
mangoes <strong>and</strong> mangosteens, fresh or dried.<br />
08.04.50 Guavas, mangoes <strong>and</strong> mangosteens.<br />
NTL<br />
(NON<br />
st<strong>and</strong>ard)<br />
Australia<br />
08.04.50.00 Fresh or dried guavas, mangoes <strong>and</strong> mangosteens<br />
Japan<br />
08.04.50.01.1 Mangoes, fresh<br />
08.04.50.01.9 Guavas <strong>and</strong> mangosteens, fresh<br />
United States:<br />
08.04.50.40.40 Mangoes, fresh, if entered during the period from<br />
September 1, in any year, to the following May 31,<br />
inclusive<br />
08.04.50.60.80 Guavas <strong>and</strong> mangosteens, fresh, if entered during the<br />
period from June 1 to August 31, of the following year,<br />
inclusive<br />
08.04.50.80.00 Guavas, mangoes <strong>and</strong> mangosteens, dried
Free to users from developing countries<br />
Thanks to financial contributions from ITC's Global Trust Fund<br />
<strong>and</strong> the World Bank, as of the 1st January 2008, all users from<br />
developing countries <strong>and</strong> territories may access ITC's market<br />
analysis tools free of charge.<br />
http://www.intracen.org/marketanalysis
Free to users from developing countries<br />
Trade Map selection menu
Trade Map selection menu<br />
Direction of flow<br />
Product<br />
selection<br />
Country/Region<br />
selection<br />
Partner country<br />
selection<br />
Data visualisation<br />
Advanced search<br />
This is the option to use if you haven't<br />
found the product code for your<br />
product<br />
Three options to<br />
search for product<br />
codes
Advanced search<br />
"Search by<br />
Hierarchy"<br />
allows you to<br />
display the<br />
entire HS<br />
system up to<br />
the HS6 level<br />
<strong>and</strong> to identify<br />
the specific<br />
description of<br />
each code<br />
Managing groups<br />
Create your own product or<br />
country groups to suit your<br />
needs
Select product <strong>and</strong>/or market<br />
Two options:<br />
1. Type in the product<br />
code<br />
2. Type in first letters of<br />
keyword<br />
Then select code to analyse<br />
Select product <strong>and</strong>/or market<br />
Bear in mind:<br />
No country/product selection<br />
means ALL<br />
countries/products selected<br />
Click here to get trade<br />
indicators that facilitate<br />
analysis
World dem<strong>and</strong> for pineapples<br />
Always read title<br />
of the table first!!<br />
World dem<strong>and</strong> for pineapples<br />
Situation<br />
Trends<br />
Structure
World dem<strong>and</strong> for pineapples<br />
Countries<br />
Value of<br />
imports, in<br />
thous<strong>and</strong>s of<br />
US Dollars, in<br />
the last<br />
available year<br />
Trade<br />
balance=<br />
exports –<br />
imports<br />
Quantity<br />
imported in the<br />
last available<br />
year<br />
Quantity unit,<br />
depends on type of<br />
good<br />
Unit Value=<br />
Value/Quantity;<br />
provides an<br />
indication of average<br />
value of one unit of<br />
the product; NOT<br />
actual price of the<br />
product<br />
World dem<strong>and</strong> for pineapples<br />
Average annual<br />
growth of the imported<br />
value over the past 5<br />
years<br />
Average annual<br />
growth of the imported<br />
quantity over the past<br />
5 years<br />
Growth rate of<br />
the imported<br />
value over the<br />
past year
World dem<strong>and</strong> for pineapples<br />
Share of world maket held by each<br />
country. Shows how concentrated<br />
the world supply is.<br />
World dem<strong>and</strong> for pineapples<br />
Chose a target market<br />
based on different criteria<br />
(size, dynamism,<br />
proximity, etc.)
Assess performance in market<br />
Assess performance in market<br />
Situation in<br />
target market<br />
Trends in<br />
target market<br />
Performance of<br />
partner countries
Assess performance in market<br />
Competitors in the target market<br />
Assess performance in market<br />
Selecting National<br />
Tariff Line level...<br />
... automatically changes the output format to time series
Assess performance in market<br />
Alternatives for displaying data<br />
Assess performance in market - NTL<br />
NTL codes under the HS6 code provide<br />
first glimpse at market segmentation <strong>and</strong><br />
consumer preferences
Assess performance in market - NTL<br />
Competitors<br />
currently in<br />
this market<br />
Global<br />
competitors<br />
NOT present<br />
in this market<br />
Analyse time series
Analyse time series<br />
Identify <strong>and</strong> underst<strong>and</strong> seasonality<br />
through quarterly <strong>and</strong>/or monthly data<br />
Analyse time series in graphic format<br />
Seasonality!
Graphic analysis<br />
Graphic analysis
Graphic analysis<br />
Graphic analysis<br />
Japan losing importance as a<br />
market for partner country<br />
Japan gaining importance as a<br />
market for partner country
Graphic analysis<br />
Who are alternative suppliers<br />
that Japan could source from<br />
Analyse potential for bilateral trade<br />
Select your<br />
countries/regions
Analyse potential for bilateral trade<br />
Initial approach at the HS-2 level<br />
Analyse potential for bilateral trade<br />
Brazil's imports from Malaysia –<br />
Existing dem<strong>and</strong> in Brazil for<br />
products coming from Malaysia
Analyse potential for bilateral trade<br />
Malaysia's exports to the world<br />
– Existing supply potential from<br />
Malaysia<br />
Analyse potential for bilateral trade<br />
Malaysia's exports to the world –<br />
Countries currently importing<br />
Malaysia's products
Analyse potential for bilateral trade<br />
Brazil's imports from the world –<br />
existing dem<strong>and</strong> in Brazil for<br />
products that could potentially<br />
be sourced from Malaysia<br />
Analyse potential for bilateral trade<br />
Brazil's imports from the world –<br />
countries which Brazil is<br />
currently buying from
Analyse potential for bilateral trade<br />
Refine analysis at HS6 level<br />
Analyse potential for bilateral trade<br />
Further refine analysis at NTL level –<br />
for base country only, obviously
Trade Map Graphs<br />
Bubble Charts:<br />
Positioning products according to growth<br />
rates <strong>and</strong> changes in market share<br />
Boston Consulting model or matrix<br />
Portfolio model of product selection based on stage in life cycle<br />
High<br />
Babies<br />
Stars<br />
<strong>Market</strong><br />
Growth<br />
Product Life Cycle<br />
Dogs<br />
Cash cows<br />
Low<br />
Low<br />
Relative <strong>Market</strong> Share<br />
High
Boston Consulting model or matrix<br />
Bubble size is proportional to sales of product<br />
High<br />
Farm-direct Organic coffee<br />
<strong>Market</strong><br />
Growth<br />
Babies<br />
Specialty coffee<br />
Stars<br />
Dogs<br />
Cash cows<br />
Low<br />
Low<br />
Relative <strong>Market</strong> Share<br />
Instant coffee<br />
High<br />
Bubble graphs in Trade Map<br />
• Same logic applies, but adapted to specific needs:<br />
• Instead of products, HS codes (2, 4, 6 digits) or<br />
countries.<br />
• Adapted to each analytical need:<br />
• National supply vs. international dem<strong>and</strong><br />
• National supply vs. international dem<strong>and</strong> growth<br />
• Export performance relative to market dem<strong>and</strong><br />
• Prospects for market diversification
National supply vs. world dem<strong>and</strong><br />
National supply vs. world dem<strong>and</strong>
Prospects for market diversification<br />
Growth in dem<strong>and</strong> for a local product
TradeMap helps users…<br />
• Search for new markets or suppliers<br />
• Assess competition or diversify sources<br />
• Benchmark their trade performance<br />
• Set priority products for trade promotion <strong>and</strong> development<br />
• Evaluate tariffs <strong>and</strong> trade barriers<br />
• Assess product diversification potential with a partner<br />
country
<strong>Market</strong> Access Map<br />
Making market access barriers transparent<br />
<strong>Market</strong> Access Map is an interactive web-based analysis tool containing information on customs<br />
tariffs <strong>and</strong> other market access measures applied by 187 importing countries to the products<br />
exported by more than 239 countries <strong>and</strong> territories.<br />
<strong>Market</strong> Access Map aims to enhance market transparency, to support international trade<br />
promotion, <strong>and</strong> to facilitate the analysis of trade-related policy issues. It has been designed to<br />
support exporters, importers, trade promoters, policy analysts <strong>and</strong> trade negotiators. It allows users<br />
to analyze market access measures by geographic <strong>and</strong>/or sectoral aggregation. It also offers the<br />
possibility of simulating tariff reductions applying various negotiation formulae.<br />
The strengths of <strong>Market</strong> Access Map lie in its wide geographic coverage, taking into account<br />
almost all regional <strong>and</strong> bilateral trade agreements, <strong>and</strong> in its rapid updating. 2009 data are<br />
available for over 120 countries <strong>and</strong> 2008 data are available for 30 countries in total. The tool<br />
provides ad valorem equivalents for bound tariffs <strong>and</strong> applied tariffs so to allow tariff comparison<br />
across countries. Moreover the tool covers information on rules of origin for 80% of trade<br />
arrangements currently in-force in the world.<br />
<strong>Market</strong> Access Map includes:<br />
• Applied <strong>and</strong> bound tariffs;<br />
• Ad valorem equivalents (AVEs) for all specific tariffs;<br />
• Tariff quotas;<br />
• Anti-dumping duties <strong>and</strong> other trade remedies;<br />
• Certificates <strong>and</strong> rules of origin.<br />
<strong>Market</strong> Access Map can help you to:<br />
• Identify a tariff applied by any country to a product originating from a particular<br />
country.<br />
• Compare the tariff treatment of products exported by your country with the market<br />
access conditions faced by your competitors in your target markets.<br />
• Obtain by a single click all relevant material on rules of origin.<br />
Or you can use its advanced features for the following analysis:<br />
Coming Soon:<br />
• Tariff aggregation at any sectoral <strong>and</strong> regional level<br />
• Tariff reduction simulations, using various formulae<br />
In 2011 <strong>Market</strong> Access Map will be replaced by a new integrated application offering comprehensive<br />
solution for analysing market access measures worldwide, including tariffs, non-tariff measures<br />
(compulsory regulations) <strong>and</strong> trade data. It is developed using advanced technologies, <strong>and</strong> is based<br />
on broader set of databases. The application will include the enhanced version of all existing <strong>Market</strong><br />
Access Map functionalities, <strong>and</strong> additional features. The new application is currently being developed<br />
by ITC, <strong>UNCTAD</strong> <strong>and</strong> the World Bank in close collaboration with the WTO <strong>and</strong> UNSD.<br />
Thanks to financial contributions from ITC's Global Trust Fund <strong>and</strong> the World Bank, users in<br />
developing countries <strong>and</strong> territories can register at www.intracen.org/marketanalysis to access<br />
ITC’s market analysis tools free of charge. Users in developed countries <strong>and</strong> territories can<br />
register to get a one-week free trial access or subscribe for a longer access.
INTERNATIONAL TRADE CENTRE<br />
Tariff applied by France to (HS-030613) Shrimps <strong>and</strong> prawns, frozen, in shell or not,<br />
including boiled in shell originating from Ecuador<br />
Trade Regimes applied by France to Ecuador<br />
World Map of Tariffs faced by Ecuador to export (HS-030613) Shrimps <strong>and</strong> prawns, frozen,<br />
in shell or not, including boiled in shell
<strong>Market</strong> Access Map<br />
Information on tariffs <strong>and</strong> other<br />
market access conditions<br />
<strong>Market</strong> Access<br />
• Information on market access conditions allows<br />
companies to:<br />
• Evaluate the market access advantage of an exported<br />
product in a particular market relative to suppliers from other<br />
countries who face different tariff conditions<br />
• Select export markets offering favourable tariff conditions<br />
• Adapt, where necessary, the product to conform to the target<br />
market‟s import regulations<br />
• As an importer, identify country sources of supply that face<br />
preferential market access to minimise the cost of inputs
Types of tariffs<br />
• Ad valorem tariffs<br />
• Specific tariffs<br />
• Compound tariffs<br />
• Mixed tariffs<br />
• Variable tariffs<br />
Types of tariffs<br />
• Ad valorem tariffs:<br />
• Levied on the basis of the value<br />
• Used by most countries; more than 87% of tariffs worldwide are ad<br />
valorem<br />
• Specific tariffs<br />
• Compound tariffs<br />
• Mixed tariffs<br />
• Variable tariffs
Ad valorem tariffs<br />
E.g. Australian tariff of 5% on imported wine (22.04.21.20.70)<br />
French wine:<br />
• AUD 8 / litre<br />
New Zeal<strong>and</strong> wine:<br />
• AUD 6 / litre<br />
Tariff per unit = CIF value per unit<br />
x Tariff Rate<br />
Tariff paid:<br />
AUD 0.40 /litre<br />
Tariff paid:<br />
AUD 0.30 /litre<br />
Types of tariffs<br />
• Ad valorem tariffs<br />
• Specific tariffs:<br />
• Levied on the basis of volume, weight or other unit<br />
• Users of specific tariffs include (% of MFN tariff lines): Switzerl<strong>and</strong> (79.8%),<br />
Thail<strong>and</strong> (21.9%), Russia (12.2%), Argentina (12.1%), Belarus (11.9%), USA (8.2%),<br />
EU (4.6%)<br />
• Compound tariffs<br />
• Mixed tariffs<br />
• Variable tariffs
Specific tariffs change relative prices<br />
E.g. Suppose Switzerl<strong>and</strong>'s tariff on beef is CHF18 / kilo (02.01.30)<br />
Before border<br />
The prime beef is 4<br />
times the price of the<br />
low quality beef, but<br />
also 4 times the quality<br />
CHF3 / kg beef<br />
CHF12 / kg<br />
Argentine<br />
prime<br />
quality beef<br />
At border<br />
CHF18<br />
specific<br />
tariff<br />
per kilo<br />
After the border<br />
The prime beef is now only<br />
1.4 times the price of the low<br />
quality beef, but still 4 times<br />
the quality<br />
= 18/3 equates<br />
to a 600% ad<br />
valorem tariff<br />
Now<br />
Regular beef<br />
Costs<br />
CHF21 / kg<br />
= 18/12 equates to a<br />
150% ad valorem tariff<br />
Now<br />
Argentine<br />
prime beef<br />
Costs<br />
CHF30 / kg<br />
Types of tariffs<br />
• Ad valorem tariffs<br />
• Specific tariffs<br />
• Compound tariffs:<br />
• Contain both ad valorem <strong>and</strong> specific rates<br />
• Eg: 10% of the value + $2 per kilogram (Japan, EU, Canada)<br />
• Mixed tariffs<br />
• Variable tariffs
Compound tariffs<br />
E.g. USA tariff on chocolate of 4.3% + US$ 528 / ton (18.06.32.08)<br />
• Chocolate from Switzerl<strong>and</strong>: US$ 6,356 / ton<br />
Tariff:<br />
4.3% US$ 273 Tariff<br />
+ US$ 528/ton + US$ 528 Tariff<br />
• Chocolate from Brazil: US$ 3,181 / ton<br />
Tariff:<br />
4.3% US$ 137 Tariff<br />
+ US$ 528/ton + US$ 528 Tariff<br />
Tariff = US$ 801<br />
AVE = 801/ 6356 =13%<br />
Tariff = US$ 665<br />
AVE = 665/ 3181 = 21%<br />
Types of tariffs<br />
• Ad valorem tariffs<br />
• Specific tariffs<br />
• Compound tariffs<br />
• Mixed tariffs:<br />
• Minimum or maximum of two kinds of tariffs<br />
• Eg: Min or Max (10%, $2/kg) (Canada, EU, Japan)<br />
• Variable tariffs
Mixed tariffs<br />
e.g. Japanese tariff on shoes: Max. of 30% or JPY4,300 Yen / pair<br />
• Manolo Blahnik shoes: US$ 1,000 /pair<br />
Tariff: the maximum of<br />
30% US$ 300 Tariff<br />
Or JPY4,300/pair (US$ 36)<br />
US$ 36 Tariff<br />
• Clark's shoes: US$ 30 /pair<br />
Tariff: the maximum of<br />
30% US$ 9 Tariff<br />
Or JPY4,300/pair (US$ 36)<br />
US$ 36 Tariff<br />
Tariff = US$ 300<br />
AVE= 300/1000 = 30%<br />
Tariff = USD36<br />
AVE= 36/30 =120%<br />
Types of tariffs<br />
• Ad valorem tariffs<br />
• Specific tariffs<br />
• Compound tariffs<br />
• Mixed tariffs<br />
• Variable tariffs:<br />
• Levied on the basis of the composition of the products<br />
• Eg: US$ 5/unit if lead content of paint > 2% on toys<br />
• US$ 200/unit on fridges if cooling system is not CFC-free
Tariff quotas<br />
• A two tiered tariff. A lower in-quota tariff is applied to the first Q<br />
units of imports <strong>and</strong> a higher over-quota tariff is applied to all<br />
subsequent imports.<br />
MAcMap includes ad valorem equivalents<br />
• Ad Valorem Equivalents – AVE:<br />
• Are a common measure of the effect of the different types of tariff on the<br />
product, as if they were all ad valorem.<br />
• Are calculated for specific, mixed, compound or variable tariffs<br />
• Are calculated by:<br />
AVE =<br />
Specific Tariff per Unit<br />
Value of the Product per Unit<br />
• Allow for regional or sectoral tariffs to be added <strong>and</strong> compared<br />
• Allow for comparison of effective levels of protection across countries.<br />
• The total AVE is the sum of all individual ad valorem equivalents
Methodologies for Calculating AVEs<br />
• There are many methodologies for calculating AVEs. The most important<br />
difference is the way the Unit value is calculated.<br />
• The unit value of a product is based on total value of imports of the product<br />
divided by the quantity. One can use the value / quantity of bilateral trade<br />
flows, world imports or a country‟s imports of the product from a reference<br />
group of products<br />
Unit Value =<br />
value of imports<br />
quantity of imports<br />
Methodologies for Calculating AVEs<br />
• Unit values in MAcMap are calculated on a bilateral basis <strong>and</strong> at the most<br />
detailed product level - the national tariff line (where possible). The Specific<br />
tariff per unit is then divided by the bilateral unit value.<br />
• This is important because the value of a product can vary widely depending<br />
on the supplying country. For specific tariffs, the lower the unit value, the<br />
higher the effect in ad valorem terms of a specific tariff.
1958<br />
1960<br />
1962<br />
1964<br />
1966<br />
1968<br />
1970<br />
1972<br />
1974<br />
1976<br />
1978<br />
1980<br />
1982<br />
1984<br />
1986<br />
1988<br />
1990<br />
1992<br />
1994<br />
1996<br />
1998<br />
2000<br />
2002<br />
2004<br />
2006<br />
2008<br />
Common types of trade agreements<br />
• Partial Scope Agreement: reduces trade restrictions between partner<br />
countries for a few products<br />
• Free Trade Zone/Agreement/Area: eliminates trade barriers within the zone<br />
(FTA, RTA, etc.)<br />
• Customs Union: free trade zone + common external tariff<br />
• Common <strong>Market</strong>: customs union + free flow of factors of production within<br />
region (capital, labour)<br />
• Economic Union: unification/harmonization of economic policies: monetary<br />
policy, fiscal policy, regulatory regimes…<br />
Proliferation of RTAs<br />
200<br />
180<br />
160<br />
140<br />
120<br />
100<br />
80<br />
60<br />
40<br />
20<br />
0<br />
Number of Regional Trade Agreements Notified to WTO<br />
1958 – 2009<br />
Source: World Trade Organization
EU existing trade regimes<br />
Yemen<br />
Bhutan<br />
Laos<br />
Samoa<br />
Liberia<br />
Tuvalu<br />
Vanuatu<br />
Greenl<strong>and</strong><br />
GSP<br />
Afghanistan<br />
Somalia<br />
East Timor<br />
Kiribati<br />
Eritrea<br />
Sudan<br />
Sao Tome<br />
Eq. Guinea<br />
Guam<br />
Montserrat EU-<br />
Palau Nauru CARIFORUM<br />
F. Polynesia<br />
Cook Is.<br />
Micronesia<br />
Marshall Is.<br />
Tokelau<br />
Cayman Is. Antartica<br />
Bermuda<br />
Aruba<br />
St. Helena<br />
EAC<br />
EBA<br />
EEA<br />
SGP<br />
Euro-Med<br />
Norfolk Is.<br />
Gibraltar<br />
Comoros<br />
Am. Samoa<br />
Pitcairn<br />
Niue<br />
Iran<br />
Ethiopia<br />
Libya<br />
Iraq<br />
EBA<br />
Burkina Faso<br />
Myanmar*<br />
Sierra Leone<br />
Malawi<br />
Madagascar<br />
Haiti<br />
St. Piere.<br />
Anguilla<br />
East African Community<br />
Everything but arms<br />
Grenada<br />
N. Mariana Is. New Caledonia<br />
European Economic Area<br />
Interim EPA<br />
Seychelles<br />
Zambia<br />
Solomon Isl.<br />
Mayotte<br />
Sistema General de Preferecias<br />
Jamaica<br />
Euro-Mediterranean Partnership<br />
* Belarus <strong>and</strong> Myanmar (LDC) are temporarily<br />
suspended from the GSP regime<br />
Angola<br />
Niger<br />
Barbados<br />
St. Vincent<br />
Turks<br />
Bouvet Is.<br />
Uzbekistan<br />
Togo<br />
Guyana<br />
St. Kitts<br />
Mauritius<br />
Azerbaijan<br />
Tajikistan<br />
Benin<br />
Chad<br />
Congo Dem.Rep.<br />
Cape Verde<br />
Mali<br />
Lesotho<br />
Zimbabwe<br />
Russia<br />
Christmas Is.<br />
Djibouti<br />
Gambia<br />
Belarus*<br />
Senegal<br />
Kazakhstan<br />
Maldives<br />
Malaysia<br />
Turkmenistan<br />
Bangladesh<br />
Nepal<br />
Mauritania<br />
Guinea-Bissau<br />
Ctrl. Afr. Rep.<br />
Cambodia<br />
Mozambique<br />
Ug<strong>and</strong>a<br />
Rw<strong>and</strong>a<br />
Burundi<br />
Tanzania<br />
Belize<br />
Trinidad<br />
St. Lucia<br />
Ghana<br />
Ivory Coast<br />
Namibia<br />
Cameroon<br />
Kenya<br />
Fiji<br />
Swazil<strong>and</strong><br />
Botswana<br />
Wallis<br />
Netherl<strong>and</strong>s Antilles<br />
China<br />
EU-EAC<br />
Papua NG<br />
Macao<br />
Panama<br />
Cuba<br />
Argentina<br />
Vietnam<br />
Philippines<br />
Cocos Is.<br />
Brazil<br />
Indonesia<br />
Uruguay<br />
Tonga<br />
Ukraine<br />
Kuwait<br />
GSP+<br />
Nigeria<br />
Kyrgyzstan<br />
Brunei<br />
Thail<strong>and</strong><br />
Qatar<br />
Pakistan<br />
Mongolia<br />
McDonald Is.<br />
S. S<strong>and</strong>wich Is.<br />
Paraguay<br />
U.A.E<br />
Oman<br />
Venezuela<br />
B.I.O.T.<br />
Falkl<strong>and</strong> Is.<br />
Honduras<br />
Georgia<br />
Armenia<br />
India<br />
Sri Lanka<br />
Colombia<br />
Bahrain<br />
Saudi Arabia<br />
El Salvador<br />
Ecuador<br />
Guatemala<br />
Nicaragua<br />
Costa Rica<br />
Bolivia<br />
Peru<br />
South Africa<br />
Euro-<br />
Med<br />
Jordan<br />
Algeria<br />
Lebanon<br />
Mexico<br />
Egypt<br />
Tunisia<br />
Morocco<br />
Syria<br />
MFN<br />
WTO<br />
Australia<br />
United States<br />
Japan<br />
New Zeal<strong>and</strong><br />
Bilateral<br />
Canada<br />
Hong Kong<br />
Singapore Taiwan Korea, Rep.<br />
Albania<br />
Turkey<br />
Icel<strong>and</strong><br />
Norway<br />
Liechtenstein<br />
San<br />
Marino<br />
Andorra<br />
Bosnia<br />
Israel<br />
Palestine<br />
Switzerl<strong>and</strong><br />
Chile<br />
Moldova<br />
Serbia<br />
Kosovo<br />
Montenegro<br />
EEA<br />
Croatia<br />
Macedonia<br />
Others nonreciprocal<br />
Proliferation of RTAs<br />
250<br />
Trade Agreements in Goods by Country Groups<br />
2006-2009<br />
200<br />
150<br />
100<br />
50<br />
0<br />
2006 2007 2008 2009 2006 2007 2008 2009 2006 2007 2008 2009 2006 2007 2008 2009 2006 2007 2008 2009 2006 2007 2008 2009<br />
Africa Americas Asia Europe(1) Middle East Across groups<br />
Notified to WTO In-Force Signed Under Negotiation Consultation (2)<br />
(1) The 27 Member States of the European Union are considered as one single trading<br />
entity
Implications<br />
• Almost every country in the world is member to an ever<br />
increasing number of trade agreements<br />
• Every trade agreement has its own rules of origin<br />
• It is difficult to keep up-to-date on what tariffs are applied <strong>and</strong><br />
faced by your country <strong>and</strong> your competitor countries<br />
• It is confusing to underst<strong>and</strong> what are the best conditions you<br />
face to access one specific market<br />
• It is key to have more clarity <strong>and</strong> transparency on what tariffs<br />
<strong>and</strong> rules of origin apply to specific products in specific markets<br />
Features of MAcMap<br />
• Wide geographical coverage:<br />
• tariffs applied by 187 countries to the products exported by 239 countries<br />
<strong>and</strong> territories<br />
• Wide coverage of instruments:<br />
• ad-valorem tariffs; specific tariffs; tariff quotas <strong>and</strong> antidumping duties<br />
• Preferences:<br />
• Covers most bilateral <strong>and</strong> regional agreements<br />
• Rules of Origin <strong>and</strong> Certificates of Origin also included for most<br />
agreements<br />
• Analytical flexibility:<br />
• Permits any analysis: by region, by economic sector or by measure
MAcMap<br />
• <strong>Market</strong> Access Map is continuously updated. Data is sourced<br />
from:<br />
• Applied tariff data is collected by ITC directly from national customs<br />
institutions<br />
• Tariff quota data from WTO (agricultural notification of tariff quota) <strong>and</strong><br />
national sources for bilateral <strong>and</strong> regional tariff quota agreements<br />
• Trade data from national sources, IDB (integrated database), WTO <strong>and</strong><br />
the COMTRADE database of the United Nations Statistics Division<br />
(UNSD).<br />
• Access MAcMap through the <strong>Market</strong> <strong>Analysis</strong> portal at:<br />
http://www.intracen.org/marketanalysis<br />
Quick search module<br />
Quick Search of tariffs – quick <strong>and</strong> easy search<br />
M<strong>and</strong>atory fields
Quick search: chose your product<br />
Fill the search boxes with the<br />
first few letters of the data<br />
you're looking for<br />
Select your desired level<br />
of information: HS-6 or<br />
National Tariff Line<br />
Hit „Enter‟ or „Tab‟ to<br />
confirm your selection<br />
Quick search<br />
Read<br />
carefully,<br />
critical<br />
information<br />
here!!
Quick search<br />
Click „print report‟ to see the full list of countries<br />
Chose more records per page to<br />
see the entire list in one screen<br />
The rest of the<br />
regimes can be<br />
seen by clicking<br />
on the numbers<br />
Quick search<br />
When in doubt click on Glossary for definitions <strong>and</strong> concepts
Glossary<br />
Search alphabetically<br />
Quick search: trade regimes, rules of origin<br />
See all trade regimes that<br />
a country applies or faces<br />
<strong>and</strong> rules of origin for<br />
those regimes, to get an<br />
initial insight into issues<br />
concerning compliance
Quick search: trade regimes, rules of origin<br />
Click on „print report‟ or select more records<br />
per page to see all trade regimes in one page<br />
There might be<br />
several trade<br />
regimes applicable<br />
for one product in<br />
any one importing<br />
country<br />
Review the certificates of origin<br />
<strong>and</strong> the texts of the rules of origin<br />
Example of a rule of origin
Example of a certificate of origin<br />
Compare tariffs module<br />
Which countries offer the best market access for cocoa beans
Compare tariffs module<br />
Scroll through the importing countries alphabetically, or…<br />
Compare tariffs module<br />
…click on the column heading “level of<br />
protection” or on "Total ad valorem<br />
equivalent tariff (estimated) to sort table by<br />
level of applied tariff in ascending order<br />
…or click on the map
Compare tariffs: <strong>Market</strong> Access Map<br />
If you leave your mouse over any given country,<br />
a mouse over pops up with the applied tariff <strong>and</strong><br />
existing trade relationship between the countries<br />
Trade = Exports + imports<br />
Overall trade taking place,<br />
NOT trade balance
Investment Map<br />
For better identification of investment opportunities<br />
Investment Map is an interactive web-based analysis tool that combines statistics on foreign<br />
direct investment (FDI), international trade <strong>and</strong> market access into a single portal. Investment<br />
Map allows analyses by country, trading partner <strong>and</strong> industry. It also includes relevant information<br />
on activities of foreign affiliates in developing countries <strong>and</strong> economies in transition.<br />
This portal aims to assist investment promotion agencies (IPAs) in pinpointing the sectors that<br />
have successfully attracted FDI in a country as a guide to identifying priority sectors for<br />
promotion. It also helps them identify the countries with whom they compete for foreign<br />
investment attraction in a targeted sector <strong>and</strong> which countries are investing abroad by sector.<br />
Moreover, information on foreign affiliates can be useful to domestic enterprises looking to supply<br />
to transnational corporations as a stepping stone to accessing international markets <strong>and</strong> wider<br />
export activities.<br />
The strengths of Investment Map lie in its sectoral level investment data <strong>and</strong> the combined<br />
information on investment flows <strong>and</strong> stocks, trade <strong>and</strong> tariff data, <strong>and</strong> activities of foreign<br />
affiliates. Moreover, Investment Map is also linked to other tools such as the World Investment<br />
Directory, <strong>Market</strong> Access Map <strong>and</strong> Trade Map.<br />
Investment Map includes:<br />
• Total FDI flows <strong>and</strong> stocks for around 200 countries <strong>and</strong> territories<br />
• FDI flows <strong>and</strong> stocks, broken down by industry (ISIC rev. 3) for around 100<br />
countries<br />
• Export <strong>and</strong> import data <strong>and</strong> indicators of trade performance for around 227<br />
countries <strong>and</strong> territories<br />
• Tariff data applied by 187 countries <strong>and</strong> faced by 200 exporting countries <strong>and</strong><br />
territories<br />
• Information on the location, sales, employment <strong>and</strong> parent company for over<br />
130,000 foreign affiliates located in developing countries <strong>and</strong> economies in transition<br />
The definition of industries in Investment Map is based on the ISIC rev 3 nomenclature. Tariff <strong>and</strong><br />
trade data are available for more than 5,300 products (6-digit level of the Harmonised System).<br />
Information on foreign affiliates covers 1,000 lines of business (US SIC nomenclature). Data on<br />
trade <strong>and</strong> FDI are available for the last four years.<br />
The <strong>Market</strong> <strong>Analysis</strong> <strong>and</strong> Research section of ITC has developed Investment Map jointly with<br />
<strong>UNCTAD</strong>, (www.unctad.org), <strong>and</strong> in partnership with the Multilateral Investment Guarantee<br />
Agency (MIGA) <strong>and</strong> the World Association of Investment Promotion Agencies (WAIPA). The<br />
portal includes information from <strong>UNCTAD</strong>, COMTRADE of UNSD, Dun & Bradstreet; Trade Map<br />
<strong>and</strong> <strong>Market</strong> Access Map.<br />
Thanks to financial contributions from ITC's Global Trust Fund <strong>and</strong> the World Bank, users in<br />
developing countries <strong>and</strong> territories can register at www.intracen.org/marketanalysis to<br />
access ITC’s market analysis tools free of charge. Users in developed countries <strong>and</strong> territories<br />
can register to get a one-week free trial access or subscribe for a longer access.
INTERNATIONAL TRADE CENTRE Page 2<br />
The <strong>Market</strong> <strong>Analysis</strong> <strong>and</strong> Research section of ITC also conducts tailored studies <strong>and</strong> training<br />
programmes on market analysis. Please visit our website for more information:<br />
www.intracen.org/marketanalysis .<br />
Locations competing for Investment Attraction in selected industry (selected by level of income)<br />
Countries with potential to invest abroad in selected industry<br />
Parent Companies<br />
Foreign Affiliates
Investment Map<br />
For an improved identification of<br />
opportunities for FDI attraction<br />
INVESTMENT MAP<br />
Key functionalities<br />
• Helps identifying target sectors for investment promotion<br />
• Helps identifying countries competing for inward FDI<br />
attraction in a particular sector<br />
• Help defining who are the actual/potential investor countries<br />
in that given sector<br />
• Provides information on multinational corporations’ foreign<br />
affiliates, investing in a particular sector<br />
Investment Map Overview<br />
Project Title<br />
City, date
What is Investment Map<br />
• Launched in 2004<br />
• A joint undertaking<br />
• Between the International Trade Centre (ITC)<br />
<strong>and</strong><br />
the United Nations Conference on Trade <strong>and</strong><br />
Development (<strong>UNCTAD</strong>)<br />
• In partnership with:<br />
• Multilateral Investment Guarantee Agency (MIGA)<br />
• World Association of Investment<br />
Promotion Agencies (WAIPA)<br />
Coverage<br />
Investment Map Overview<br />
Project Title<br />
City, date
Geographic • It is an interactive coverage tool that combines statistics on FDI (flows<br />
<strong>and</strong> stocks), international trade, tariffs <strong>and</strong> information on<br />
foreign affiliates:<br />
• It currently includes harmonized FDI data detailed by sector <strong>and</strong>/or<br />
country for about 100 countries <strong>and</strong> territories. Data is updated to 2008<br />
for about 70 countries (United Nations International St<strong>and</strong>ard for<br />
Industrial Classification - ISIC rev 3)<br />
• Information on multinational corporations:<br />
• Location, sales, employment <strong>and</strong> parent/affiliate company<br />
• Data on about 130’000 foreign affiliates established in developing<br />
countries<br />
• United States St<strong>and</strong>ard Industrial Classification - US SIC87<br />
Key characteristics:<br />
- most recent annual FDI data available (including bilateral data)<br />
-harmonized data in an interactive tool<br />
Defining FDI<br />
• FDI takes place when a company invests directly in facilities<br />
to produce <strong>and</strong>/or market a product/service in a foreign<br />
country.<br />
• Investment involving a long-term relationship <strong>and</strong> a lasting<br />
interest by an entity in one country in an enterprise located in<br />
a different country.<br />
Investment Map Overview<br />
Project Title<br />
City, date
Types of investment<br />
• Greenfield: establishment of a wholly new operation in a<br />
foreign country<br />
• Merger or acquisition of an existing firm in a foreign country<br />
• Sales offices<br />
• Representative offices<br />
• Non-equity investment<br />
Types of FDI<br />
• Horizontal:<br />
• Within same industry/sector across different countries:<br />
• Wal-Mart (Supermarkets), Deutsche Post (Logistics), GM (Automotive).<br />
• Maximizes market access <strong>and</strong> share.<br />
• Vertical:<br />
• Within same value chain:<br />
• Dell (Design: US; Production: China; Distribution: Global hubs; Support: India, etc.)<br />
• Maximizes efficiency along one value chain.<br />
Investment Map Overview<br />
Project Title<br />
City, date
Measuring FDI<br />
FDI flows<br />
• It is the total amount of FDI undertaken over a given period of<br />
time, <strong>and</strong> it comprises:<br />
• Equity capital: purchase of shares of an enterprise in a foreign country<br />
(10% participation threshold)<br />
• Reinvested earnings: part of an affiliate’s earnings accruing to the<br />
foreign investor that is reinvested in that enterprise<br />
• Intra-company loans: short- <strong>and</strong> long- term borrowing <strong>and</strong> lending<br />
Measuring FDI<br />
FDI stocks<br />
• It is the total accumulated value of foreign-owned assets at a<br />
given time, <strong>and</strong> it comprises:<br />
• The value of the share of their capital <strong>and</strong> reserves belonging to<br />
foreign companies<br />
• The net indebtedness with the parent companies<br />
Investment Map Overview<br />
Project Title<br />
City, date
Measuring FDI<br />
• Stocks <strong>and</strong> flows are<br />
related over time:<br />
Flow<br />
• Stock t = Stock t-1 + Flow t<br />
• Flow t = Stock t – Stock t-1<br />
Stock<br />
Flow<br />
(reimbursement of intra-company loans, disinvestment)<br />
Potential impact of FDI<br />
• Benefits:<br />
• Increased employment<br />
• Upgraded infrastructure: utilities,<br />
logistics, business services<br />
• Fast transfer of technology <strong>and</strong><br />
managerial skills, that:<br />
• Increase labour productivity<br />
• Contribute to innovations<br />
• Increased market competition:<br />
push for further innovation <strong>and</strong><br />
efficiency<br />
• Greater consumer choice at lower<br />
prices<br />
• Risks:<br />
• Lack of sufficient technology<br />
transfer<br />
• Enclave investment with no links<br />
to domestic economy<br />
• Excess fiscal incentives<br />
jeopardize local investment<br />
• Race to the bottom <strong>and</strong> unethical<br />
behavior:<br />
• Child labour employment<br />
• Cross-border "shipment" of<br />
environmentally costly activities<br />
Investment Map Overview<br />
Project Title<br />
City, date
Data limitations - FDI<br />
• Difficult to capture due to intangibility of financial flows<br />
• Level of agregation varies due to confidentiality issues<br />
• Countries that report often do so with considerable time lag<br />
• International reporting practices (IMF, OECD) are not followed<br />
uniformly<br />
• all 3 components (equity, reinvested earnings, intra-company loans)<br />
may not be included<br />
• Differences in time periods over which the FDI transactions<br />
were recorded<br />
Data limitations – Distortion of information<br />
• Book value of FDI stocks<br />
• Identification of ultimate owner<br />
• Role of Special Purpose Entities (SPEs)<br />
• Round-tripped investment<br />
• Transhipped investment<br />
Investment Map Overview<br />
Project Title<br />
City, date
Data limitations - foreign affiliates<br />
• Data on foreign affiliates vary from country to country<br />
• Fields not systematically reported<br />
• Sales <strong>and</strong> number of employees<br />
• Data available only for developing countries<br />
Data limitations – classification<br />
• FDI data cannot always be allocated accurately to a given<br />
industry or a given country<br />
• “Unspecified secondary” or “Unspecified European Union”<br />
• Foreign affiliates are based on the United States<br />
nomenclature, US SIC87<br />
• Its conversion to the ISIC nomenclature can only be approximate<br />
• Trade data (HS 6 digit level) are converted into the ISIC<br />
classification<br />
• Hybrid group called “mixed goods (trade data )”<br />
Investment Map Overview<br />
Project Title<br />
City, date
Conclusion<br />
• Identify sectors with potential to attract FDI in a given country<br />
• Identify potential country sources of investment<br />
• Identify locations competing for investment<br />
• Identify potential company sources of investment<br />
THANK YOU!<br />
Please do not hesitate to contact us should you have questions,<br />
doubt or comments:<br />
marketanalysis@intracen.org<br />
Investment Map Overview<br />
Project Title<br />
City, date
St<strong>and</strong>ards Map<br />
Comparative analysis <strong>and</strong> review of information on<br />
private st<strong>and</strong>ards<br />
Introduction<br />
A Ghanaian exporter of pineapples is looking to diversify its exports into<br />
new niche markets...<br />
What st<strong>and</strong>ards are recognized in his/her current destination markets<br />
Which st<strong>and</strong>ards apply to pineapples grown in Ghana<br />
What are the requirements for certification, <strong>and</strong> what are the associated<br />
costs<br />
An investor from Canada is considering India for his new investment in<br />
the Indian agriculture sector…<br />
Which st<strong>and</strong>ards operate in India that are applicable to the product he<br />
will grow<br />
What are the potential impacts of these st<strong>and</strong>ards in India, <strong>and</strong> how<br />
does this impact the investor’s risk profile
Introduction<br />
A Trade Support Institution in Peru wants to further support its clients in<br />
exporting their products to Northern markets...<br />
What st<strong>and</strong>ards operate in Peru<br />
Which sectors/products can be certified by these st<strong>and</strong>ards<br />
What export markets recognize these st<strong>and</strong>ards<br />
How can the TSI help its clients underst<strong>and</strong> if certification makes sense<br />
as a business decision<br />
A Policy Maker in Malaysia wants to strategize on how local companies<br />
can use private st<strong>and</strong>ards to their advantage…<br />
What is the mission <strong>and</strong> goal of the st<strong>and</strong>ards that operate in Malaysia<br />
What support <strong>and</strong> capacity building do they offer to Malaysian<br />
companies<br />
Initial answers to these questions <strong>and</strong> many<br />
more are easily found in St<strong>and</strong>ards Map<br />
St<strong>and</strong>ards Map<br />
An interactive tool that provides detailed information on “private<br />
st<strong>and</strong>ards”<br />
“Private or “voluntary” st<strong>and</strong>ards are developed by non-governmental entities,<br />
incl. non-governmental organisations, industry associations, companies, among<br />
others. As such, compliance to these st<strong>and</strong>ards is not legally required by national<br />
governments or multilateral regulations as opposed to public st<strong>and</strong>ards.”<br />
As of February 2011, St<strong>and</strong>ards Map contains information on:<br />
30 st<strong>and</strong>ard systems operational in over 160 countries that cover<br />
over 40 sectors;<br />
150 research materials, including academic papers, dissertations,<br />
scientific articles…<br />
Work is in progress to add another 15 st<strong>and</strong>ards, as well as 50 new<br />
research materials by the end of March 2011.
Key characteristics<br />
Where does the st<strong>and</strong>ards information come from<br />
• Publicly available data from st<strong>and</strong>ards<br />
• Desk research (ITC)<br />
• External Quality Control (independent experts)<br />
• Final verification <strong>and</strong> sign-off on the data (each st<strong>and</strong>ard organization)<br />
The website will also be fully translated into French <strong>and</strong> Spanish by April<br />
2011.<br />
Key features<br />
• St<strong>and</strong>ards Overview « at a glance »<br />
• Reference material (training, useful links…)<br />
• Glossary of terms <strong>and</strong> expressions<br />
• For registered users only:<br />
– Interactive module to analyse <strong>and</strong> compare st<strong>and</strong>ards;<br />
– Direct access to relevant research material;<br />
– Tailored information on st<strong>and</strong>ards depending on users’ needs;<br />
– Comparison tables across st<strong>and</strong>ards.
One global database – multiple applications<br />
Producers -<br />
TSI - Exporters<br />
St<strong>and</strong>ards<br />
Map<br />
Integrated approach<br />
Common taxonomy, interlinked<br />
databases<br />
Public procurement<br />
website<br />
(Germany, Switzerl<strong>and</strong>)<br />
SME buyers<br />
website<br />
(Germany, Switzerl<strong>and</strong>)<br />
Information on voluntary<br />
st<strong>and</strong>ards including:<br />
• Scope of st<strong>and</strong>ard<br />
• Requirements<br />
• Enforcement mechanisms<br />
• Governance / implementation<br />
• Research materials<br />
St<strong>and</strong>ards<br />
Database<br />
(SD)<br />
Data Entry Tool<br />
A web application<br />
that automates data<br />
collection, review<br />
<strong>and</strong> processing<br />
Research<br />
Database<br />
(RD)<br />
Future front-ends<br />
(Retail, trade<br />
associations, chambers<br />
of commerce...)<br />
7<br />
Classification of St<strong>and</strong>ards<br />
What is<br />
behind these<br />
logos
Classification of St<strong>and</strong>ards<br />
Various perspectives to classify private st<strong>and</strong>ards…<br />
• Are the st<strong>and</strong>ards based on multi-stakeholders participation<br />
• Do the st<strong>and</strong>ards st<strong>and</strong> for certification or verification<br />
• Is there a specific claim associated with the st<strong>and</strong>ard – in which case is it<br />
on-product or off-product (B2B versus B2C)<br />
• Are the st<strong>and</strong>ards specific to certain products, industries <strong>and</strong> countries, or<br />
do they apply across sectors <strong>and</strong> countries<br />
• Do the st<strong>and</strong>ards verify/certify themselves, or is there an independent<br />
certification process<br />
• Is there formal accreditation of the certification/verification bodies<br />
• Do the st<strong>and</strong>ards focus primarily on specific areas – such as biodiversity,<br />
labor rights, food safety…<br />
• What are the implementation mechanisms used by the st<strong>and</strong>ards –<br />
centralised versus de-centralised...<br />
Classification of St<strong>and</strong>ards<br />
Main components of the st<strong>and</strong>ards database
Classification of St<strong>and</strong>ards<br />
12<br />
<strong>Analysis</strong> <strong>and</strong> Comparison of St<strong>and</strong>ards<br />
One major challenge when comparing st<strong>and</strong>ards… taxonomy issues!<br />
• Examples:<br />
• Fairtrade « Minimum » versus « Progress » requirements<br />
• 4C Association « Traffic Light System »<br />
• UTZ Certified « Scoring system »<br />
• GlobalG.A.P « Major must » versus « Minor must »<br />
• Each st<strong>and</strong>ard has its own way to define compliance policies;<br />
• St<strong>and</strong>ards may use different terms with same intention, or same terms<br />
with different intentions…<br />
St<strong>and</strong>ards Map offers a unique approach based on<br />
a set of criteria to “translate” st<strong>and</strong>ards<br />
requirements <strong>and</strong> policies into one common<br />
taxonomy used across all st<strong>and</strong>ards.
13<br />
<strong>Analysis</strong> <strong>and</strong> Comparison of St<strong>and</strong>ards<br />
Requirements<br />
Compliance policies<br />
Assessment methods<br />
St<strong>and</strong>ards Map<br />
<strong>Analysis</strong> <strong>and</strong> Comparative Framework<br />
14<br />
<strong>Analysis</strong> <strong>and</strong> Comparison of St<strong>and</strong>ards<br />
A common taxonomy was developed to classify st<strong>and</strong>ards requirements:<br />
Immediate requirement: Compliance must be met immediately or entity is<br />
excluded from certification.<br />
Short-term requirement: Compliance must be met in less than 12 months after<br />
initial registration/certification formalities.<br />
Medium-term requirement: Compliance must be met in less than 36 months<br />
after initial registration/certification formalities.<br />
Long-term requirement: Compliance must be met in a period of time that is<br />
defined but more than 36 months after initial registration/certification formalities.<br />
Recommendation: Compliance is recommended when criteria or principles are<br />
identified that “should” be met but non-compliance is not a matter of exclusion.
15<br />
<strong>Analysis</strong> <strong>and</strong> Comparison of St<strong>and</strong>ards<br />
A common taxonomy was developed to classify compliance policies:<br />
Compliance at principle level: Compliance to the st<strong>and</strong>ard requirement is<br />
assessed based on a general principle – e.g. « …the production unit shall<br />
not drain waste water to the river...”<br />
Compliance at indicator/criterion level: Compliance to the st<strong>and</strong>ard<br />
requirement is assessed based on measurable indicators or criterion – e.g.<br />
« …workers shall be paid extra hours, a minimum of 20% more than the fee<br />
rate applied for normal work hours... »<br />
16<br />
<strong>Analysis</strong> <strong>and</strong> Comparison of St<strong>and</strong>ards<br />
A common taxonomy was developed classify assessment methods :<br />
Pass or Fail: This method is black <strong>and</strong> white: one may pass or fail, hence<br />
not become certified or be suspended from certification. Corrective actions<br />
may be taken depending on the st<strong>and</strong>ard.<br />
Threshold: Compliance to the st<strong>and</strong>ard requirement is assessed based on a<br />
specific objective to be met, which is made explicit in the st<strong>and</strong>ard document.<br />
Scoring: Compliance to the st<strong>and</strong>ard requirement is assessed based on a<br />
scoring system against which auditors are working.<br />
Traffic light system: Compliance to the st<strong>and</strong>ard requirement is based on<br />
traffic light set of indicators: « Red » / « Orange » / « Green » that indicate<br />
good or bad practices <strong>and</strong> provide guidance to improve business practices<br />
over time.
Free Access to users from developing countries<br />
Thanks to financial contributions from ITC's Global Trust Fund<br />
<strong>and</strong> the World Bank, all users from developing countries <strong>and</strong><br />
territories may access ITC's market analysis tools free of charge.<br />
http://www.st<strong>and</strong>ardsmap.org<br />
http://www.intracen.org/marketanalysis
Practical Exercise on TRADE MAP<br />
A. PRODUCT ANALYSIS<br />
IDENTIFYING THE HS OF THE PRODUCT<br />
Identify the harmonized system code of the product you want to focus on.<br />
1. Name of the product: _________________________________________________________<br />
2. Provide the harmonised system (HS) code for both the product group <strong>and</strong> product in<br />
question<br />
Note: To avoid ambiguities throughout your analysis, it is important to ensure that the<br />
description <strong>and</strong> corresponding trade classification, or tariff code is correct.<br />
4-digit HS:<br />
6-digit HS:<br />
Note: In the selection menu of Trade Map, click on Advanced Search. You can search by<br />
keyword the corresponding HS code of the product using one or several keywords through<br />
the HS label at 2,4,6 digits level of the Harmonized system <strong>and</strong> at the national tariff line level.<br />
3. Provide the national tariff line code of the product (NTL) for the exporting country (indicate<br />
if several):<br />
NTL code:<br />
NTL code:<br />
NTL code:<br />
4. Provide the national tariff line code of the product (NTL) for USA (indicate if several):<br />
NTL code:<br />
NTL code:<br />
NTL code:<br />
5. Is there any information provided at the NTL lines of the exporter or for the US<br />
Note:
Practical exercice<br />
ANALYZE WORLD TRADE FOR YOUR SELECTED PRODUCT<br />
6. How much in total of this product is imported in the world<br />
US$: ____________ Quantity: ____________ tons/units<br />
Note: In Trade Map, Select the product for which you want to do market research. Select<br />
“Imports” <strong>and</strong> then click on Trade Indicators<br />
7. Have the world imports grown or declined between 2005 <strong>and</strong> 2009<br />
Your answer:<br />
8. Approximately how many countries import <strong>and</strong> export the selected product<br />
Note: To find out, you need to export the table into Excel or click on “300 rows per page” on<br />
the top right end corner of the table to count the total number of importing <strong>and</strong> exporting<br />
countries.<br />
Your answer:<br />
9. Does the unit value vary significantly for your product from country to country If yes,<br />
account for the reasons that could explain the disparities above.<br />
Your answer:<br />
Note: This unit value is calculated by dividing the total import value by the total import<br />
quantity.<br />
10. Is there a difference between the world’s growth rate in value <strong>and</strong> world’s growth rate in<br />
quantity Explain what this difference could mean.<br />
Your answer<br />
11. Which countries are the 3 largest importers (in value in 2008) of the product<br />
Ranking Importers Share in World Imports, %<br />
1<br />
2<br />
3
Practical exercice<br />
12. What share of world total imports do the 3 main importers make up together ____%<br />
13. Does this indicate that the world dem<strong>and</strong> for this product is concentrated<br />
YES or NO<br />
14. Which countries are the 3 largest exporters (in value in 2008) of this product What is the<br />
value of their exports<br />
Ranking Exporters Share in World Exports, %<br />
1<br />
2<br />
3<br />
15. What share of world total exports do the 3 main exporters make up together<br />
____%<br />
16. Does this indicate that the world supply for this product is concentrated<br />
YES or NO<br />
CHOOSE AN EXPORTING COUNTRY AND TRADE PERFORMANCE FOR YOUR<br />
SELECTED PRODUCT<br />
17. Does the country already export this product YES or NO<br />
18. If yes, what is the country’s ranking in world exports <strong>and</strong> world market share of this<br />
product<br />
Ranking: ____________ World <strong>Market</strong> Share: ____________<br />
19. How much in total of this product is exported by this country to the world<br />
US$ Value: ____________ US$ Quantity: ____________ tons/units<br />
Note: To easily find your country among all countries listed, click twice on the title of the<br />
column entitled “Importers”. The list of countries will no longer be sorted by “Value imported<br />
in 2008”. It will be sorted alphabetically. Don’t forget that if your country is not listed on the<br />
first page, you can click on the numbers “1 2 3 4…” underlined on the top right h<strong>and</strong> side of<br />
the table. Once you have found the answer to this question, click on the title “Value imported<br />
in 2008” to sort data again.<br />
20. Have the exports grown or declined between 2005 <strong>and</strong> 2009<br />
Explain your reasoning:<br />
21. Is the exporting country GAINING or LOSING market share in the world market<br />
Explain your reasoning:
Practical exercice<br />
Note: compare the growth rate of your country to the world export’s growth rate.<br />
22. What are the three biggest importers of the exporting country (in US$ value) in 2009<br />
1. __________________ 2. __________________ 3. __________________<br />
Note: Click on the name of your country or go back to the selection menu, enter the name of<br />
your country in the country search box <strong>and</strong> select when it appears in the drop down menu.<br />
Submit with “Trade Indicators”. Trade Map should show the list of importing countries of your<br />
product.<br />
ANALYZE YOUR CHOSEN COUNTRY’S TRADE PERFORMANCE FOR YOUR<br />
SELECTED PRODUCT IN THE US<br />
23. Is the US among of the importing countries<br />
24. YES (go to question 25) or NO (go directly to question 26)<br />
25. If yes, how much the US has imported in 2009<br />
US$: ___________ Quantity: ____________ tons/units<br />
26. Is the exporting country GAINING or LOSING market share in the US market<br />
Explain your reasoning:<br />
27. Who are the three biggest exporters to the US market in 2009<br />
1. __________________ 2. __________________ 3. __________________<br />
28. Have the US’ imports grown or declined between 2008 <strong>and</strong> 2009<br />
Explain your reasoning<br />
Note: Look at the first row of the table “List of supplying markets for the product imported by<br />
the US in 2009”.<br />
29. What happened between 2009 <strong>and</strong> 2010<br />
Explain your reasoning<br />
Note: Click on Times Series<br />
30. Investigate the US market at the most detailed product level of import trade statistics, the<br />
national tariff line level (NTL) to identify possible product specification <strong>and</strong> refine your<br />
analysis by using the most appropriate NTL.<br />
Describe the differences between NTL.<br />
Note: Click in “other criteria”, by product.
Practical exercice<br />
31. Examine import seasonal variation of the product at the tariff line level between 2005 <strong>and</strong><br />
2010.<br />
Comments:<br />
Note: You can use graphs to analyse seasonality. Go back to the view by Country. In “Other<br />
criteria”, click on monthly or quarterly data, <strong>and</strong> then click on graph, <strong>and</strong> tick the box “Show<br />
world data”.<br />
SCREEN GLOBAL MARKET<br />
Note: Go back to the table with the Total World Imports of your products (List of importers for<br />
the selected product in 2009).<br />
32. Which importing countries have the highest imported value in 2009 for each region And<br />
what are their respective annual growth rates in value <strong>and</strong> in quantity between 2005 <strong>and</strong><br />
2009<br />
Note: By clicking on “Country group”, you can directly select the region.<br />
Importing<br />
country<br />
Imported value in<br />
2009 (millions USD)<br />
Annual growth in<br />
value between 2005-<br />
2009, %”<br />
Annual growth in<br />
quantity between<br />
2005-2009, %”<br />
In Asia<br />
1<br />
2<br />
In Europe<br />
1<br />
2<br />
In Africa<br />
1<br />
2<br />
In Latin America<br />
1<br />
2
Practical exercice<br />
33. Which countries would you consider as potential markets Are there any new/other<br />
interesting importing markets besides the main global importers<br />
Your answer<br />
SELECTING ATTRACTIVE MARKETS<br />
34. Which are two potential attractive markets for exporting this product<br />
Note: Do not choose these markets only on the basis of the size of the importing market <strong>and</strong><br />
dynamism, or because the country already exports to those current markets but take also<br />
into account other parameters such proximity, cultural similarities, trends etc.<br />
You can gather the relevant key indicators in one table as below according to your own<br />
analysis. Don’t hesitate to adapt the table to your needs <strong>and</strong> add other indicators.<br />
Target<br />
Country<br />
Value<br />
Imported<br />
(million<br />
$)<br />
Unit Value<br />
(US$/unit)<br />
World<br />
<strong>Market</strong><br />
Share<br />
(%)<br />
Annual<br />
Growth Rate<br />
in value<br />
2005-09 (%)<br />
Annual Growth<br />
Rate in<br />
quantity<br />
2005-09 (%)<br />
Other criteria<br />
(<strong>Market</strong> size,<br />
Consumption,<br />
Distance...etc)<br />
A<br />
United<br />
States<br />
B<br />
C<br />
Comments:<br />
35. Who would be your main competitors in these countries <strong>and</strong> why<br />
Note: In Trade Map, click on each country, <strong>and</strong> identify three countries who you feel are<br />
your main competitors <strong>and</strong> explain why. You should formalise this opinion not only based on<br />
all the indicators provided in Trade Map (unit values, annual growth, trends <strong>and</strong> tariffs), but<br />
also on your prior knowledge of the situation. Don’t hesitate to adapt the table to your need.
Practical exercice<br />
Target Country<br />
Your country’s main competitors in target market<br />
1<br />
A<br />
United States<br />
2<br />
3<br />
1<br />
B<br />
2<br />
C<br />
3<br />
1<br />
2<br />
3
Practical exercice<br />
B. COUNTRY ANALYSIS - ANALYSING TRADE PERFORMANCE<br />
EXPORT AND IMPORT PRODUCTS COMPOSITION AND PERFORMANCE<br />
Note: On the Main Selection Menu, click on the search box next to “Country”. As you do<br />
this, a drop down menu appears. Type the name of the exporting country you’ve selected in<br />
the search box. Once you see the appropriate country name appearing in the drop down<br />
menu, click on it to select it. Then select, “Exports” <strong>and</strong> “Trade Indicators”. Leave the product<br />
box as blank, by default it represent “TOTAL-All products”.<br />
36. Is the country GAINING or LOSING market share in the world market<br />
37. What is the annual growth of total world imports for all products in value between 2005 <strong>and</strong><br />
2009 _______<br />
38. What is the annual growth of total export of the country between 2005 <strong>and</strong> 2009 _______<br />
39. Was the total value of exports of the country MORE or LESS dynamic than the import world<br />
average between 2005 <strong>and</strong> 2009<br />
40. Explain you reasoning: __________________________________________________<br />
_____________________________________________________________________________<br />
41. What can we conclude ________________________________________________________<br />
_____________________________________________________________________________<br />
42. What are the top three export/imported products in value in 2009 at the 2-digit level <strong>and</strong> at<br />
the 6-digit-level<br />
Note: Rather than having the “Products at 2 digits” under the secondary selection menu,<br />
select “Products at 6 digits”. This generates a table providing information on the top exports<br />
at the 6-digit level. In the secondary menu, in the line “Other criteria”, you can easily switch<br />
from import to export.<br />
EXPORTS<br />
IMPORTS<br />
HS-2 Product name HS-2 Product name<br />
1 1<br />
2 2<br />
3 3<br />
HS-6 Product name HS-6 Product name<br />
1 1<br />
2 2<br />
3 3
Practical exercice<br />
43. In the top 10 exported sectors at the HS-2 digit level, which sectors have gained market<br />
share in the world market<br />
Your answer: list export sectors (HS-2 digit):<br />
44. Which of those sectors would you consider as dynamic<br />
Your answer: list export sectors HS-2 digit:<br />
Note: Compare the annual growth of total world imports in value between 2005 <strong>and</strong> 2009 of<br />
each sector to the annual growth of total world imports in value between 2005 <strong>and</strong> 2009<br />
(question 43)<br />
45. Compare your result with the bubble graph “Bubble graph on Country X’s export growth<br />
vs. World Import Growth”.<br />
46. Using the “Bubble graph on Country X’s export growth vs. World Import Growth”, identify<br />
which exported product at the HS-2 digit level (among the top 20 exported in value) could<br />
be considered as “winners in growing sectors”.<br />
Your answer: list export sectors HS-2 digit:<br />
Note: Create the “Bubble graph on Country X’s export growth vs. World Import Growth”. You<br />
need to select in “other criteria”: “Exports”, “Trade Indicators”, by product” <strong>and</strong> “the same<br />
level (2-digit)”. Identify the sectors in top right quadrant “Winners in Growing Sectors” <strong>and</strong><br />
compare the list of sectors with the results of question 44.<br />
DESTINATION OF EXPORTS AND ORIGIN OF IMPORTS<br />
47. Which countries are the primary export markets/main suppliers (in value) for all products<br />
IMPORTERS<br />
SUPPLIERS<br />
1 1<br />
2 2<br />
3 3<br />
Note: Under the Secondary Selection Menu, in the line “other criteria, select “by country”.<br />
Trade Map shows you the country’s trade with the rest of the world for all products.
Practical exercice<br />
48. Export mapping: create a map to illustrate the list of importing markets for all products<br />
exported by the selected country in 2009.<br />
Your answer: insert the map here<br />
Note: Click on the tab “Map”, <strong>and</strong> then do a “print-screen” to insert the map into the Word<br />
format.<br />
Comments about the map:<br />
Interesting: by selecting different types of first <strong>and</strong> second trade indicators <strong>and</strong> using the<br />
zoom function, you can easily illustrate which country are the main importing countries in<br />
terms of value <strong>and</strong> dynamism.<br />
49. Export Dynamism: create a graph to illustrate the import dynamism of the top ten importing<br />
markets for all the products exported by the selected country in 2009.<br />
Your answer: insert the graph here<br />
Note: Click on the tab “Table”, then select the Bar chart on exported value. Insert the bar<br />
chart into the Word format.<br />
Comments about the bar chart:<br />
Interesting: by selecting different type of first <strong>and</strong> second trade indicators, you can easily<br />
illustrate which countries are the main importing countries in terms of value <strong>and</strong> dynamism.<br />
50. Export Concentration: create the bubble graph on “Prospect for market diversification” to<br />
illustrate the share in the country’s total exports of the top 20 importing countries<br />
compared to their overall import dynamism.<br />
Your answer: insert the bubble graph here<br />
Comments about the map:
Practical exercice<br />
51. Potential for export destination diversification: create the “Bubble graph on Country X<br />
export growth vs. Partner import growth“ to identify among the top 20 importing countries<br />
in value the most dynamic importing countries in which Country X is gaining market share.<br />
Your answer: insert the bubble graph here<br />
Comments about the map:<br />
52. Identify one attractive importing market considered as a “dynamic market” <strong>and</strong> in which<br />
the country is gaining market share:<br />
Name of the country: ________________________________________________________<br />
Annual growth of Country X’s exports to the partner countries between 2005 <strong>and</strong> 2009:<br />
_________<br />
Annual growth of partner countries’ imports from the world between 2005 <strong>and</strong> 2009: __ ____<br />
ANALYSE TRADE BETWEEN TWO COUNTRIES<br />
55. When analysing trade between two countries Trade Map allows you to<br />
simultaneously see for each product:<br />
(1) The actual trade between the two countries;<br />
(2) How much the importing country imports from the world.<br />
(3) How much the exporting country exports to the world;<br />
Note: These three items shown together give a rough estimate of how much the two<br />
countries could “theoretically” trade, by putting the total dem<strong>and</strong> <strong>and</strong> total export capacity in<br />
isolation. For example:<br />
53. Assess the trade situation concerning the country’s exports to the most attractive market<br />
selected above (in question 54) for all products exported.<br />
Note: Under the Main Selection Menu, under the “Country” field, enter the name of the<br />
exporting country <strong>and</strong> click on it to validate your entry. Under “Partner”, follow the same<br />
procedure to select the attractive market. Make sure you have selected Exports <strong>and</strong> then<br />
click on Trade Indicators. Make sure you have cancelled the product selection.<br />
54. Which is the most important sector in value in 2009 (HS-2 digit) exported by the country to<br />
the attractive market<br />
HS-2 digit: ________ Sector Name:________ Exported value in 2009:_______________
Practical exercice<br />
55. Which is the most important sector in value in 2009 (HS-2 digit) imported by the attractive<br />
market from the world<br />
HS-2 digit: _________ Sector Name:__________ Exported value in 2009:_______________<br />
Note: click on the title on the Value in 2009 under “Attractive country’s imports from world”<br />
(fifth column) to rank the imported value in descending order.<br />
56. Which is the most important sector in value in 2009 (HS-2 digit) exported by the exporting<br />
country to the world<br />
HS-2 digit: _________ Sector Name: _________ Exported value in 2009:_______________<br />
Note: Click on the title on the Value in 2009 under “Exporting country’s exports to world”<br />
(eight column) to rank the exported value in descending order.<br />
Identify indicative potential trade between two countries:<br />
Note: In the table showing Bilateral trade between the Exporting country <strong>and</strong> the selected<br />
attractive country in 2009, click on “Product cluster at 6-digit” in the row “other criteria”.<br />
A new column will appear to the right of the table, “Indicative potential trade, USD thous<strong>and</strong>”.<br />
The indicative potential trade has been computed based on the following logic, which is valid<br />
for each six-digit product:<br />
- The supply capacity is represented by the exports of the selected country to the world.<br />
- The dem<strong>and</strong> is represented by the imports of the selected partner country from the world.<br />
- Trade potential is defined as the lower of the value between a selected country exports to<br />
the world or the value the partner country imports from the world minus the current trade<br />
between the two countries under review.<br />
The trade potential is indicative only <strong>and</strong> serves as a departure point for further research. It<br />
gives an overview of the complementarities of the two economies.<br />
Only the positive values of the potential trade are displayed. Indeed there could be a<br />
negative result in case the data of the two selected countries are in conflict (in the case<br />
where a country reports a bilateral trade value greater than the unilateral trade value (i.e.<br />
with the entire world) reported by the partner country).<br />
57. For which products (HS-6 digit) the two countries present indicative potential trade<br />
List the five first products (HS-6 digit with the highest indicative potential trade):<br />
58.<br />
Comments about the results:
Practical exercice<br />
59. Select a product for which there scope for increase exports to the attractive market<br />
HS-6 digit: ______________ Name: _______________ Exported value in<br />
2009:_______________<br />
Note: The product has to present a relatively important indicative potential trade <strong>and</strong> also an<br />
existing export value which demonstrates the exporting country’s competitiveness in the<br />
market.<br />
60. To what other countries does the exporting country export the selected product (in<br />
question above)<br />
Note: Click on of the line of product (HS-6 digit) in the part “Exporting country’s exports<br />
to the world”; you can view where the country is exporting to.<br />
__________________________________________________________________________<br />
__________________________________________________________________________
Practical Exercise on MARKET ACCES MAP<br />
We suggest you visit the “Glossary” “User Guide” “Methodology” “Useful Links” <strong>and</strong> “Data<br />
Availability” (all located under the menu item “Reference Material”). In the Glossary you will<br />
find a number of tariff terms explained. The Data Availability page explains how often the<br />
data in <strong>Market</strong> Access Map is updated <strong>and</strong> the Useful Links page has links to other<br />
information sources, for example on non-tariff barriers.<br />
MODULE QUICK SEARCH – TARIFF SEARCH<br />
61. Identify the tariff applied by the US to the selected product originating from the exporting<br />
country.<br />
Note: When you first enter the <strong>Market</strong> Access Map application, the Quick Search Tariff<br />
Search module will be open. Next to the heading “Select Importing Country” type only the<br />
first three letters of the country name i.e. “uni” in the selection box. Notice how those<br />
countries starting with the letters “uni” appear in the drop-down menu box below. Select the<br />
“United States” by clicking on it in the drop-down box. It will appear in full in the selection<br />
box. If you simply type the full name of a country but forget to then select the match from the<br />
drop-down menu, the database will not recognise what you have typed.<br />
Practice using the HS code of the selected product at the most detailed level - the<br />
national tariff line identified in question 4.<br />
Note: The one for HS Level 6 is automatically pre-selected. Select instead the button for<br />
“National Tariff Line Code”. Then type the name of your product into the product selection<br />
box. Wait a few moments for the system to load the product nomenclature, <strong>and</strong> then click on<br />
the matching product that appears in the drop-down menu box below.<br />
Important: the HS code used for trade statistics <strong>and</strong> the HS code used for the tariff can be<br />
different as the revision used in Trade Ma to harmonize all data is Rev 2002 whereas other<br />
country can report their tariff in different revisions, including the most recent 2007 revision.<br />
NTL<br />
code<br />
Trade Regime<br />
Original tariff applied<br />
by the US<br />
Total Ad Valorem<br />
Equivalent (estimated)<br />
62. What is the lowest tariff applied by the US to the exporting country <strong>and</strong> the name of the<br />
related trade regime<br />
Comments:
Practical exercice<br />
63. What is the highest tariff rate applied by the US to imports of the selected product<br />
originating from the world<br />
Trade Regime Description: ______________________ Highest Tariff Rate: _____<br />
Note: Click on “New Search”. Select the importing country as “United States”. Select the<br />
product code at the NTL”. Leave the exporting country blank. Then click “Proceed”. You will<br />
see a table with all the possible tariffs applied by the US to imports of this product. By<br />
clicking on the numbers in the top right-h<strong>and</strong> corner of the table, you can view the other<br />
pages of the table.<br />
MODULE QUICK SEARCH – TRADE REGIMES & RULES OF ORIGIN<br />
64. Does the exporting country benefit from other types of trade(s) agreement(s) for any other<br />
exported products with other importing countries<br />
YES o NO<br />
65. How many trade agreements can you identify<br />
Comments:<br />
Note: Under “Quick search”, in the selection menu of the second tab “Trade regime & Rules<br />
of Origin”, select the exporting country as the exporter. Do not select an importing country.<br />
Click “Proceed”.<br />
Identify tariff advantages in attractive markets<br />
66. Identify the lowest tariffs applied <strong>and</strong> corresponding trade regimes that your country faces<br />
in the three attractive markets identified in the last section (question 35)<br />
Note: Login to <strong>Market</strong> Access Map at www.macmap.org<br />
Use the tab “Quick search” to look for all the trade regimes (MFN tariff <strong>and</strong> preferential<br />
regimes) applied by one country to any other country <strong>and</strong> the corresponding rules <strong>and</strong><br />
certificates of origin. Select only the importing country, you will see all trade regimes applied<br />
by that country to the rest of the world. If you select only the exporting country, you will see<br />
all trade regimes faced by that country when it exports to the rest of the world<br />
Target Country Trade Regime Lowest Tariffs applied<br />
A<br />
United States<br />
B<br />
C
Practical exercice<br />
MODULE COMPARE TARIFFS<br />
Compare ad valorem equivalent (AVE) tariffs that different markets apply to the<br />
selected product exported by the country<br />
67. What is the highest total ad valorem equivalent (AVE) tariff faced by the exporting country<br />
for the selected product <strong>and</strong> which country applies this tariff<br />
Country: ___________ AVE Tariff the country applies to the exporting country: _________ %<br />
Note: Click on the tab “Compare Tariffs <strong>and</strong> Trade”. Select “the exporting country” as the<br />
exporter. Select the product at the HS-6 digit level. You can find the product by either typing<br />
the product code or name. Then select the match that appears in the drop-down menu. Click<br />
“Proceed”. You get a table showing all importing countries starting with “Albania”. If you click<br />
on the heading of the last second column “Level of Protection”, the table will be sorted<br />
showing countries applying the lowest rate of protection first. If you click on the heading of<br />
the column a second time, the table will be sorted showing countries applying the highest<br />
rate of protection first. If you click on the icon representing a map, the results will be<br />
displayed on a world map.<br />
68. Then compare the AVE tariff rates applied by the three attractive markets to the exporting<br />
<strong>and</strong> its main competitors (identified in question 35):<br />
Target<br />
Country<br />
Tariffs Ad<br />
Valorem<br />
Equivalent faced<br />
by the exporting<br />
country<br />
Competitors<br />
Tariffs Ad<br />
Valorem<br />
Equivalent<br />
faced by<br />
competitors<br />
AVE faced by<br />
exporting<br />
MINUS<br />
AVE faced by<br />
competitors<br />
A United<br />
States<br />
1.<br />
2.<br />
3.<br />
1.<br />
B<br />
2.<br />
3.<br />
1.<br />
C<br />
2.<br />
3.<br />
Note: Click on the tab “Compare Tariffs, select as the importer one of the three attractive<br />
markets identified in question 35. Select the product at the HS-6 digit. You will then get a<br />
table showing all exporting countries starting with “Albania”. Scroll down until you identify the<br />
names of the exporting country <strong>and</strong> the three main competitors in the attractive markets (also<br />
identified in question 35).
Practical exercice<br />
69. Is the tariff Ad Valorem Equivalent faced by the exporting country in the US different from<br />
the tariff identified at the national tariff line level in the US, in question 63 YES o NO<br />
If YES, why<br />
If NO, could it be different <br />
Comments:<br />
70. Do you have tariff advantages/disadvantages vis a vis your main competitors in the three<br />
target markets<br />
Comments:<br />
COUNTRY ANALYSIS<br />
In this module you can create a variety of tariff <strong>and</strong> trade reports on a country specific basis.<br />
Compare the average tariffs applied by different countries.<br />
71. What are the average tariffs applied by France, Japan <strong>and</strong> the USA to: all products;<br />
agricultural products; <strong>and</strong> industrial products<br />
Note: Open the “Country <strong>Analysis</strong>” module by clicking on it. It will become yellow. Select the<br />
country “France” from the drop-down list of countries. Click on the button located next to the<br />
heading “Average tariff applied by the country”. Click “Proceed”. The average tariffs applied<br />
by France to imported products will be displayed. To view other countries, it is not necessary<br />
to perform a new search. Just select the new country from the drop-down list <strong>and</strong> click on the<br />
button “change”.<br />
The average tariff applied by:<br />
France: all products = _____%; agricultural products = _____%; industrial products =<br />
_____%;<br />
Japan: all products = _____%; agricultural products = _____%; industrial products =<br />
_____%;<br />
USA: all products = _____%; agricultural products = _____%; industrial products =<br />
_____%;
Practical Exercise on INVESTMENT MAP<br />
Note: Please consider that not all types of data are available for all countries. As a result,<br />
you may not be able to respond to all questions. Hence, if some information is not available<br />
for a particular question, just leave the answer blank.<br />
COUNTRY SELECTION<br />
72. Select the country you would like to do your analysis on<br />
Note: When you log into the Investment Map portal you will see four modules, each of which<br />
are indicated by a tab at the top of the page. By default, you will be directed to the first<br />
module: “inward investment”. Select a country to analyze in the scroll down menu.<br />
Country: ______________________<br />
INTRODUCTION TO FDI DATA<br />
Consider FDI global trends <strong>and</strong> characteristics for the country you selected:<br />
Note: Please note that not all countries have reported their data for 2009 yet, therefore<br />
throughout this exercise, we will look at the last year for which data is available.<br />
73. How much FDI has this country attracted in the last available year<br />
Growth in value in US$:<br />
____________<br />
74. Indicate last year’s total inward stock<br />
Note: Inflows refer to the total amount of FDI undertaken over a given year whereas inward<br />
stock is the total accumulated value of foreign-owned assets over a given year.<br />
Value in US$: ____________<br />
75. Has FDI grown or declined on a yearly basis since 2006<br />
Value in %:<br />
____________<br />
76. How many foreign affiliates are established in the selected country Also, indicate the<br />
number of parent companies.<br />
______________ foreign affiliates <strong>and</strong> ____________ parent companies<br />
77. What is your interpretation<br />
Note: Respond to this question in the light of the answers to questions 72 <strong>and</strong> 76.<br />
____________________________________________________________________________<br />
____________________________________________________________________________
Practical exercice<br />
ANALYSE SECTORS WHICH HAVE A POTENTIAL TO ATTRACT INVESTMENT<br />
Identify industrial sectors for inward investment.<br />
Note: Continue to base your research on the country you selected in question 74.<br />
78. Which are the top three industrial sectors that have attracted the most investment in the<br />
last year for which data is available Please also indicate the exports’ <strong>and</strong> imports’ values<br />
for each industry, if they are available. For tertiary sectors trade data will not be available.<br />
Note: By default, economic activities (or industries) are ranked in descending order<br />
according to the amount of inward investment flows. Therefore, for the country which you<br />
have selected, the industries that have attracted the most foreign investment in the last year<br />
are displayed at the top of your screen.<br />
Industry Inflows in $US Exports in $US Imports in $US<br />
1.<br />
2.<br />
3.<br />
79. What type of activity (primary in yellow, secondary in blue, tertiary in pink) has attracted<br />
the most investment in the last year for which data is available Please also indicate<br />
exports’ <strong>and</strong> imports’ values for each type of activity.<br />
Note: You can analyze the information at the aggregate level, by type of activity (primary in<br />
yellow, secondary in blue, services in pink) by clicking on the sign “+” at the top of the left<br />
column.<br />
Type of activity Inflows in $US Exports in $US<br />
Imports in<br />
$US<br />
Primary<br />
Secondary<br />
Tertiary<br />
80. Which industrial sectors have exported the most Please also indicate inflows’ values for<br />
each industry.<br />
Note: Press the back button once. You can also sort the industries by different criteria (e.g.<br />
exports, number of foreign affiliates etc), by clicking on the arrow located next to the<br />
columns’ title which you want to rank. To answer this question, please click on the arrow<br />
related to exports.
Practical exercice<br />
Industry Export in $US Inflow $US<br />
81. Are FDI inflows concentrated in this country<br />
Note: To answer this question, please refer to the number of industries which have attracted<br />
FDI in your country <strong>and</strong> their respective shares of total FDI.<br />
__________________________________________________________________________<br />
__________________________________________________________________________<br />
__________________________________________________________________________<br />
82. Are the exports of this country concentrated Are these exports emanating from industries<br />
attracting the most FDI flows<br />
Note: To answer this question, please refer to the export value.<br />
__________________________________________________________________________<br />
__________________________________________________________________________<br />
__________________________________________________________________________<br />
83. Consider the number of foreign affiliates for these industries Please also indicate both<br />
inflows’ <strong>and</strong> exports’ values.<br />
Note: To sort the industries by number of foreign affiliates click on the arrow at the top of the<br />
column or on the link “number” located next to the arrow.<br />
Industry<br />
Number of<br />
Foreign<br />
Affiliates<br />
Inflows in<br />
$US<br />
Exports in<br />
$US<br />
1.<br />
2.<br />
3.<br />
84. What can you conclude from the historical data between FDI <strong>and</strong> trade flows<br />
Note: To answer this question look at <strong>and</strong> compare the evolution of both Exports <strong>and</strong> FDI<br />
growth <strong>and</strong> see if there is evidence of an emerging pattern.<br />
__________________________________________________________________________<br />
__________________________________________________________________________
Practical exercice<br />
HAVE ACCESS TO MICRO LEVEL INFORMATION<br />
Identify <strong>and</strong> find information on the companies established in the country you have<br />
selected.<br />
Note: Although not exhaustive, this data is a useful complement to the data on FDI (see data<br />
limitations).<br />
85. Which Multinational Corporations (MNC) have majority-owned foreign affiliates in industry<br />
A<br />
Note: Click on the “+” sign on the “Foreign Affiliates” heading, information on the activities of<br />
foreign affiliates located in the country is presented. The second column from the right shows<br />
the list of the leading parent companies for each industry. After clicking on the name of an<br />
industry’s leading parent company, you obtain a list showing all of the parent companies with<br />
affiliates in the country for that specific industry.<br />
Leading parent companies for Industry A<br />
1.<br />
2.<br />
3.<br />
4.<br />
5.<br />
Parent country<br />
Number of<br />
affiliates<br />
86. What can you tell about the concentration of the source of FDI in industry A<br />
Note: To answer this question, look at the country of origin of the main parent companies<br />
<strong>and</strong> see whether the FDI is concentrated. E.g. if 80% of FDI comes from only 2 sources, it is<br />
indeed concentrated.<br />
__________________________________________________________________________<br />
__________________________________________________________________________<br />
87. Write specific details for the leading foreign affiliate in the country for industry A.
Practical exercice<br />
Note: You can view even more details on each affiliate of the selected parent company by<br />
clicking on that affiliate.