Sediment transport in Warnbro Sound. - The University of Western ...
Sediment transport in Warnbro Sound. - The University of Western ...
Sediment transport in Warnbro Sound. - The University of Western ...

Create successful ePaper yourself
Turn your PDF publications into a flip-book with our unique Google optimized e-Paper software.
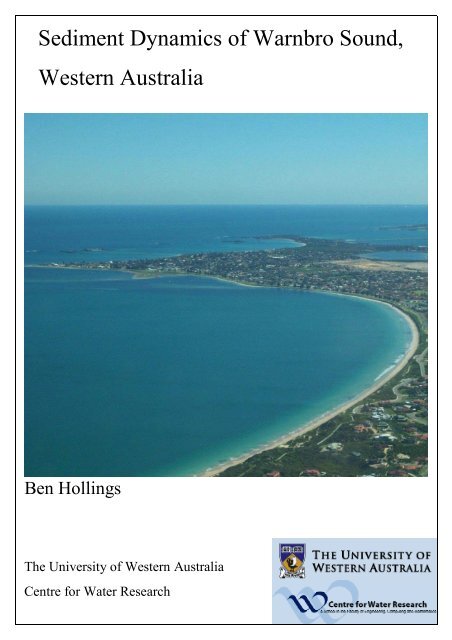
<strong>Sediment</strong> Dynamics <strong>of</strong> <strong>Warnbro</strong> <strong>Sound</strong>,<br />
<strong>Western</strong> Australia<br />
Ben Holl<strong>in</strong>gs<br />
<strong>The</strong> <strong>University</strong> <strong>of</strong> <strong>Western</strong> Australia<br />
Centre for Water Research
Cover Photo: <strong>Warnbro</strong> <strong>Sound</strong> from the south, September 2004 (courtesy <strong>of</strong> Stuart Barr)
27 Timewell Street<br />
DIANELLA<br />
WA 6059<br />
November 1, 2004<br />
<strong>The</strong> Dean,<br />
Faculty <strong>of</strong> Eng<strong>in</strong>eer<strong>in</strong>g<br />
<strong>The</strong> <strong>University</strong> <strong>of</strong> <strong>Western</strong> Australia,<br />
NEDLANDS,<br />
WA 6009<br />
Dear Sir,<br />
I have pleasure <strong>in</strong> submitt<strong>in</strong>g this thesis entitled “SEDIMENT DYNAMICS OF WARNBRO<br />
SOUND, WESTERN AUSTRALIA” as partial fulfilment for the comb<strong>in</strong>ed degree Bachelor <strong>of</strong><br />
Commerce (Investment F<strong>in</strong>ance) / Bachelor <strong>of</strong> Eng<strong>in</strong>eer<strong>in</strong>g (Applied Ocean Science) with<br />
Honours.<br />
Yours S<strong>in</strong>cerely,<br />
Ben Holl<strong>in</strong>gs
i<br />
CONTENTS<br />
CONTENTS...........................................................................................................................................................i<br />
FIGURES.............................................................................................................................................................iv<br />
TABLES...............................................................................................................................................................vi<br />
TABLES...............................................................................................................................................................vi<br />
ABSTRACT........................................................................................................................................................vii<br />
ACKNOWLEDGMENTS....................................................................................................................................ix<br />
1 INTRODUCTION .....................................................................................................................................10<br />
1.1 MOTIVATION ..................................................................................................................................10<br />
1.2 AIM ...................................................................................................................................................10<br />
1.3 OBJECTIVES ....................................................................................................................................10<br />
1.4 BACKGROUND (PREVIOUS STUDIES IN WARNBRO SOUND) ..................................................11<br />
1.4.1 Historical Surveys .....................................................................................................................11<br />
1.4.2 <strong>Sediment</strong> dynamics <strong>of</strong> <strong>Warnbro</strong> <strong>Sound</strong> (Pitchen, 1993)...............................................................14<br />
2 ENVIRONMENTAL SETTING ...............................................................................................................16<br />
2.1 LOCATION .......................................................................................................................................16<br />
2.2 GEOMORPHOLOGY........................................................................................................................17<br />
2.2.1 Formation <strong>of</strong> <strong>Warnbro</strong> <strong>Sound</strong> ....................................................................................................17<br />
2.2.2 Geomorphic Sett<strong>in</strong>g...................................................................................................................17<br />
2.3 METEOROLOGICAL CONDITIONS................................................................................................20<br />
2.3.1 Anticyclonic high pressure systems ............................................................................................20<br />
2.3.2 Mid latitude depressions............................................................................................................20<br />
2.3.3 Tropical cyclones ......................................................................................................................21<br />
2.3.4 Sea breeze .................................................................................................................................21<br />
2.3.5 Extreme w<strong>in</strong>d conditions............................................................................................................21
ii<br />
2.4 WAVE CLIMATE .............................................................................................................................23<br />
2.4.1 Offshore Wave Climate..............................................................................................................23<br />
2.4.2 Inshore Wave Climate................................................................................................................25<br />
2.5 LONG PERIOD WATER LEVEL FLUCTUATIONS ........................................................................27<br />
2.5.1 Storm Surges.............................................................................................................................27<br />
2.5.2 Seiches......................................................................................................................................28<br />
2.5.3 Cont<strong>in</strong>ental shelf waves .............................................................................................................29<br />
3 MORPHODYNAMICS RELEVANT TO WARNBRO SOUND..............................................................30<br />
3.1 TRANSVERSE SAND BAR DYNAMICS .........................................................................................30<br />
3.2 LONGSHORE TRANSPORT.............................................................................................................32<br />
3.3 SPIT DEVELOPMENT......................................................................................................................34<br />
3.4 DUNES..............................................................................................................................................36<br />
3.5 TOMBOLOS, SALIENTS & CUSPATE FORELANDS.....................................................................37<br />
4 METHODS ................................................................................................................................................39<br />
4.1 QUALITATIVE ESTIMATION OF NET SEDIMENT TRANSPORT................................................39<br />
4.1.1 Aerial Photographs ...................................................................................................................39<br />
4.2 NUMERICAL ESTIMATION OF LONGSHORE SEDIMENT TRANSPORT ...................................40<br />
4.2.1 Numerical modell<strong>in</strong>g <strong>of</strong> w<strong>in</strong>d wave generation...........................................................................41<br />
4.3 MODELLING THE EFFECT OF THE GARDEN ISLAND RIDGE ON SWELL...............................45<br />
4.3.1 REF/DIF1 Background..............................................................................................................45<br />
4.3.2 REF/DIF1 Inputs.......................................................................................................................46<br />
4.4 APPLICATION OF THE ‘PARABOLIC BAY SHAPE EQUATION’ TO TERN ISLAND.................47<br />
4.4.1 Parabolic bay shape equation....................................................................................................47<br />
5 RESULTS & DISCUSSION ......................................................................................................................49<br />
5.1 QUALITATIVE ESTIMATION OF SEDIMENT TRANSPORT ........................................................49
iii<br />
5.1.1 Coastl<strong>in</strong>e movement plots ..........................................................................................................49<br />
5.1.2 Aerial Photographs - <strong>in</strong>dicators <strong>of</strong> sediment dynamics ...............................................................51<br />
5.2 NUMERICAL ESTIMATION OF SEDIMENT TRANSPORT...........................................................56<br />
5.2.1 Annual <strong>transport</strong> volumes..........................................................................................................56<br />
5.2.2 Monthly Transport Volumes.......................................................................................................58<br />
5.2.3 Limitations <strong>of</strong> the numerical modell<strong>in</strong>g study .............................................................................59<br />
5.3 NET SEDIMENT TRANSPORT PATHWAYS ..................................................................................61<br />
5.3.1 Transport <strong>in</strong>to the <strong>Sound</strong> ...........................................................................................................61<br />
5.3.2 Transport with<strong>in</strong> the <strong>Sound</strong>........................................................................................................62<br />
5.4 TERN ISLAND SAND BAR..............................................................................................................66<br />
5.4.1 Formation, Migration & Ma<strong>in</strong>tenance .......................................................................................67<br />
5.4.2 Future <strong>of</strong> Tern Island.................................................................................................................69<br />
5.5 FUTURE SHORELINE CHANGE .....................................................................................................71<br />
5.5.1 Predicted future shorel<strong>in</strong>e changes ............................................................................................71<br />
5.5.2 Effect <strong>of</strong> predicted changes on exist<strong>in</strong>g coastal <strong>in</strong>frastructure.....................................................74<br />
6 CONCLUSIONS........................................................................................................................................76<br />
7 RECOMMENDATIONS...........................................................................................................................78<br />
8 REFERENCES ..........................................................................................................................................79<br />
APPENDICES.....................................................................................................................................................83<br />
APPENDIX A1 ...............................................................................................................................................83<br />
APPENDIX A2 ...............................................................................................................................................86<br />
APPENDIX A3 ...............................................................................................................................................88<br />
APPENDIX B .................................................................................................................................................90<br />
APPENDIX C.................................................................................................................................................94<br />
APPENDIX D...............................................................................................................................................100
iv<br />
FIGURES<br />
Figure 1.1: 1839 Survey <strong>of</strong> <strong>Warnbro</strong> <strong>Sound</strong> by J. S. Roe .......................................................... 12<br />
Figure 1.2: 1839 Survey <strong>of</strong> Peel Harbour by J. S. Roe............................................................... 13<br />
Figure 1.3: 1859 Survey <strong>of</strong> <strong>Warnbro</strong> <strong>Sound</strong> (Historical Plan No. 302) ...................................... 13<br />
Figure 2.1: Location map <strong>of</strong> <strong>Warnbro</strong> <strong>Sound</strong> (adapted from Searle & Sem<strong>in</strong>uik, 1988) ............ 16<br />
Figure 2.2: Bathymetry <strong>of</strong> <strong>Warnbro</strong> <strong>Sound</strong> (exaggerated vertical scale) .................................... 17<br />
Figure 2.3: 2004 Aerial photograph <strong>of</strong> <strong>Warnbro</strong> <strong>Sound</strong>............................................................. 18<br />
Figure 2.4: Swell wave roses for the summer months (November - April) and w<strong>in</strong>ter months<br />
(May - October) (from Lemm, 1996) ................................................................................ 24<br />
Figure 2.5: Seas wave roses for the summer months (November - April) and w<strong>in</strong>ter months (May<br />
- October) (from Lemm, 1996).......................................................................................... 24<br />
Figure 3.1: Landward formation and propagation <strong>of</strong> a transverse bar (adapted from Carter, 1988)<br />
......................................................................................................................................... 31<br />
Figure 3.2: L<strong>in</strong>ear spit development (from Silvester, 1987)....................................................... 35<br />
Figure 3.3: Progressive development <strong>of</strong> a l<strong>in</strong>ear spit (from Silvester, 1987) .............................. 35<br />
Figure 3.4: Parabolic Dunes (adapted from Bird, 1972) ............................................................ 37<br />
Figure 3.5: Tombolos, salients & cuspate forelands (adapted from Massel<strong>in</strong>k, 2003)................ 38<br />
Figure 4.1: SWAN wave modell<strong>in</strong>g design ............................................................................... 42<br />
Figure 4.2: Map <strong>of</strong> beach pr<strong>of</strong>ile sites....................................................................................... 44<br />
Figure 4.3: Map <strong>of</strong> sound<strong>in</strong>g pr<strong>of</strong>ile locations used................................................................... 44<br />
Figure 4.4: Wave–headland–beach relationship for a bayed beach <strong>in</strong> static equilibrium (from<br />
Kle<strong>in</strong>, 2003)...................................................................................................................... 48<br />
Figure 5.1: Areas <strong>of</strong> coastl<strong>in</strong>e movement plots.......................................................................... 49
v<br />
Figure 5.2: Photo show<strong>in</strong>g relevant <strong>in</strong>dicators <strong>of</strong> sediment dynamics........................................ 52<br />
Figure 5.3: Sand shoal meet<strong>in</strong>g the shore near Becher Po<strong>in</strong>t (2000) .......................................... 53<br />
Figure 5.4: Shore normal groyne <strong>in</strong> the south <strong>of</strong> <strong>Warnbro</strong> <strong>Sound</strong> (02/1987).............................. 54<br />
Figure 5.5: Shore normal groyne <strong>in</strong> the south <strong>of</strong> <strong>Warnbro</strong> <strong>Sound</strong> (11/1990).............................. 54<br />
Figure 5.6: <strong>Warnbro</strong> Beach Dunes (high resolution aerial photographs not available) ............... 54<br />
Figure 5.7: Pengu<strong>in</strong> Island Tombolo (2000).............................................................................. 55<br />
Figure 5.8: Estimated annual longshore <strong>transport</strong> volumes at each <strong>of</strong> the pr<strong>of</strong>ile sites (m 3 yr -1 ) .. 56<br />
Figure 5.9: Estimated annual longshore <strong>transport</strong> volumes at each <strong>of</strong> the sound<strong>in</strong>g sites (m 3 yr -1 )<br />
......................................................................................................................................... 57<br />
Figure 5.10: Estimated 2003 monthly longshore <strong>transport</strong> volumes (Pr<strong>of</strong>iles) ........................... 58<br />
Figure 5.11: Estimated 2003 monthly longshore <strong>transport</strong> volumes (<strong>Sound</strong><strong>in</strong>gs)....................... 59<br />
Figure 5.12: Conceptual model <strong>of</strong> net sediment <strong>transport</strong>.......................................................... 63<br />
Figure 5.13: Safety Bay 1942 ................................................................................................... 66<br />
Figure 5.14: Safety Bay 2004 ................................................................................................... 66<br />
Figure 5.15: REF/DIF1 Output for prevail<strong>in</strong>g swell .................................................................. 67<br />
Figure 5.16: Predicted equilibrium bay shape <strong>of</strong> the western side <strong>of</strong> Tern Island (1) ................. 71<br />
Figure 5.17: Predicted equilibrium bay shape <strong>of</strong> the western side <strong>of</strong> Tern Island (2) ................. 72<br />
Figure 5.18: Predicted equilibrium bay shape <strong>of</strong> the western side <strong>of</strong> Tern Island (3) ................. 72<br />
Figure 5.19: Predicted equilibrium bay shape <strong>of</strong> the eastern side <strong>of</strong> Tern Island........................ 73<br />
Figure 5.20: Current Safety Bay <strong>in</strong>frastructure.......................................................................... 74<br />
Figure 5.21: Waimea Street Boat Ramp .................................................................................... 75<br />
Figure 5.22: Safety Bay Yacht Club Jetty ................................................................................. 75
vi<br />
TABLES<br />
Table 2.1: Pr<strong>in</strong>cipal storm (extreme w<strong>in</strong>d) types <strong>in</strong> Cockburn <strong>Sound</strong> (from Steedman, 1982) ... 22<br />
Table 2.2: Estimated extreme wave heights for various return periods, <strong>of</strong>fshore from Perth <strong>in</strong><br />
48m <strong>of</strong> water (from Lemm, 1999) ..................................................................................... 25
vii<br />
ABSTRACT<br />
Development <strong>of</strong> coastal <strong>in</strong>frastructure requires a detailed understand<strong>in</strong>g <strong>of</strong> the coastal system.<br />
This understand<strong>in</strong>g must <strong>in</strong>corporate knowledge <strong>of</strong> historical behaviour as well as some<br />
predictions <strong>of</strong> future shorel<strong>in</strong>e change. Equipped with this <strong>in</strong>formation, coastal managers are<br />
able to mitigate problems associated with erosion and accretion <strong>of</strong> the coastal zone. In this<br />
context, the current study <strong>in</strong>vestigates past change and large scale sediment dynamics <strong>of</strong><br />
<strong>Warnbro</strong> <strong>Sound</strong>, a micro tidal coastal bas<strong>in</strong> <strong>in</strong> south-western Australia with a view to mak<strong>in</strong>g<br />
predictions <strong>of</strong> future change. Qualitative and quantitative methods were used to establish areas<br />
<strong>of</strong> change and the sediment dynamics <strong>of</strong> the <strong>Sound</strong>.<br />
Three key areas <strong>of</strong> shorel<strong>in</strong>e movement were identified with<strong>in</strong> the <strong>Sound</strong>: Safety Bay, Becher<br />
Po<strong>in</strong>t and Mersey Po<strong>in</strong>t. It was found that shorel<strong>in</strong>e change <strong>in</strong> the vic<strong>in</strong>ity <strong>of</strong> Becher Po<strong>in</strong>t and<br />
Mersey Po<strong>in</strong>t, both cuspate forelands, is likely to be due to changes <strong>in</strong> the direction <strong>of</strong> <strong>in</strong>cident<br />
wave energy through either breakdown <strong>of</strong> the Garden Island Ridge or altered weather patterns.<br />
<strong>The</strong> shorel<strong>in</strong>e change <strong>in</strong> Safety Bay is likely to be entirely due to the effect <strong>of</strong> the Tern Island<br />
sand bar. Its presence has both altered the wave field <strong>of</strong> the area and provided a significant<br />
sediment source. It is also important that there has been little change to the east <strong>of</strong> the sand bar<br />
while extensive accretion has occurred to its west.<br />
<strong>Sediment</strong> dynamics <strong>of</strong> the <strong>Sound</strong> were <strong>in</strong>vestigated and it was found that the large scale sediment<br />
dynamics are the result <strong>of</strong> a comb<strong>in</strong>ation <strong>of</strong> <strong>transport</strong> processes and can not simply be considered<br />
<strong>in</strong> terms <strong>of</strong> w<strong>in</strong>d wave driven longshore <strong>transport</strong>. <strong>The</strong> contributions <strong>of</strong> cross shore <strong>transport</strong>s<br />
along sand shoals on the north and south sand platforms as well as aeolian <strong>transport</strong> to the dunes<br />
<strong>in</strong> the central section <strong>of</strong> the <strong>Sound</strong> are both believed to be important <strong>in</strong> the consideration <strong>of</strong><br />
sediment sources and s<strong>in</strong>ks <strong>of</strong> the beach system. <strong>The</strong> effect <strong>of</strong> diffracted swell <strong>in</strong> caus<strong>in</strong>g an<br />
alongshore redistribution <strong>of</strong> sediment may also be important with the sediment dynamics <strong>of</strong> the<br />
region.<br />
<strong>The</strong> formation and evolution <strong>of</strong> the Tern Island sand bar was also <strong>in</strong>vestigated. It had been<br />
previously proposed that the Tern Island sand bar formed <strong>in</strong> a low energy zone created by the<br />
diffraction <strong>of</strong> swell waves pass<strong>in</strong>g through entrances <strong>in</strong> the Garden Island Ridge. This theory was<br />
tested us<strong>in</strong>g the comb<strong>in</strong>ed refraction – diffraction model REF/DIF1. It was found that under the<br />
prevail<strong>in</strong>g swell regime <strong>of</strong> SW waves with a period <strong>of</strong> 9 seconds and significant wave height <strong>of</strong> 2<br />
m, a zone <strong>of</strong> relatively low energy occurred <strong>in</strong> the area that the sandbar appeared to <strong>in</strong>itially
viii<br />
form. It was determ<strong>in</strong>ed that the sand bar would rema<strong>in</strong> a feature <strong>of</strong> Safety Bay <strong>in</strong>to the<br />
foreseeable future with possible spit formation from the tail <strong>of</strong> the bar suggest<strong>in</strong>g a return to a<br />
situation similar to that <strong>in</strong> 1839 where a partially vegetated sand spit enclosed a body <strong>of</strong> water<br />
termed Peel Harbour. In order to ga<strong>in</strong> a full <strong>in</strong>sight <strong>in</strong>to sediment dynamics <strong>of</strong> the <strong>Sound</strong> regular<br />
monitor<strong>in</strong>g is necessary at a range <strong>of</strong> scales.
ix<br />
ACKNOWLEDGMENTS<br />
I would like to thank my supervisors Dr Chari Pattiaratchi from the Department <strong>of</strong><br />
Environmental Eng<strong>in</strong>eer<strong>in</strong>g (Centre for Water Research) and Dr Ian Eliot from the Department<br />
<strong>of</strong> Geography for their support and guidance.<br />
Huge thanks must go to Ailbhe Travers for her cont<strong>in</strong>ual support, encouragement and assistance<br />
with field work.<br />
Rod Hoath, Steve Hearne and Stuart Barr from the Department <strong>of</strong> Plann<strong>in</strong>g and Infrastructure<br />
(DPI) are greatly acknowledged for supply<strong>in</strong>g aerial photograph data.<br />
And f<strong>in</strong>ally to my family and friends, Thankyou
1. Introduction 10<br />
1 INTRODUCTION<br />
1.1 Motivation<br />
Dur<strong>in</strong>g the past few decades significant change has occurred <strong>in</strong> the shorel<strong>in</strong>e planform <strong>of</strong> Safety<br />
Bay, <strong>in</strong> the north <strong>of</strong> <strong>Warnbro</strong> <strong>Sound</strong>. <strong>The</strong>se changes <strong>in</strong>clude a shift from erosion problems to<br />
those associated with accretion. In 1964 a rock wall was constructed to protect Arcadia Drive<br />
from the retreat<strong>in</strong>g shorel<strong>in</strong>e, now due to the effects <strong>of</strong> the Tern Island sand bar some jetties and<br />
boat ramps <strong>in</strong> Safety bay are unusable due to sedimentation.<br />
An understand<strong>in</strong>g <strong>of</strong> the large scale sediment dynamics <strong>of</strong> <strong>Warnbro</strong> <strong>Sound</strong> is necessary to enable<br />
predictions <strong>of</strong> future changes to the shorel<strong>in</strong>e planform. This <strong>in</strong>cludes understand<strong>in</strong>g the<br />
processes controll<strong>in</strong>g the key sediment movement pathways with<strong>in</strong> the <strong>Sound</strong> as well as the<br />
reasons beh<strong>in</strong>d the formation <strong>of</strong> the Tern Island sand bar. This will allow exist<strong>in</strong>g and proposed<br />
coastal <strong>in</strong>frastructure to be planned sufficiently to m<strong>in</strong>imise cont<strong>in</strong>ued problems associated with<br />
the dynamic coastl<strong>in</strong>e <strong>of</strong> the region.<br />
1.2 Aim<br />
<strong>The</strong> aim <strong>of</strong> this project is to <strong>in</strong>vestigate the large scale sediment dynamics <strong>of</strong> <strong>Warnbro</strong> <strong>Sound</strong> and<br />
to predict future shorel<strong>in</strong>e change. An additional aim <strong>of</strong> the study is to build on the work done<br />
by Pitchen (1993) <strong>in</strong>vestigat<strong>in</strong>g the formation and ma<strong>in</strong>tenance <strong>of</strong> the Tern Island sand bar.<br />
1.3 Objectives<br />
<strong>The</strong> follow<strong>in</strong>g objectives will be carried out to achieve these aims.<br />
• Evaluation <strong>of</strong> historical coastl<strong>in</strong>e change us<strong>in</strong>g aerial photograph records.<br />
• Qualitative estimation <strong>of</strong> net sediment <strong>transport</strong> pathways.<br />
• Estimation <strong>of</strong> longshore sediment <strong>transport</strong> volumes through the use <strong>of</strong> numerical<br />
modell<strong>in</strong>g techniques.
1. Introduction 11<br />
• Development <strong>of</strong> a conceptual model <strong>of</strong> net sediment movement <strong>in</strong> <strong>Warnbro</strong> <strong>Sound</strong> based<br />
upon past changes, qualitative observations and numerically estimated longshore<br />
<strong>transport</strong> rates.<br />
• Investigation <strong>of</strong> the formation, ma<strong>in</strong>tenance and migration <strong>of</strong> the Tern Island sand bar.<br />
• Prediction <strong>of</strong> future coastl<strong>in</strong>e change, particularly <strong>in</strong> the Safety Bay area.<br />
1.4 Background (Previous studies <strong>in</strong> <strong>Warnbro</strong> <strong>Sound</strong>)<br />
M<strong>in</strong>imal work has been carried out on the wave climate and sediment dynamics <strong>of</strong> <strong>Warnbro</strong><br />
<strong>Sound</strong>. While historical surveys were carried out <strong>in</strong> the 1800’s demonstrat<strong>in</strong>g the dynamic<br />
nature <strong>of</strong> the Safety Bay region, the only recent accounts are those given by Silvester (1987) <strong>in</strong> a<br />
review <strong>of</strong> the proposed Westport Canal Development, and Pascal Pitchen (1993) <strong>in</strong> an<br />
eng<strong>in</strong>eer<strong>in</strong>g honours thesis on the dynamics <strong>of</strong> the Tern Island sand bar. No studies have been<br />
undertaken to characterize the ma<strong>in</strong> sediment <strong>transport</strong> pathways with<strong>in</strong> the <strong>Sound</strong>. This is an<br />
important focus for coastal managers <strong>in</strong>terested <strong>in</strong> establish<strong>in</strong>g the long-term utility <strong>of</strong> coastal<br />
<strong>in</strong>frastructure <strong>in</strong> the study area.<br />
1.4.1 Historical Surveys<br />
Historical surveys <strong>of</strong> the <strong>Warnbro</strong> region are valuable <strong>in</strong> relation to the current study as they can<br />
be used as a basel<strong>in</strong>e for the coastl<strong>in</strong>e to be compared aga<strong>in</strong>st, particularly the Safety Bay region.<br />
<strong>The</strong> survey carried out by John Septimus Roe <strong>in</strong> 1839 (Figure 1.1 and Figure 1.2) shows the<br />
existence <strong>of</strong> a partially vegetated sand spit <strong>in</strong> the Safety Bay region, enclos<strong>in</strong>g a body <strong>of</strong> water<br />
termed Peel Harbour. <strong>The</strong> same survey also shows a large accumulation <strong>of</strong> sand to the west <strong>of</strong><br />
this spit. In the follow<strong>in</strong>g survey carried out <strong>in</strong> 1859 (Figure 1.3), it is evident that the sand spit<br />
has prograded to jo<strong>in</strong> the shorel<strong>in</strong>e, form<strong>in</strong>g an enclosed water body. Accord<strong>in</strong>g to Carrigy<br />
(1956) <strong>in</strong> the hydrographic chart based upon an 1878 survey <strong>of</strong> the area by Commander<br />
Archdeacon (figure not available for this study) there is no trace <strong>of</strong> the sand spit or Peel Harbour<br />
(Carrigy, 1956).<br />
This sequence <strong>of</strong> changes shows that a significant sand movement occurred <strong>in</strong> the Safety Bay<br />
region between 1859 and 1878. This change is particularly relevant to the current situation <strong>of</strong><br />
the Tern Island sand bar as it is believed to represent the <strong>in</strong>itial stages <strong>of</strong> the spit enclos<strong>in</strong>g Peel
1. Introduction 12<br />
Harbour. It may represent a long term cycle <strong>of</strong> sand movement, this will be discussed <strong>in</strong> further<br />
detail later (section 5.4, p66).<br />
Figure 1.1: 1839 Survey <strong>of</strong> <strong>Warnbro</strong> <strong>Sound</strong> by J. S. Roe
1. Introduction 13<br />
Figure 1.2: 1839 Survey <strong>of</strong> Peel Harbour by J. S. Roe<br />
Figure 1.3: 1859 Survey <strong>of</strong> <strong>Warnbro</strong> <strong>Sound</strong> (Historical Plan No. 302)
1. Introduction 14<br />
1.4.2 <strong>Sediment</strong> dynamics <strong>of</strong> <strong>Warnbro</strong> <strong>Sound</strong> (Pitchen, 1993)<br />
<strong>The</strong> major outcome from Pitchen’s study was the suggestion <strong>of</strong> a likely reason for the Tern<br />
Island sand bar’s <strong>in</strong>itial formation. He proposed that the sand bar “formed as a result <strong>of</strong><br />
dom<strong>in</strong>ant south-westerly swell waves enter<strong>in</strong>g <strong>Warnbro</strong> <strong>Sound</strong> through selective reef entrances<br />
and diffract<strong>in</strong>g and refract<strong>in</strong>g, result<strong>in</strong>g, result<strong>in</strong>g <strong>in</strong> low energy zones <strong>in</strong> which sediment<br />
deposition occurs”.<br />
Another significant f<strong>in</strong>d<strong>in</strong>g was the relationship between the shape and size <strong>of</strong> the bar and the<br />
occurrence <strong>of</strong> storm events. It was concluded that “the time history <strong>of</strong> the sand bar can be<br />
related to the presence or absence <strong>of</strong> recent storm events” suggest<strong>in</strong>g that “a dramatic <strong>in</strong>crease <strong>in</strong><br />
the size <strong>of</strong> the sand bank would <strong>in</strong>dicate that a SW storm had recently occurred” and that “a<br />
reduction <strong>in</strong> the sand bank’s size would <strong>in</strong>dicate that south-westerly storms were less frequent<br />
and/or that recent NW storms had damaged the structure <strong>of</strong> the sand bank”. This was suggested<br />
based upon sand bank changes and the theory <strong>of</strong> formation and ma<strong>in</strong>tenance; however the<br />
relationship is not backed up with any data. (ie: storm occurrences). While this theory hold some<br />
merit, it is unlikely that a reduction <strong>in</strong> size will occur due to less frequent SW storms, based upon<br />
the swell driven ma<strong>in</strong>tenance mechanism (see section 3.1, p30). He also found that “Follow<strong>in</strong>g<br />
periods <strong>of</strong> <strong>in</strong>creased NW swell <strong>in</strong>cidence, the sand bank atta<strong>in</strong>s a crescentic or S-shaped form”<br />
these shapes are likely to be related to not only the occurrence <strong>of</strong> NW storms but also the<br />
sequence <strong>of</strong> wave directions due to storm events and calm periods.<br />
Pitchen (1993) exam<strong>in</strong>ed the possible sediment sources for the sand bar and <strong>in</strong>itially identified<br />
six possible sources: sands eroded from the Pengu<strong>in</strong> Island tombolo; sands released from the<br />
depletion <strong>of</strong> seagrass beds; bare sands <strong>of</strong> the north and south sand platforms; sediments<br />
<strong>transport</strong>ed from regions south <strong>of</strong> <strong>Warnbro</strong> <strong>Sound</strong>; and sediments orig<strong>in</strong>at<strong>in</strong>g from with<strong>in</strong>, and<br />
seaward <strong>of</strong> the Garden Island Ridge. He discounted sands eroded from the tombolo and sands<br />
released from the depletion <strong>of</strong> seagrass beds as major sources. He also discarded the possibility<br />
that the sand came from bare sand patches <strong>of</strong> sand on the north and south sands platforms on the<br />
grounds that the 1839 survey shows “the north and south sands to be significantly smaller <strong>in</strong><br />
1837 than is currently the case”. However this is <strong>in</strong>accurate due to mis<strong>in</strong>terpretation <strong>of</strong> the ‘sand<br />
shoals’ shown on the survey as the sand platforms when <strong>in</strong> actual fact the sand platforms have<br />
been near to their current size and have not changed much over the past thousand years (Searle et<br />
al., 1988). It is likely that sands redistributed from these platforms can be a viable source to the<br />
sand bar. Upon consider<strong>in</strong>g the sediment supply possibilities the conclusion was reached that
1. Introduction 15<br />
“In terms <strong>of</strong> sediment supplies, the majority can be expected to orig<strong>in</strong>ate from the south <strong>of</strong><br />
<strong>Warnbro</strong> <strong>Sound</strong> and from the direction <strong>of</strong> the reef system”, no consideration was given to how<br />
the sand reaches the region <strong>of</strong> sand bar formation, which is as important as the source.<br />
<strong>The</strong> current study aims to verify Pitchen’s (1993) proposed method <strong>of</strong> <strong>in</strong>itial sand bar formation<br />
as well as give further consideration to the sediment sources and ma<strong>in</strong>tenances mechanisms <strong>of</strong><br />
the sand bar.
2. Environmental Sett<strong>in</strong>g 16<br />
2 ENVIRONMENTAL SETTING<br />
2.1 Location<br />
<strong>Warnbro</strong> <strong>Sound</strong> is a coastal bas<strong>in</strong> located between 32.30°S and 32.37°S, approximately 30km<br />
south <strong>of</strong> Fremantle <strong>in</strong> south-western Australia.<br />
Figure 2.1: Location map <strong>of</strong> <strong>Warnbro</strong> <strong>Sound</strong> (adapted from Searle & Sem<strong>in</strong>uik, 1988)
2. Environmental Sett<strong>in</strong>g 17<br />
2.2 Geomorphology<br />
2.2.1 Formation <strong>of</strong> <strong>Warnbro</strong> <strong>Sound</strong><br />
<strong>The</strong> Holocene evolution <strong>of</strong> the <strong>Sound</strong> is important <strong>in</strong> the consideration <strong>of</strong> the present sediment<br />
dynamics. While the dynamics <strong>of</strong> the system have changed as it has evolved, the ma<strong>in</strong> controls<br />
<strong>of</strong> the large scale sediment dynamics have consistently been the <strong>in</strong>teraction <strong>of</strong> <strong>of</strong>fshore wave<br />
energy with the erod<strong>in</strong>g ridge systems, the abundant supply <strong>of</strong> sediments and the evolv<strong>in</strong>g bank<br />
structures (Searle et al., 1988). <strong>The</strong> <strong>in</strong>cremental development pattern <strong>of</strong> <strong>Warnbro</strong> <strong>Sound</strong> over the<br />
Holocene established by Searle et al. (1988) gives an <strong>in</strong>dication that the major sediment source<br />
to the <strong>Sound</strong> has been and is still likely to be from south <strong>of</strong> the <strong>Sound</strong> (Searle et al., 1988).<br />
2.2.2 Geomorphic Sett<strong>in</strong>g<br />
<strong>The</strong> geomorphology <strong>of</strong> the <strong>Warnbro</strong> region is primarily controlled by a series <strong>of</strong> shore parallel<br />
Pleistocene aeolianite ridges and the associated depressions; Five Fathom Bank Ridge; Sepia<br />
Depression; Garden Island Ridge; Cockburn – <strong>Warnbro</strong> Depression; and Spearwood Ridge from<br />
west to east (Figure 2.1 and Figure 2.2) (Searle et al., 1988). <strong>The</strong> ridges <strong>in</strong> the area almost<br />
completely protect the <strong>Sound</strong> from <strong>of</strong>fshore swell (Carrigy, 1956).<br />
Figure 2.2: Bathymetry <strong>of</strong> <strong>Warnbro</strong> <strong>Sound</strong> (exaggerated vertical scale)
2. Environmental Sett<strong>in</strong>g 18<br />
<strong>Warnbro</strong> <strong>Sound</strong> is approximately 7 km long and 4 km wide consist<strong>in</strong>g <strong>of</strong> three ma<strong>in</strong> sectors: the<br />
central deep bas<strong>in</strong> and two extensive banks, the north and south sands platforms. <strong>The</strong> central<br />
bas<strong>in</strong> has a relatively flat bottom with an average depth <strong>of</strong> approximately 17 m while the depth<br />
<strong>of</strong> the north sands platform ranges from 1 – 4 m and the south sands platform from 1 – 9 m. <strong>The</strong><br />
shallow sections (north and south platforms) conta<strong>in</strong> deposits <strong>of</strong> clean sands colonised by<br />
seagrasses while f<strong>in</strong>e organic muds are deposited with<strong>in</strong> the central bas<strong>in</strong> (Carrigy, 1956).<br />
Figure 2.3: 2004 Aerial photograph <strong>of</strong> <strong>Warnbro</strong> <strong>Sound</strong>
2. Environmental Sett<strong>in</strong>g 19<br />
Front<strong>in</strong>g the cental bas<strong>in</strong> is <strong>Warnbro</strong> Beach, a narrow beach with a small <strong>of</strong>fshore platform. It is<br />
characterised by a s<strong>in</strong>gle high foredune <strong>in</strong> the central part <strong>of</strong> the beach, <strong>in</strong>terrupted by blowouts<br />
and parabolic dunes. <strong>The</strong> planform <strong>of</strong> the <strong>Warnbro</strong> Beach coastl<strong>in</strong>e has rema<strong>in</strong>ed static for a<br />
long period <strong>of</strong> time due to controls exerted by the Garden Island Ridge result<strong>in</strong>g <strong>in</strong> the normal<br />
approach <strong>of</strong> the <strong>in</strong>cident swell waves (Silvester, 1987). Silvester (1987) suggested that <strong>Warnbro</strong><br />
Beach is <strong>in</strong> a state <strong>of</strong> ‘static equilibrium’. This is questionable s<strong>in</strong>ce, while there is a zero net<br />
sediment balance, significant sediment movement does occur, suggest<strong>in</strong>g that ‘dynamic<br />
equilibrium’ is more likely.<br />
A tombolo extends from Pengu<strong>in</strong> Island to Mersey Po<strong>in</strong>t. It is formed by the diffraction <strong>of</strong> swell<br />
waves around Pengu<strong>in</strong> Island. Carrigy (1956) drew attention to the seasonal changes<br />
experienced by the Pengu<strong>in</strong> Island tombolo, generally be<strong>in</strong>g hooked to the north dur<strong>in</strong>g the<br />
summer and to the south dur<strong>in</strong>g the w<strong>in</strong>ter, possibly demonstrat<strong>in</strong>g a seasonal change to the<br />
longshore <strong>transport</strong> direction (Carrigy, 1956).<br />
In the northern section <strong>of</strong> the <strong>Sound</strong> (Safety Bay) a significant feature is the Tern Island sand<br />
bar, a transverse sand bar, which has developed over the past 60+ years. This sandbar has<br />
moved shoreward and jo<strong>in</strong>ed the Safety Bay coastl<strong>in</strong>e, becom<strong>in</strong>g a dom<strong>in</strong>ant feature <strong>of</strong> the area,<br />
considerably affect<strong>in</strong>g the shorel<strong>in</strong>e movement <strong>in</strong> its vic<strong>in</strong>ity. <strong>The</strong> formation and ma<strong>in</strong>tenance <strong>of</strong><br />
the Tern Island sand bar will be considered <strong>in</strong> more detail <strong>in</strong> 5.4, page 66.<br />
Another older sand bar exists to the east <strong>of</strong> the Tern Island sand bar. This has rema<strong>in</strong>ed<br />
unchanged over the past few decades and has been partially stabilised by seagrasses. This will<br />
henceforth be termed the Berry Street sand bar.<br />
Becher Po<strong>in</strong>t <strong>in</strong> the south and Mersey Po<strong>in</strong>t <strong>in</strong> the north are two entirely sedimentary cuspate<br />
forelands which are ma<strong>in</strong>ta<strong>in</strong>ed by the <strong>in</strong>teraction <strong>of</strong> swell waves with the Garden island Ridge.<br />
Two prom<strong>in</strong>ent salients exist at the northern and southern ends <strong>of</strong> <strong>Warnbro</strong> Beach; these too are<br />
a result <strong>of</strong> swell <strong>in</strong>teraction with the Garden Island Ridge (Silvester, 1987).
2. Environmental Sett<strong>in</strong>g 20<br />
2.3 Meteorological Conditions<br />
<strong>The</strong> prevail<strong>in</strong>g w<strong>in</strong>d climate <strong>of</strong> the Perth region is governed by an eastward mov<strong>in</strong>g subtropical<br />
belt <strong>of</strong> high pressure systems throughout the year. W<strong>in</strong>ter conditions are characterised by<br />
periodic storm events associated with mid latitude depressions and summer conditions by the<br />
highly energetic sea breeze system (Massel<strong>in</strong>k & Pattiaratchi, 2001).<br />
2.3.1 Anticyclonic high pressure systems<br />
<strong>The</strong> natural breakdown <strong>of</strong> the high pressure belt <strong>in</strong>to eastward mov<strong>in</strong>g anticyclonic cells, results<br />
<strong>in</strong> a prevail<strong>in</strong>g anticlockwise air circulation <strong>in</strong> this region. <strong>The</strong>se systems pass the coast with a<br />
period <strong>of</strong> 3 – 10 days (Gentilli, 1972). Dur<strong>in</strong>g summer the high pressure belt is located between<br />
latitudes <strong>of</strong> 35-45°S, it moves northward dur<strong>in</strong>g autumn such that dur<strong>in</strong>g w<strong>in</strong>ter it is located<br />
between 26-34°S, it then returns southward dur<strong>in</strong>g the spr<strong>in</strong>g. This seasonal movement <strong>of</strong> the<br />
high pressure belt results <strong>in</strong> summer westerlies (onshore) and w<strong>in</strong>ter easterlies (<strong>of</strong>fshore) due to<br />
the anticyclonic circulation <strong>of</strong> the high pressure cells (Massel<strong>in</strong>k & Pattiaratchi 2001). Another<br />
result <strong>of</strong> the prevail<strong>in</strong>g circulation is the existence <strong>of</strong> ‘calms’ or light w<strong>in</strong>ds for considerable<br />
periods, these occur throughout the year (Gentilli, 1972).<br />
2.3.2 Mid latitude depressions<br />
Dur<strong>in</strong>g summer mid latitude depressions, also termed ‘extra tropical cyclones’, are located too<br />
far south to directly affect the climatic conditions <strong>of</strong> the Perth region. However, dur<strong>in</strong>g the<br />
w<strong>in</strong>ter months, the mid latitude depressions and the storms associated with them have a direct<br />
impact upon the region due to the northward displacement <strong>of</strong> the subtropical high pressure belt.<br />
<strong>The</strong>se storms are most frequent dur<strong>in</strong>g the month <strong>of</strong> July <strong>in</strong> which, on average, 3 occur per year<br />
(Gentilli, 1971).<br />
W<strong>in</strong>ds experienced dur<strong>in</strong>g the advance <strong>of</strong> a mid latitude depression are firstly from the north<br />
then shift to the northwest while <strong>in</strong>creas<strong>in</strong>g <strong>in</strong> <strong>in</strong>tensity. <strong>The</strong>se north-westerly w<strong>in</strong>ds are usually<br />
accompanied by strong gusts (Lemm et al., 1999). <strong>The</strong> w<strong>in</strong>ds then shift rapidly to westerly then<br />
south westerly as the depression passes the coast. <strong>The</strong>se conditions then may cont<strong>in</strong>ue for up to<br />
36 hours before slowly moderat<strong>in</strong>g (Massel<strong>in</strong>k & Pattiaratchi, 2001). Typical average w<strong>in</strong>d<br />
speeds experienced dur<strong>in</strong>g mid latitude depressions range from 15 – 29 ms -1 with durations <strong>of</strong><br />
between 10 and 40 hours (Steedman, 1982). While the strongest w<strong>in</strong>ds are from the NW, w<strong>in</strong>ds<br />
from the W and SW may be <strong>of</strong> greater duration (Silvester, 1987).
2. Environmental Sett<strong>in</strong>g 21<br />
2.3.3 Tropical cyclones<br />
Tropical cyclones are <strong>in</strong>tense low pressure systems which form <strong>of</strong>f the coast <strong>of</strong> northern <strong>Western</strong><br />
Australia dur<strong>in</strong>g the summer. Based on mean 10 year frequencies, Gentilli (1971) showed there<br />
to be a likelihood <strong>of</strong> one tropical cyclone every 10 years directly affect<strong>in</strong>g the Perth region,<br />
occurr<strong>in</strong>g dur<strong>in</strong>g the month <strong>of</strong> February (Gentilli, 1971). Although much <strong>of</strong> their energy has<br />
been dissipated before reach<strong>in</strong>g the Perth region, tropical cyclones can still have a significant<br />
effect on the beach morphology. For example <strong>in</strong> 1978 Perth beaches were subject to extensive<br />
erosion due to the pass<strong>in</strong>g <strong>of</strong> tropical cyclone Alby (Lemm, 1996).<br />
2.3.4 Sea breeze<br />
<strong>The</strong> south-west Australian coast has one <strong>of</strong> the strongest sea breeze systems <strong>in</strong> the world with<br />
w<strong>in</strong>ds frequently exceed<strong>in</strong>g 15 ms -1 with maximums <strong>of</strong> up to 20 ms -1 and a mean velocity <strong>of</strong> 8<br />
ms -1 at the coastl<strong>in</strong>e (Pattiaratchi et al., 1997; Massel<strong>in</strong>k & Pattiaratchi, 2000). W<strong>in</strong>d speeds due<br />
to the sea breeze along the south-western Australian coastl<strong>in</strong>e <strong>of</strong>ten approach storm w<strong>in</strong>d<br />
<strong>in</strong>tensities (Gentilli, 1971). And the sea breeze has been shown to be present more than 60% <strong>of</strong><br />
the time dur<strong>in</strong>g the summer months (Massel<strong>in</strong>k & Pattiaratchi, 2001).<br />
<strong>The</strong> sea breeze system <strong>in</strong> this region is somewhat different to the ‘classical’ system <strong>in</strong> that it<br />
blows <strong>in</strong> a predom<strong>in</strong>ately alongshore direction (from the south – southwest) as opposed to<br />
onshore. S<strong>in</strong>ce the w<strong>in</strong>ds blow obliquely to the coastl<strong>in</strong>e, rather than normal to it, the w<strong>in</strong>d<br />
waves generated by the breeze can generate a significant longshore current and the resultant<br />
littoral drift (Massel<strong>in</strong>k & Pattiaratchi, 2001). In late summer – autumn the energy <strong>of</strong> sea breeze<br />
generated w<strong>in</strong>d waves may exceed that <strong>of</strong> the prevail<strong>in</strong>g swell (Hegge et al., 1996).<br />
A study by Pattiaratchi et al. (1997) showed that <strong>in</strong> coastal regions sheltered from the direct<br />
impact <strong>of</strong> storm and swell wave activity, such as <strong>Warnbro</strong> <strong>Sound</strong>, locally generated w<strong>in</strong>d waves,<br />
<strong>in</strong> particular those associated with strong sea breeze activity, play a dom<strong>in</strong>ant role <strong>in</strong> controll<strong>in</strong>g<br />
nearshore and foreshore processes (Pattiaratchi et al., 1997).<br />
2.3.5 Extreme w<strong>in</strong>d conditions<br />
Extreme w<strong>in</strong>d conditions are <strong>of</strong> paramount importance to nearshore processes. <strong>The</strong>y impart<br />
<strong>in</strong>creased energy to the coastal zone and as such are the dom<strong>in</strong>ant control <strong>in</strong> sediment <strong>transport</strong><br />
with<strong>in</strong> the littoral zone. Extreme w<strong>in</strong>d conditions <strong>in</strong> the study area <strong>in</strong>clude storm w<strong>in</strong>ds,
2. Environmental Sett<strong>in</strong>g 22<br />
generated primarily by mid latitude depressions and sea breezes which <strong>of</strong>ten approach storm<br />
w<strong>in</strong>d <strong>in</strong>tensities (Gentilli, 1971).<br />
An account <strong>of</strong> the pr<strong>in</strong>cipal storm w<strong>in</strong>ds experienced <strong>in</strong> Cockburn <strong>Sound</strong>, located directly to the<br />
north <strong>of</strong> <strong>Warnbro</strong> <strong>Sound</strong> is given by Steedman (1982). This is outl<strong>in</strong>ed <strong>in</strong> Table 2.1, below,<br />
which shows that storms due to extra tropical cyclones (mid latitude depressions) generally have<br />
the longest duration and highest average w<strong>in</strong>d speeds, hence the greatest effect on coastal<br />
processes (Steedman, 1982).<br />
Table 2.1: Pr<strong>in</strong>cipal storm (extreme w<strong>in</strong>d) types <strong>in</strong> Cockburn <strong>Sound</strong> (from Steedman, 1982)<br />
Storm type<br />
Pr<strong>in</strong>ciple months <strong>of</strong><br />
occurrence<br />
Typical storm average<br />
w<strong>in</strong>d speed &<br />
duration<br />
Typical extreme 30<br />
m<strong>in</strong> average w<strong>in</strong>d<br />
speeds<br />
Typical w<strong>in</strong>d direction<br />
10 - 25 ms -1<br />
All Directions<br />
Dissipat<strong>in</strong>g tropical<br />
December - April 25 - 30 ms<br />
cyclone<br />
-1 (dependant on eye<br />
5 - 15 hours<br />
location)<br />
15 - 20 ms -1<br />
Squalls December - April 25 ms -1 All Directions<br />
2 - 4 hours<br />
Extra tropical<br />
cyclones ("Gales")<br />
Tornadoes ("Cock-<br />
Eye-Bobs") †<br />
15 - 29 ms -1<br />
May - October 20 - 25 ms -1 South south-west to<br />
10 - 40 hours<br />
north<br />
15 - 25 () ms -1<br />
December - April 30 () ms -1 All Directions<br />
< 1 hour<br />
10 - 25 ms -1<br />
Thunderstorms December - April 15 ms -1 All Directions<br />
1 - 2 hours<br />
† no measurements (estimated)<br />
A record <strong>of</strong> the number <strong>of</strong> storms occurr<strong>in</strong>g <strong>in</strong> the region over an unspecified 15 year period was<br />
compiled by Silvester (1987) show<strong>in</strong>g an annual average <strong>of</strong> 8 storms per year. However over the<br />
period the frequency varied from 4 to 12 storms per year, demonstrat<strong>in</strong>g a considerable <strong>in</strong>terannual<br />
variation. From this it follows that there will be the equivalent <strong>in</strong>ter-annual variation <strong>in</strong><br />
the effect <strong>of</strong> storms on coastal processes (Silvester, 1987).<br />
Long term variations <strong>in</strong> patterns <strong>of</strong> storm<strong>in</strong>ess and climatic changes <strong>in</strong> general may have a<br />
pr<strong>of</strong>ound effect on coastal stability. <strong>The</strong>se changes may <strong>in</strong>volve a change <strong>in</strong> storm direction,<br />
storm frequency or storm <strong>in</strong>tensity (Carter, 1988).
2. Environmental Sett<strong>in</strong>g 23<br />
2.4 Wave Climate<br />
2.4.1 Offshore Wave Climate<br />
<strong>The</strong> <strong>of</strong>fshore wave conditions <strong>of</strong>f Perth can be considered representative <strong>of</strong> <strong>of</strong>fshore wave<br />
conditions for up to 200 km both north and south <strong>of</strong> Perth, which <strong>in</strong>cludes those <strong>of</strong>f <strong>Warnbro</strong><br />
<strong>Sound</strong>. This is due to generation <strong>of</strong> deep ware waves by large scale weather systems over the<br />
Indian and Southern Oceans result<strong>in</strong>g <strong>in</strong> little spatial variation <strong>in</strong> the deep water wave climate<br />
(Lemm et al., 1999).<br />
<strong>The</strong> <strong>of</strong>fshore wave climate <strong>of</strong> the Perth region is characterised by moderate energy swell from<br />
the south to southwest and was described by Massel<strong>in</strong>k & Pattiaratchi (2001) us<strong>in</strong>g four years<br />
(1995-1998) <strong>of</strong> hourly, non-directional, sea surface elevation data, measured us<strong>in</strong>g the wave<br />
rider buoy located to the south-west <strong>of</strong> Rottnest Island <strong>in</strong> a water depth <strong>of</strong> 48 m. From this<br />
study, <strong>of</strong>fshore waves were found to be characterised by an annual mean significant wave height<br />
<strong>of</strong> 2.2 m and period <strong>of</strong> 8.8 s (Massel<strong>in</strong>k & Pattiaratchi, 2001). A similar outcome was obta<strong>in</strong>ed<br />
<strong>in</strong> a study by Lemm et al. (1999) which used 2.5 years (from March 1994 – August 1996) <strong>of</strong> 20<br />
m<strong>in</strong>, non-directional, sea surface elevation data which was measured us<strong>in</strong>g the same wave rider<br />
buoy and found an annual mean significant wave height <strong>of</strong> 2.0 m and annual mean period <strong>of</strong> 8.8s<br />
(Lemm et al., 1999).<br />
<strong>The</strong> <strong>of</strong>fshore wave climate <strong>of</strong> the Perth region is characterised by extreme seasonality. <strong>The</strong><br />
mean significant wave conditions experienced dur<strong>in</strong>g the summer period (December – February)<br />
were found to be a wave height <strong>of</strong> 1.8 m and a period <strong>of</strong> 7.6 s, differ<strong>in</strong>g noticeably to those <strong>of</strong> the<br />
w<strong>in</strong>ter period (June – August) where a mean wave height <strong>of</strong> 2.8 m and mean period <strong>of</strong> 9.7 s was<br />
found (Massel<strong>in</strong>k & Pattiaratchi, 2001). This <strong>in</strong>tra-annual variation was also observed by Lemm<br />
et al. (1999) who found that wave heights were lower, and varied over a lesser range <strong>in</strong> summer<br />
than <strong>in</strong> w<strong>in</strong>ter. It was also concluded that there is a seasonal change from moderate locally<br />
generated seas <strong>in</strong> summer, to larger swell and locally generated storm waves <strong>in</strong> w<strong>in</strong>ter,<br />
co<strong>in</strong>cid<strong>in</strong>g with the seasonal w<strong>in</strong>d pattern <strong>of</strong> the summer sea breeze and the pass<strong>in</strong>g <strong>of</strong> mid<br />
latitude depressions dur<strong>in</strong>g the w<strong>in</strong>ter (Lemm et al., 1999).<br />
S<strong>in</strong>ce swell waves are generated <strong>in</strong> the distant Indian and Southern oceans by mid latitude<br />
depression systems, the seasonal north and south movement <strong>of</strong> these systems due to the seasonal<br />
migration <strong>of</strong> the subtropical high pressure belt alters the swell approach direction. Dur<strong>in</strong>g the<br />
summer months, swell waves arrive primarily from the south southwest, while dur<strong>in</strong>g the w<strong>in</strong>ter
2. Environmental Sett<strong>in</strong>g 24<br />
months they arrive from the west – southwest (Lemm et al., 1999). This is also demonstrated <strong>in</strong><br />
the wave roses shown <strong>in</strong> Figure 2.4. <strong>The</strong> only available long term account <strong>of</strong> <strong>of</strong>fshore wave<br />
direction for south-western Australia is provided by Scott (1980) who tabulated 18 years <strong>of</strong> sea<br />
and swell observations obta<strong>in</strong>ed from ship sea state observations carried out <strong>in</strong> the ocean<br />
approaches to Fremantle from the period 1950 – 1967. This data was used by Lemm (1996) to<br />
create wave roses which show relative frequencies <strong>of</strong> sea and swell directions (Lemm, 1996).<br />
Figure 2.4: Swell wave roses for the summer months (November - April) and w<strong>in</strong>ter months (May - October)<br />
(from Lemm, 1996)<br />
Seas or locally generated w<strong>in</strong>d waves generally reta<strong>in</strong> similar direction to that <strong>of</strong> the w<strong>in</strong>ds<br />
which generated them. <strong>The</strong>refore seasonal changes to the seas will correspond to seasonal<br />
changes <strong>in</strong> the w<strong>in</strong>d field. In Figure 2.5 this is evident as summer seas have a consistent<br />
southerly direction and are clearly dom<strong>in</strong>ated by the southerly sea breeze, while the w<strong>in</strong>ter seas<br />
directions show more variability due to be<strong>in</strong>g generated primarily by the passage <strong>of</strong> storms, the<br />
w<strong>in</strong>d direction s <strong>of</strong> which vary, primarily between SW and NW.<br />
Figure 2.5: Seas wave roses for the summer months (November - April) and w<strong>in</strong>ter months (May - October)<br />
(from Lemm, 1996)
2. Environmental Sett<strong>in</strong>g 25<br />
2.4.1.1 Extreme <strong>of</strong>fshore wave conditions<br />
An extreme wave analysis <strong>of</strong> the <strong>of</strong>fshore Perth wave climate was conducted by Lemm et al.<br />
(1999) based on 12 years <strong>of</strong> storm wave data (<strong>in</strong>clud<strong>in</strong>g 112 storms) us<strong>in</strong>g the conditional<br />
Weibull method. From this analysis extreme <strong>of</strong>fshore wave heights for various return periods<br />
could be estimated and the f<strong>in</strong>d<strong>in</strong>gs are given <strong>in</strong> Table 2.2, below (Lemm et al., 1999).<br />
Table 2.2: Estimated extreme wave heights for various return periods, <strong>of</strong>fshore from Perth <strong>in</strong> 48m <strong>of</strong> water<br />
(from Lemm, 1999)<br />
Return period (years)<br />
Estimated <strong>of</strong>fshore Hs (m)<br />
1 6.7<br />
2 7.2<br />
5 7.8<br />
10 8.3<br />
25 8.9<br />
50 9.4<br />
100 9.8<br />
2.4.2 Inshore Wave Climate<br />
<strong>The</strong> <strong>in</strong>shore region <strong>of</strong> <strong>Warnbro</strong> <strong>Sound</strong> is almost completely protected from <strong>of</strong>fshore wave energy<br />
by the shore parallel <strong>of</strong>fshore limestone reef systems discussed earlier (Five Fathom Bank &<br />
Garden Island Ridge) (Carrigy, 1956). Due to the effects <strong>of</strong> refraction and dissipation at the reef,<br />
no energy will be transmitted past it. Thus, the only energy which can enter the <strong>Sound</strong> is<br />
through the major gaps <strong>in</strong> the reef, where even if the open<strong>in</strong>g does not extend down to the sea<br />
floor the majority <strong>of</strong> the wave energy passes through. <strong>The</strong> transmission <strong>of</strong> wave energy through<br />
the gaps will also be strongly dependent upon the angle <strong>of</strong> wave approach which determ<strong>in</strong>es the<br />
effective gap width. Silvester (1987) found that the total gap width available to SW waves is<br />
450 m while that available to NW waves is 625 m (Silvester, 1987).<br />
While Silvester proposes that no energy will pass over the reef, it is likely that this will depend<br />
upon the period <strong>of</strong> the waves as well as the depth <strong>of</strong> water over the reef. Longer period swell<br />
waves will be attenuated considerably more than shorter period w<strong>in</strong>d waves (Lemm et al., 1999).<br />
Higher water levels will allow the passage <strong>of</strong> more wave energy <strong>in</strong>to the <strong>Sound</strong> by allow<strong>in</strong>g<br />
higher period waves to be transmitted over the reef. This is particularly relevant dur<strong>in</strong>g storms<br />
where relatively low barometric pressure <strong>in</strong> comb<strong>in</strong>ation with strong onshore w<strong>in</strong>ds can generate<br />
significant storm surge, <strong>in</strong>creas<strong>in</strong>g the water level and allow<strong>in</strong>g more <strong>of</strong> the highly energetic<br />
storm wave energy <strong>in</strong>to the <strong>Sound</strong>.
2. Environmental Sett<strong>in</strong>g 26<br />
It has been demonstrated that <strong>in</strong> coastal regions sheltered from the direct impact <strong>of</strong> storm and<br />
swell wave activity, such as the case <strong>in</strong> <strong>Warnbro</strong> <strong>Sound</strong>, locally generated w<strong>in</strong>d waves may play<br />
a dom<strong>in</strong>ant role <strong>in</strong> controll<strong>in</strong>g nearshore and foreshore processes (Pattiaratchi et al., 1997). <strong>The</strong><br />
heights <strong>of</strong> these locally generated w<strong>in</strong>d waves will depend upon w<strong>in</strong>d conditions <strong>in</strong>clud<strong>in</strong>g<br />
speed, direction and duration as well as bas<strong>in</strong> dimensions <strong>in</strong>clud<strong>in</strong>g: width, length and depth<br />
(Jackson, 2002). Due to the limited fetch <strong>of</strong> <strong>Warnbro</strong> <strong>Sound</strong>, locally generated w<strong>in</strong>d waves will<br />
have short periods and therefore not be affected by refraction until reach<strong>in</strong>g the nearshore.<br />
Consequently they will generally reta<strong>in</strong> the direction <strong>of</strong> the w<strong>in</strong>d by which they were generated<br />
and be able to break obliquely to the coastl<strong>in</strong>e (Silvester, 1987).<br />
<strong>The</strong> strongest w<strong>in</strong>ds from mid latitude depressions are generally from the NW however their<br />
duration is small compared to those from the W and SW. This, <strong>in</strong> comb<strong>in</strong>ation with the<br />
prevail<strong>in</strong>g SW swell direction, means it is likely that higher storm waves will arrive from the SW<br />
and will have a longer duration to those from the NW. Analysis <strong>of</strong> 5 years <strong>of</strong> w<strong>in</strong>d data from<br />
1979 – 1984 by Silvester <strong>in</strong>dicated that the wave energy generated from the SW is 3 times<br />
greater than that from the NW (Silvester, 1987).<br />
It was proposed by Silvester (1987) that width <strong>of</strong> sub tidal terrace front<strong>in</strong>g <strong>Warnbro</strong> <strong>Sound</strong><br />
beaches can be used as an <strong>in</strong>dicator <strong>of</strong> the <strong>in</strong>tensity <strong>of</strong> storm waves and thus wave climate at a<br />
given site. Here, Silvester suggests that sub tidal terrace width is positively correlated with<br />
storm wave energy. However, this is doubtful as beaches with widest sub tidal terraces are<br />
located <strong>in</strong> the most sheltered sections <strong>of</strong> the <strong>Sound</strong>, with m<strong>in</strong>imal exposure to dom<strong>in</strong>ant waves.<br />
Recent research conducted <strong>in</strong> Cockburn <strong>Sound</strong> supports this view, whereby exponential shaped<br />
beach pr<strong>of</strong>iles, which have a wide sub tidal terrace, are associated with the highest levels <strong>of</strong><br />
protection (Travers, 2004).<br />
Separate from the <strong>in</strong>shore wave climate <strong>of</strong> the entire <strong>Sound</strong>, the Safety Bay area can be strongly<br />
affected by storm waves from the NW which are diffracted through the Mersey Po<strong>in</strong>t – Pengu<strong>in</strong><br />
Island gap. <strong>The</strong>se waves can generate significant eastward longshore <strong>transport</strong> (Silvester, 1987).<br />
This process is also strongly <strong>in</strong>fluenced by the water level and size <strong>of</strong> the Mersey Po<strong>in</strong>t –<br />
Pengu<strong>in</strong> Island which <strong>in</strong>fluence its effectiveness as a barrier.<br />
While the <strong>of</strong>fshore wave climate will have a <strong>in</strong>ter-annual variation, the most likely cause <strong>of</strong><br />
changes to the <strong>in</strong>shore wave climate <strong>of</strong> <strong>Warnbro</strong> <strong>Sound</strong> is the breakdown <strong>of</strong> the Garden Island<br />
Ridge, which will have the effect <strong>of</strong> lett<strong>in</strong>g higher levels <strong>of</strong> <strong>of</strong>fshore wave energy <strong>in</strong>to the <strong>Sound</strong><br />
(Silvester, 1987).
2. Environmental Sett<strong>in</strong>g 27<br />
2.5 Long period water level fluctuations<br />
South-western Australia experiences primarily diurnal micro-tidal conditions with the mean<br />
spr<strong>in</strong>g tidal range (MLLW – MHHW) along the coast from Geraldton to Albany be<strong>in</strong>g less than<br />
0.5 m (Sanderson et al., 2000). <strong>The</strong> <strong>Warnbro</strong> region has a maximum spr<strong>in</strong>g tidal range <strong>of</strong> 0.6 m<br />
(Department <strong>of</strong> defence tide tables, 1998).<br />
S<strong>in</strong>ce <strong>Warnbro</strong> <strong>Sound</strong> is relatively low energy, micro-tidal region, non-tidal sea level<br />
fluctuations frequently exceed the tidal range and are thus an important mechanism <strong>of</strong><br />
morphological change. <strong>The</strong>se <strong>in</strong>clude storm surge; seiches; and cont<strong>in</strong>ental shelf waves which<br />
are discussed <strong>in</strong> further detail below.<br />
In a relatively low energy environment such as <strong>Warnbro</strong> <strong>Sound</strong>, long period fluctuations <strong>in</strong> water<br />
level are important <strong>in</strong> controll<strong>in</strong>g nearshore processes and beach characteristics through two<br />
ma<strong>in</strong> actions. Firstly, the chang<strong>in</strong>g water level can have the effect <strong>of</strong> vary<strong>in</strong>g the level <strong>of</strong><br />
<strong>of</strong>fshore wave energy which passes <strong>in</strong>to the <strong>in</strong>shore region. This is due to a vary<strong>in</strong>g depth <strong>of</strong><br />
water over the <strong>of</strong>fshore reef system which subsequently changes the degree <strong>of</strong> wave attenuation<br />
that occurs, hence chang<strong>in</strong>g the wave energy propagat<strong>in</strong>g through to the nearshore zone (Hegge,<br />
1994).<br />
Secondly, variations <strong>in</strong> water level alter the position on the beach pr<strong>of</strong>ile where wave processes<br />
may act <strong>in</strong> rework<strong>in</strong>g the beachface. <strong>The</strong> effects <strong>of</strong> this also vary for the different types <strong>of</strong> water<br />
level variation, whether periodic (eg: Tides, Seiches) or non-periodic (eg: Storm surge). Periodic<br />
variations such as tides allow a frequent rework<strong>in</strong>g <strong>of</strong> the whole beach (with<strong>in</strong> the tidal range)<br />
and therefore result <strong>in</strong> a more homogeneous beach face. Non-periodic variations such as storm<br />
surge events lead to an <strong>in</strong>frequent rework<strong>in</strong>g, which means that artefacts <strong>of</strong> previous events may<br />
persist <strong>in</strong> the beach form for extended periods <strong>of</strong> time (Jackson et al., 2002).<br />
2.5.1 Storm Surges<br />
Storm surge is def<strong>in</strong>ed as the water level rise due to the comb<strong>in</strong>ed effects <strong>of</strong> w<strong>in</strong>d <strong>in</strong>duced shear<br />
stress (w<strong>in</strong>d set up) and barometric pressure variation (barometric set up). Storm <strong>in</strong>duced surges<br />
can produce short term water level <strong>in</strong>creases considerably above mean water levels, with the<br />
magnitude and duration dependant upon the type and strength <strong>of</strong> weather system responsible<br />
(CERC, 2002). <strong>The</strong> tim<strong>in</strong>g <strong>of</strong> surge events is important. If it occurs <strong>in</strong> conjunction with a spr<strong>in</strong>g<br />
high tide and high energy wave condition, the effect on beaches can be substantial. <strong>The</strong> effects
2. Environmental Sett<strong>in</strong>g 28<br />
may rema<strong>in</strong> for a long period <strong>of</strong> time as no rework<strong>in</strong>g will be possible under normal water levels.<br />
<strong>The</strong> importance <strong>of</strong> storm surge on beach processes and morphology <strong>of</strong> low energy beaches is<br />
most significant when surge levels exceed the tidal range, as is the case <strong>in</strong> south-western<br />
Australia (Jackson et al., 2002).<br />
Due to seasonal variations <strong>in</strong> ambient barometric pressure and prevail<strong>in</strong>g w<strong>in</strong>d direction, caused<br />
by the seasonal migration <strong>of</strong> the subtropical high pressure belt, water levels are higher <strong>in</strong> w<strong>in</strong>ter<br />
than <strong>in</strong> summer by an average <strong>of</strong> about 0.25 m (Massel<strong>in</strong>k & Pattiaratchi, 2001).<br />
2.5.2 Seiches<br />
Seiches are long period stand<strong>in</strong>g waves or oscillations <strong>of</strong> the water surface <strong>in</strong> an enclosed or<br />
semi-enclosed bas<strong>in</strong>. <strong>The</strong>y are <strong>in</strong>itiated by an external forc<strong>in</strong>g on the water body such as changes<br />
<strong>in</strong> atmospheric pressure or w<strong>in</strong>ds over the bas<strong>in</strong>, and <strong>in</strong> some cases due to the action <strong>of</strong> waves<br />
and wave groups at the bas<strong>in</strong> entrance (CERC, 2002).<br />
<strong>The</strong> existence <strong>of</strong> a seiche with<strong>in</strong> the <strong>Warnbro</strong> <strong>Sound</strong> bas<strong>in</strong> is likely, but s<strong>in</strong>ce no water level<br />
measurement data is available this can not be verified nor the magnitude <strong>of</strong> water level<br />
oscillation known. <strong>Warnbro</strong> <strong>Sound</strong> can be def<strong>in</strong>ed as an open system with respect to seich<strong>in</strong>g,<br />
and the period <strong>of</strong> such a seiche can be estimated us<strong>in</strong>g Merian’s formula, where the oscillation<br />
period for a seiche <strong>in</strong> a open system is given by the expression:<br />
4L<br />
T n<br />
=<br />
(1 + 2n)<br />
g.<br />
h<br />
(2.1)<br />
Where L is the length <strong>of</strong> the bas<strong>in</strong>, g is the acceleration due to gravity, h is the average depth <strong>of</strong><br />
the bas<strong>in</strong> and n represents the mode <strong>of</strong> oscillation. (For fundamental period n = 0)<br />
Assum<strong>in</strong>g a mean water depth <strong>of</strong> 15 m and bas<strong>in</strong> lengths <strong>of</strong> 4000m and 6500m the estimated first<br />
harmonic oscillation period <strong>of</strong> a seiche between the shorel<strong>in</strong>e and the Garden Island Ridge, is 22<br />
m<strong>in</strong> while along the length <strong>of</strong> the <strong>Sound</strong> is 35.7 m<strong>in</strong>.<br />
A documented seiche exists between the coast and the edge <strong>of</strong> the cont<strong>in</strong>ental shelf, observations<br />
from Fremantle and Cockburn <strong>Sound</strong> put the period <strong>of</strong> this seiche at 2.7 - 2.8 hours with a<br />
magnitude <strong>of</strong> the order 0.1 - 0.3 m. Persistent seich<strong>in</strong>g has also been documented between the<br />
coast and the parallel <strong>of</strong>fshore reefs with periods <strong>of</strong> up to 30 m<strong>in</strong>utes and amplitudes at the
2. Environmental Sett<strong>in</strong>g 29<br />
shorel<strong>in</strong>e greater than 0.1 m (Hegge et al., 1996). It is expected that similar water level effects<br />
would experienced from these seiches with<strong>in</strong> <strong>Warnbro</strong> <strong>Sound</strong>.<br />
It was proposed by Hegge (1994), that the water level variation due to the cont<strong>in</strong>ental shelf<br />
seiche and its effect <strong>of</strong> caus<strong>in</strong>g a periodic change <strong>in</strong> water ‘depth’ over the <strong>of</strong>fshore reefs results<br />
<strong>in</strong> a periodic change <strong>in</strong> the level <strong>of</strong> wave attenuation by the reefs. It is likely that this would<br />
cause a periodic modulation <strong>of</strong> the wave energy reach<strong>in</strong>g the shorel<strong>in</strong>e (Hegge, 1994).<br />
2.5.3 Cont<strong>in</strong>ental shelf waves<br />
Cont<strong>in</strong>ental shelf waves are formed by the passage weather systems such as tropical cyclones<br />
and mid latitude depressions across the coast propagat<strong>in</strong>g southward (land to the left) along the<br />
<strong>Western</strong> Australian cont<strong>in</strong>ental shelf with maximum amplitude at the coast. Typically<br />
cont<strong>in</strong>ental shelf waves <strong>in</strong> this region have amplitudes rang<strong>in</strong>g from 0.2 – 0.4 m, periods <strong>of</strong> 5 –<br />
20 days and wavelengths <strong>of</strong> a few thousand kilometres (Hegge et al., 1996).
3. Morphodynamics Relevant to <strong>Warnbro</strong> <strong>Sound</strong> 30<br />
3 MORPHODYNAMICS RELEVANT TO WARNBRO<br />
SOUND<br />
In order to attempt an understand<strong>in</strong>g <strong>of</strong> the sediment dynamics <strong>of</strong> <strong>Warnbro</strong> <strong>Sound</strong>, it is first<br />
necessary to consider key features and processes relat<strong>in</strong>g to the function<strong>in</strong>g <strong>of</strong> the complex<br />
coastal system. While the geomorphic sett<strong>in</strong>g <strong>of</strong> the <strong>Sound</strong> has been mentioned previously, this<br />
section will consider the formation and ma<strong>in</strong>tenance <strong>of</strong> these features with particular reference to<br />
their role <strong>in</strong> determ<strong>in</strong><strong>in</strong>g the sediment dynamics and future shorel<strong>in</strong>e change <strong>of</strong> <strong>Warnbro</strong> <strong>Sound</strong>.<br />
Important processes <strong>in</strong>clude transverse sand bar dynamics, longshore sediment <strong>transport</strong> and spit<br />
formation, while important sedimentary forms <strong>in</strong>clude dunes and tombolos, salients and cuspate<br />
forelands.<br />
3.1 Transverse sand bar dynamics<br />
Transverse sand bar dynamics are important <strong>in</strong> the <strong>in</strong>vestigation <strong>of</strong> the formation, ma<strong>in</strong>tenance<br />
and migration <strong>of</strong> the Tern Island sand bar and due to its significance <strong>in</strong> regard to coastl<strong>in</strong>e<br />
change <strong>in</strong> Safety Bay.<br />
Sand bars orientated normal (or steeply oblique) to the shorel<strong>in</strong>e are termed ‘transverse bars’.<br />
Typically transverse bars occur on wide, gently slop<strong>in</strong>g foreshores under conditions <strong>of</strong> low to<br />
moderate wave energy and large sediment supply. It is likely that there is no unique set <strong>of</strong><br />
conditions and processes that result <strong>in</strong> their formation, with transverse bars <strong>in</strong> different<br />
environments result<strong>in</strong>g from different formation, ma<strong>in</strong>tenance and migration mechanisms<br />
(Gelfenbaum & Brooks, 2003).<br />
<strong>The</strong> formation, ma<strong>in</strong>tenance and migration process <strong>of</strong> transverse sand bars described by Carter<br />
(1988) presents the most likely evolution for the Tern Island sand bar. This mechanism is shown<br />
<strong>in</strong> Figure 3.1.<br />
<strong>The</strong> <strong>in</strong>itial formation <strong>of</strong> a transverse sandbar requires both a sufficient sediment supply as well as<br />
hydrodynamic conditions which allow the accumulation <strong>of</strong> sediment. For the case <strong>of</strong> a non-tidal<br />
sand bar, the required hydrodynamic conditions occur primarily due to the effect <strong>of</strong> bathymetric<br />
features <strong>in</strong> alter<strong>in</strong>g the wave field through the processes <strong>of</strong> refraction and diffraction or a<br />
comb<strong>in</strong>ation <strong>of</strong> the two, result<strong>in</strong>g <strong>in</strong> a region <strong>of</strong> low wave heights, analogous to an area <strong>of</strong> low
3. Morphodynamics Relevant to <strong>Warnbro</strong> <strong>Sound</strong> 31<br />
wave energy. This region will be conducive to sediment deposition, result<strong>in</strong>g <strong>in</strong> an accumulation<br />
<strong>of</strong> sediments (Gelfenbaum & Brooks, 2003).<br />
Once deposition form<strong>in</strong>g the <strong>in</strong>itial shoal has occurred the refraction <strong>of</strong> waves by the shoal<br />
results <strong>in</strong> sediment <strong>transport</strong> around the shoal from the tail to the head (Figure 3.1 part i), the<br />
deposit becomes elongated and a l<strong>in</strong>ear caustic is formed which ma<strong>in</strong>ta<strong>in</strong>s the l<strong>in</strong>ear shape <strong>of</strong> the<br />
bar, its alignment <strong>in</strong> the direction <strong>of</strong> the prevail<strong>in</strong>g swell, and causes it to migrate <strong>in</strong> the same<br />
direction (Figure 3.1 part ii). This process cont<strong>in</strong>ues until the bar reaches the coastl<strong>in</strong>e (Carter,<br />
1988).<br />
Diffraction by the reef and refraction by the north sands platform <strong>of</strong> swell waves results <strong>in</strong> the<br />
prevail<strong>in</strong>g swell wave direction becom<strong>in</strong>g more northward as it nears the shore. This is<br />
illustrated by the almost E – W orientation <strong>of</strong> the Safety Bay shorel<strong>in</strong>e. <strong>The</strong> sand bar has<br />
followed this same pathway, support<strong>in</strong>g Carter’s (1988) description as the relevant ma<strong>in</strong>tenance<br />
and migration mechanism <strong>of</strong> the Tern Island sand bar. Upon reach<strong>in</strong>g the shore the fate <strong>of</strong> the<br />
bar depends upon the local hydrodynamic conditions and may rema<strong>in</strong> a feature for longer than<br />
suggested <strong>in</strong> Figure 3.1, part iii.<br />
Figure 3.1: Landward formation and propagation <strong>of</strong> a transverse bar (adapted from Carter, 1988)<br />
Caston (1981) demonstrated that the plan view <strong>of</strong> a sand bar can be used as an <strong>in</strong>dicator <strong>of</strong> the<br />
approximate direction <strong>of</strong> net sand <strong>transport</strong> as the net <strong>transport</strong> occurs from tail to head. <strong>The</strong>
3. Morphodynamics Relevant to <strong>Warnbro</strong> <strong>Sound</strong> 32<br />
transverse sand bars he studied had rounded heads <strong>in</strong> the approximate ‘upstream’ direction and<br />
tapered tails <strong>in</strong> the approximate ‘downstream’ direction <strong>of</strong> net regional sand <strong>transport</strong>” (Caston,<br />
1981).<br />
<strong>The</strong> Tern Island sand bar is likely to contribute to the nearshore sediment budget as, while<br />
transverse sand bars formed by tidal currents are essentially closed systems with no sediment<br />
transfer to the beach, shore attached sand bars contribute significantly to the nearshore budget<br />
and consequently to the long-term shorel<strong>in</strong>e movement (Pattiaratchi & Eliot, 1993).<br />
3.2 Longshore <strong>transport</strong><br />
<strong>The</strong> mechanism <strong>of</strong> longshore <strong>transport</strong>, particularly <strong>of</strong> the estimation method, is important to<br />
both the sediment <strong>transport</strong> <strong>in</strong>to and with<strong>in</strong> the <strong>Sound</strong>.<br />
Longshore sediment <strong>transport</strong> or littoral drift is a shore parallel sediment <strong>transport</strong> caused by<br />
longshore currents, generated by waves break<strong>in</strong>g obliquely <strong>in</strong>cident to the shorel<strong>in</strong>e (Silvester,<br />
1987; Komar, 1998; Massel<strong>in</strong>k & Hughes, 2003). It is the comb<strong>in</strong>ed effect <strong>of</strong> waves and<br />
currents which produce the longshore <strong>transport</strong>; sediment particles are suspended (entra<strong>in</strong>ed) by<br />
wave action allow<strong>in</strong>g wave generated longshore currents, with velocities far below sediment<br />
threshold velocities, to move the sediment (Komar, 1998).<br />
S<strong>in</strong>ce swell waves will be normally <strong>in</strong>cident to the <strong>Warnbro</strong> shorel<strong>in</strong>es they will generate a<br />
negligible littoral drift. <strong>The</strong> major forc<strong>in</strong>g beh<strong>in</strong>d longshore <strong>transport</strong> with<strong>in</strong> the <strong>Sound</strong> will be<br />
from locally generated w<strong>in</strong>d waves, particularly those due to sea breeze and storm w<strong>in</strong>ds, which<br />
due to their short period will not be refracted until reach<strong>in</strong>g the nearshore, reta<strong>in</strong><strong>in</strong>g the direction<br />
<strong>of</strong> the w<strong>in</strong>d by which they were generated. This means that they will be able to break obliquely<br />
<strong>in</strong>cident to the shorel<strong>in</strong>e, hence generat<strong>in</strong>g a longshore <strong>transport</strong> (Silvester, 1987).<br />
Due to the effect <strong>of</strong> the sea breeze and higher levels <strong>of</strong> energy from SW storm w<strong>in</strong>ds than NW<br />
storm w<strong>in</strong>ds a net northward longshore <strong>transport</strong> will exist with<strong>in</strong> the <strong>Sound</strong>, particularly on<br />
<strong>Warnbro</strong> Beach due to its orientation and exposure (Silvester, 1987).<br />
Empirical relationships have been formed to predict longshore <strong>transport</strong> rates. <strong>The</strong> most well<br />
recognised is the CERC formula which predicts longshore sediment <strong>transport</strong> rates based upon<br />
wave energy. In this method the potential longshore sediment <strong>transport</strong> rate is correlated to the<br />
longshore component <strong>of</strong> wave energy flux which is given by the expression:
3. Morphodynamics Relevant to <strong>Warnbro</strong> <strong>Sound</strong> 33<br />
P<br />
l<br />
= E . C<br />
b<br />
gb<br />
s<strong>in</strong>α<br />
. cosα<br />
b<br />
b<br />
(3.1)<br />
Where H b is the significant break<strong>in</strong>g wave height, h b is the break<strong>in</strong>g depth, α b is the wave<br />
break<strong>in</strong>g angle and κ is the wave break<strong>in</strong>g parameter and E b is the wave energy, evaluated at the<br />
breaker l<strong>in</strong>e:<br />
E<br />
1<br />
= ρ.<br />
g.<br />
8<br />
2<br />
b<br />
H b<br />
(3.2)<br />
And C gb is the wave group velocity at the breaker l<strong>in</strong>e:<br />
C<br />
gb<br />
=<br />
⎛ Hb<br />
⎞<br />
g. hb<br />
= ⎜ g.<br />
⎟<br />
⎝ κ ⎠<br />
1<br />
2<br />
(3.3)<br />
Comb<strong>in</strong><strong>in</strong>g the above equations gives the expression:<br />
P<br />
l<br />
⎛<br />
= ⎜<br />
⎝ 8<br />
1<br />
1 2 ⎞ ⎛ H<br />
b ⎞<br />
ρ.<br />
g.<br />
H<br />
b ⎟.<br />
⎜ g.<br />
2<br />
⎠ ⎝<br />
κ<br />
⎟<br />
⎠<br />
.s<strong>in</strong>α<br />
cosα<br />
b<br />
b<br />
(3.4)<br />
<strong>The</strong> longshore component <strong>of</strong> wave energy flux (P l ) can then be used to calculate the immersed<br />
sediment weight (I l ) us<strong>in</strong>g the follow<strong>in</strong>g empirical formula widely known as the CERC formula,<br />
where K is the dimensionless empirical proportionality coefficient, obta<strong>in</strong>ed from field data.<br />
I = K.<br />
l<br />
P l<br />
(3.5)<br />
<strong>The</strong> immersed sediment rate I l is related to the volume <strong>transport</strong> rate Q l by the expression:<br />
l<br />
( ρ<br />
s<br />
− ). g.<br />
( 1 − n) Ql<br />
I = ρ .<br />
(3.6)<br />
<strong>The</strong> relationship between I l and Q l can be used to obta<strong>in</strong> an expression <strong>of</strong> the longshore <strong>transport</strong><br />
rate as a function <strong>of</strong> the longshore component <strong>of</strong> wave energy flux.<br />
Q<br />
l<br />
⎛<br />
=<br />
⎜<br />
⎝<br />
l<br />
( ρ − ρ ).<br />
.( 1−<br />
n) ⎟<br />
s<br />
K<br />
g<br />
⎞<br />
⎟P<br />
⎠<br />
(3.7)
3. Morphodynamics Relevant to <strong>Warnbro</strong> <strong>Sound</strong> 34<br />
Where ρ s is the sediment density; ρ is the water density; g is acceleration due to gravity and n is<br />
the <strong>in</strong> place sediment porosity. Komar (1998) proposed that when us<strong>in</strong>g RMS wave heights the<br />
value KRMS = 0.70 be used, this was based upon a compilation <strong>of</strong> field data for longshore<br />
<strong>transport</strong> rates (Ql & Il) as a function <strong>of</strong> longshore power (Pl) which gave a l<strong>in</strong>ear relationship<br />
with gradient <strong>of</strong> 0.7 this is equivalent to us<strong>in</strong>g a value <strong>of</strong> Ksig = 0.30 when significant wave<br />
heights are used (CERC, 2002; Komar, 1998).<br />
3.3 Spit Development<br />
S<strong>in</strong>ce the spit enclos<strong>in</strong>g Peel Harbour <strong>in</strong> the 1839 survey strongly resembled a l<strong>in</strong>ear spit and<br />
subsequently extended to jo<strong>in</strong> the shorel<strong>in</strong>e, the process <strong>of</strong> l<strong>in</strong>ear spit development may be<br />
important <strong>in</strong> the future development <strong>of</strong> the Tern Island sand bar due to the apparent similarities<br />
<strong>of</strong> the situation.<br />
A spit is a narrow sand accumulation with one end, the proximal end, attached to the ma<strong>in</strong>land<br />
shore and the other end, the distal end, extend<strong>in</strong>g seaward. Spits develop across the mouths <strong>of</strong><br />
estuaries or bays or where a sharp change <strong>in</strong> direction <strong>of</strong> the shorel<strong>in</strong>e exists, grow<strong>in</strong>g <strong>in</strong> the<br />
direction <strong>of</strong> the predom<strong>in</strong>ant littoral drift (Silvester, 1987; Massel<strong>in</strong>k & Hughes, 2003).<br />
L<strong>in</strong>ear spits are the simplest form <strong>of</strong> spit and are generally straight features however they <strong>of</strong>ten<br />
have a curved sand deposit at the distal end due to the <strong>in</strong>teraction <strong>of</strong> waves from different<br />
directions with the spit. <strong>The</strong> process <strong>of</strong> spit formation is shown <strong>in</strong> Figure 3.2 and is as follows.<br />
<strong>Sediment</strong> is <strong>transport</strong>ed along the coast (then the spit) due to longshore currents, once these<br />
currents enter deep water near the tip <strong>of</strong> the spit they disperse (spread out), loos<strong>in</strong>g the capacity<br />
to <strong>transport</strong> sediment, this results <strong>in</strong> deposition occurr<strong>in</strong>g <strong>in</strong> this region, extend<strong>in</strong>g the spit<br />
(Massel<strong>in</strong>k & Hughes, 2003).
3. Morphodynamics Relevant to <strong>Warnbro</strong> <strong>Sound</strong> 35<br />
Figure 3.2: L<strong>in</strong>ear spit development (from Silvester, 1987)<br />
Spits are very dynamic features which will rapidly respond to changes <strong>in</strong> the longshore sediment<br />
supply. <strong>The</strong> development <strong>of</strong> a l<strong>in</strong>ear spit can be controlled by ‘pulses’ <strong>of</strong> longshore sediment<br />
<strong>transport</strong> due to storm waves. This results <strong>in</strong> an <strong>in</strong>cremental growth pattern where spit is<br />
lengthened dur<strong>in</strong>g the storm event (caus<strong>in</strong>g the formative longshore <strong>transport</strong>) then is shaped by<br />
the prevail<strong>in</strong>g swell conditions, which act to ‘curve’ the distal end, this process is shown <strong>in</strong><br />
Figure 3.3 (Silvester, 1987).<br />
Figure 3.3: Progressive development <strong>of</strong> a l<strong>in</strong>ear spit (from Silvester, 1987)<br />
Assum<strong>in</strong>g this mode <strong>of</strong> formation and observ<strong>in</strong>g the 1839 survey (Figure 1.2), it is likely that the<br />
formation <strong>of</strong> the Peel Harbour spit occurred under forc<strong>in</strong>g from storm waves <strong>in</strong>cident from the<br />
NW (pass<strong>in</strong>g between Mersey po<strong>in</strong>t and Pengu<strong>in</strong> Island) produc<strong>in</strong>g pulses <strong>of</strong> longshore <strong>transport</strong><br />
eastward from Mersey po<strong>in</strong>t, with deposition occurr<strong>in</strong>g at the tip. Follow<strong>in</strong>g these events the
3. Morphodynamics Relevant to <strong>Warnbro</strong> <strong>Sound</strong> 36<br />
prevail<strong>in</strong>g SW swell waves act<strong>in</strong>g to curve the spit towards the coastl<strong>in</strong>e (towards the north)<br />
dur<strong>in</strong>g ‘calm periods’, eventually reach<strong>in</strong>g the shorel<strong>in</strong>e, completely enclos<strong>in</strong>g the water body.<br />
3.4 Dunes<br />
A well developed dune system exists with<strong>in</strong> <strong>Warnbro</strong> <strong>Sound</strong>, particularly <strong>in</strong> the central section.<br />
<strong>The</strong> relationship between the dune and beach systems is likely to be important <strong>in</strong> the large scale<br />
sediment dynamics <strong>of</strong> the <strong>Sound</strong>.<br />
Coastal dunes can be classified <strong>in</strong>to two types: Primary dunes (foredunes) which occur closest to<br />
the shorel<strong>in</strong>e and dynamically <strong>in</strong>teract with the beach system; and secondary dunes (blowouts,<br />
parabolic dunes, transgressive dunes) which are located further <strong>in</strong>land and are ‘cut <strong>of</strong>f’ from the<br />
beach system, sand reach<strong>in</strong>g the secondary dunes is effectively lost from the beach system<br />
(Massel<strong>in</strong>k & Hughes, 2003).<br />
Foredune heights depend upon a range <strong>of</strong> factors, the most important <strong>of</strong> which be<strong>in</strong>g the<br />
sediment supply to the dune system and the rate <strong>of</strong> shorel<strong>in</strong>e progradation. <strong>The</strong> maximum level<br />
<strong>of</strong> foredune development is achieved when the sediment budget <strong>of</strong> the beach is neutral and that<br />
<strong>of</strong> the dune system is positive, this results <strong>in</strong> sand accumulat<strong>in</strong>g at the same position for an<br />
extended period <strong>of</strong> time, form<strong>in</strong>g a s<strong>in</strong>gle well developed foredune. <strong>The</strong> heights <strong>of</strong> foredunes<br />
can vary markedly depend<strong>in</strong>g upon the conditions and can be reach heights <strong>of</strong> several tens <strong>of</strong><br />
metres (Massel<strong>in</strong>k & Hughes, 2003). Foredune processes are l<strong>in</strong>ked to nearshore processes with<br />
foredunes provid<strong>in</strong>g a sediment store for the beach. <strong>Sediment</strong> is eroded from the foredune and<br />
<strong>transport</strong>ed <strong>in</strong> to the nearshore zone dur<strong>in</strong>g storm events (Woodr<strong>of</strong>fe, 2003).<br />
Well developed foredunes limit the sediment supply to secondary dunes by provid<strong>in</strong>g a physical<br />
barrier to further landward aeolian <strong>transport</strong>. Where foredunes have been cut back by wave<br />
action leav<strong>in</strong>g an unvegetated scarp <strong>of</strong> loose sand, strong onshore w<strong>in</strong>ds can <strong>in</strong>itiate blowout<br />
formation by erod<strong>in</strong>g a gap <strong>in</strong> the foredune. Blowouts can also be <strong>in</strong>itiated by human<br />
<strong>in</strong>terference with the dune vegetation, due to path construction or vegetation removal. If the gap<br />
is not repaired by an accumulation <strong>of</strong> sand stabilised by vegetation the blowout will <strong>in</strong>crease <strong>in</strong><br />
size, migrat<strong>in</strong>g <strong>in</strong>land <strong>in</strong> the direction <strong>of</strong> the prevail<strong>in</strong>g w<strong>in</strong>ds, form<strong>in</strong>g a parabolic dune. <strong>The</strong><br />
form <strong>of</strong> such a dune is a blunt nose <strong>of</strong> loose sand with trail<strong>in</strong>g arms partially stabilised by<br />
vegetation. Sand is blown from the beach and the foredune <strong>in</strong>to the blowout or parabolic dune,<br />
and is effectively lost from the beach system, mean<strong>in</strong>g they act as a significant sediment s<strong>in</strong>k for
3. Morphodynamics Relevant to <strong>Warnbro</strong> <strong>Sound</strong> 37<br />
the beach system. Parabolic dunes which cont<strong>in</strong>ue their landward migration are termed<br />
transgressive dunes (Bird, 1972).<br />
Figure 3.4: Parabolic Dunes (adapted from Bird, 1972)<br />
3.5 Tombolos, salients & cuspate forelands<br />
S<strong>in</strong>ce Becher Po<strong>in</strong>t and Mersey Po<strong>in</strong>t are examples <strong>of</strong> cuspate forelands the formation and<br />
ma<strong>in</strong>tenance <strong>of</strong> this suite <strong>of</strong> features is important <strong>in</strong> the understand<strong>in</strong>g and prediction <strong>of</strong> coastl<strong>in</strong>e<br />
changes <strong>in</strong> the northern and southern sections <strong>of</strong> <strong>Warnbro</strong> <strong>Sound</strong>.<br />
Tombolos, cuspate forelands and salients are a series <strong>of</strong> landforms whose development is<br />
controlled by the <strong>in</strong>teraction <strong>of</strong> the prevail<strong>in</strong>g swell waves with <strong>of</strong>fshore structures (reefs or<br />
islands). <strong>The</strong>y develop <strong>in</strong> the lee <strong>of</strong> the <strong>of</strong>fshore structure due to diffraction <strong>of</strong> waves creat<strong>in</strong>g a<br />
locus for sediment deposition, form<strong>in</strong>g a promontory extend<strong>in</strong>g out from the shore (Massel<strong>in</strong>k &<br />
Hughes, 2003; Silvester, 1987).
3. Morphodynamics Relevant to <strong>Warnbro</strong> <strong>Sound</strong> 38<br />
Figure 3.5: Tombolos, salients & cuspate forelands (adapted from Massel<strong>in</strong>k, 2003)<br />
Tombolos and salients are formed by a similar process due to the waves diffracted around an<br />
<strong>of</strong>fshore obstacle form<strong>in</strong>g a locus <strong>of</strong> sediment deposition <strong>in</strong> the shadow zone <strong>of</strong> the structure.<br />
Where the promontory is l<strong>in</strong>ked to the <strong>of</strong>fshore structure it is termed a tombolo, while a salient is<br />
simply a modest protrusion <strong>of</strong> the shorel<strong>in</strong>e (Massel<strong>in</strong>k & Hughes, 2003).<br />
Formation <strong>of</strong> a tombolo or salient is dependant upon the ratio <strong>of</strong> the alongshore length <strong>of</strong> the<br />
structure (I) and its distance from the ma<strong>in</strong>land (J). It was found by Sunamura and Mizuno<br />
(1987) that if J/I < 1.5 a tombolo will develop, J/I = 1.5 – 3.5 a salient will develop and J/I > 1.5<br />
the structure will have not have a considerable effect on the coastl<strong>in</strong>e (Sunamura & Mizuno,<br />
1987).<br />
Cuspate forelands are larger features which form due to the diffraction by the <strong>of</strong>fshore structure<br />
caus<strong>in</strong>g two dom<strong>in</strong>ant swell directions (either side <strong>of</strong> the foreland). <strong>The</strong> balance <strong>of</strong> the energy<br />
from the two directions will result <strong>in</strong> the formation and ma<strong>in</strong>tenance <strong>of</strong> a cuspate foreland.<br />
Mersey Po<strong>in</strong>t and Becher Po<strong>in</strong>t are examples <strong>of</strong> cuspate forelands <strong>in</strong> the <strong>Warnbro</strong> region.<br />
Mersey po<strong>in</strong>t is ma<strong>in</strong>ta<strong>in</strong>ed by swell <strong>in</strong>teractions with Pengu<strong>in</strong> Island while Becher po<strong>in</strong>t is<br />
ma<strong>in</strong>ta<strong>in</strong>ed by the balance <strong>of</strong> wave energy, created by swell wave <strong>in</strong>teractions with the <strong>of</strong>fshore<br />
reefs, from the north and south. <strong>The</strong>refore the form <strong>of</strong> these cuspate forelands is subject to<br />
changes to the balance <strong>of</strong> wave energy due to changes <strong>in</strong> the reef or changes to the predom<strong>in</strong>ant<br />
wave direction <strong>of</strong> wave energy (Silvester, 1987).
4. Methods 39<br />
4 METHODS<br />
<strong>The</strong> research design was broken up <strong>in</strong>to four key sections to best achieve the objectives <strong>of</strong> the<br />
study. Firstly qualitative analysis <strong>of</strong> aerial photographs was carried out to exam<strong>in</strong>e past<br />
shorel<strong>in</strong>e change and to estimate sediment <strong>transport</strong> pathways, follow<strong>in</strong>g this numerical<br />
modell<strong>in</strong>g <strong>of</strong> longshore sediment <strong>transport</strong> rates was carried out to estimate annual <strong>transport</strong><br />
volumes at 18 sites with<strong>in</strong> the <strong>Sound</strong>. <strong>The</strong> results <strong>of</strong> the numerical modell<strong>in</strong>g were comb<strong>in</strong>ed<br />
with those <strong>of</strong> the qualitative analysis to construct a conceptual model <strong>of</strong> sediment movement<br />
with<strong>in</strong> the <strong>Sound</strong>. Numerical methods were also used to model the effect the Garden Island<br />
Ridge has on the transmission <strong>of</strong> swell energy <strong>in</strong>to the <strong>Sound</strong>. This was carried out as part <strong>of</strong> the<br />
<strong>in</strong>vestigation <strong>in</strong>to the formation <strong>of</strong> the Tern Island sand bar. F<strong>in</strong>ally, the equilibrium shorel<strong>in</strong>e<br />
planform <strong>in</strong> the vic<strong>in</strong>ity <strong>of</strong> the Tern Island sand bar was calculated to assess shorel<strong>in</strong>e stability <strong>in</strong><br />
the area and to aid <strong>in</strong> predict<strong>in</strong>g future shorel<strong>in</strong>e changes <strong>in</strong> the Safety Bay region.<br />
4.1 Qualitative Estimation <strong>of</strong> Net <strong>Sediment</strong> Transport<br />
4.1.1 Aerial Photographs<br />
Aerial photography <strong>of</strong> the <strong>Warnbro</strong> region was obta<strong>in</strong>ed from the Department <strong>of</strong> Plann<strong>in</strong>g and<br />
Infrastructure (DPI). <strong>The</strong> photographs used were part <strong>of</strong> the Department <strong>of</strong> Land and<br />
Adm<strong>in</strong>istration (DOLA) coastal photography runs and were available over various time spac<strong>in</strong>gs<br />
from 1942 to 2000. Current aerial photographs were also available for observation on<br />
SKYVIEW (DOLA, 2004) but these were not available for reproduction <strong>in</strong> this study.<br />
Aerial photographs were used to analyse shorel<strong>in</strong>e advance and retreat over the time period us<strong>in</strong>g<br />
Geographical Information System (GIS) techniques. <strong>The</strong>y were also used to observe the shapes<br />
and positions <strong>of</strong> geomorphic features as well as temporal changes to allow an <strong>in</strong>sight <strong>in</strong>to the<br />
sediment dynamics <strong>of</strong> the region.<br />
4.1.1.1 Rectify<strong>in</strong>g photographs and construct<strong>in</strong>g coastl<strong>in</strong>e movement plots<br />
<strong>The</strong> scale and orientation <strong>of</strong> the digitised aerial photographs was corrected aga<strong>in</strong>st a road l<strong>in</strong>e<br />
coverage, obta<strong>in</strong>ed from DPI, us<strong>in</strong>g the geo-reference and rectify commands <strong>in</strong> ArcMap. <strong>The</strong><br />
exact process and commands used are listed <strong>in</strong> Appendix D.
4. Methods 40<br />
Once the photograph scale and orientation were corrected (rectified) the shorel<strong>in</strong>e position was<br />
recorded. This was achieved by mak<strong>in</strong>g l<strong>in</strong>e coverages <strong>of</strong> the shorel<strong>in</strong>e <strong>in</strong> ArcView on each <strong>of</strong><br />
the rectified images. <strong>The</strong> shorel<strong>in</strong>e was taken as the observed water l<strong>in</strong>e. While vegetation l<strong>in</strong>es<br />
are typically used <strong>in</strong> shorel<strong>in</strong>e analysis for the purposes <strong>of</strong> this study it was believed that the<br />
water l<strong>in</strong>e would give a better <strong>in</strong>dication <strong>of</strong> the changes. Follow<strong>in</strong>g their del<strong>in</strong>eation shorel<strong>in</strong>e<br />
coverages were collated to create a coastl<strong>in</strong>e movement plot.<br />
For the purposes <strong>of</strong> this study the analysis <strong>of</strong> coastl<strong>in</strong>e movement plots was strictly qualitative,<br />
and <strong>in</strong>volved identify<strong>in</strong>g the areas and periods <strong>of</strong> time <strong>in</strong> which significant erosion and accretion<br />
occurred. <strong>The</strong> time series <strong>of</strong> aerial photographs was observed to identify geomorphic features<br />
which could be used to <strong>in</strong>dicate sediment movement. Where such features were identified their<br />
change over time was monitored to obta<strong>in</strong> further <strong>in</strong>sight <strong>in</strong>to the suggested sediment <strong>transport</strong><br />
directions.<br />
4.2 Numerical Estimation <strong>of</strong> Longshore <strong>Sediment</strong> Transport<br />
Longshore sediment <strong>transport</strong> for the <strong>Sound</strong> was estimated us<strong>in</strong>g numerical modell<strong>in</strong>g<br />
techniques. Tonk et al. (2002) <strong>in</strong>vestigated the accuracy <strong>of</strong> various sediment <strong>transport</strong> estimation<br />
methods at City Beach. This was done by compar<strong>in</strong>g <strong>transport</strong> volumes predicted us<strong>in</strong>g the<br />
estimation methods to the volume <strong>of</strong> sediment trapped by a shore normal groyne. <strong>The</strong>y found<br />
that the best agreement between estimated and measured <strong>transport</strong> volumes was obta<strong>in</strong>ed us<strong>in</strong>g<br />
the CERC equation evaluated only for w<strong>in</strong>d waves (Tonk et al., 2002). <strong>The</strong> background <strong>of</strong> the<br />
CERC equation is discussed <strong>in</strong> 3.2, on page 32. <strong>The</strong> CERC equation is also both widely used<br />
and is recommended <strong>in</strong> the Shore Protection Manual (2002) as a means for estimat<strong>in</strong>g longshore<br />
sediment <strong>transport</strong> rates. <strong>The</strong>refore it was decided to use the CERC equation, evaluated only for<br />
locally generated w<strong>in</strong>d waves to estimate the longshore sediment <strong>transport</strong> with<strong>in</strong> <strong>Warnbro</strong><br />
<strong>Sound</strong>.<br />
For each <strong>of</strong> the 18 selected sites, calculation <strong>of</strong> longshore <strong>transport</strong> volumes was carried out with<br />
the MATLAB program ‘<strong>transport</strong>.m’ (listed <strong>in</strong> Appendix C). This <strong>in</strong>volved firstly calculat<strong>in</strong>g<br />
the wave break<strong>in</strong>g angle (α b ) from the site orientation angle (which was estimated from the most<br />
recent coastl<strong>in</strong>e plot) and break<strong>in</strong>g wave direction. <strong>The</strong>n the CERC equation (3.4, page33) was<br />
used to calculate the longshore component <strong>of</strong> wave energy flux followed by equation (3.7,<br />
page33) to calculate the 3 hourly longshore <strong>transport</strong> rate. Three hourly <strong>transport</strong> volumes were<br />
then estimated (by multiply<strong>in</strong>g rate by time) and were summed to obta<strong>in</strong> net monthly and annual
4. Methods 41<br />
<strong>transport</strong> volumes. <strong>The</strong> <strong>in</strong>put requirements <strong>of</strong> the <strong>transport</strong> calculation <strong>in</strong>cluded 3 hourly<br />
break<strong>in</strong>g wave height and direction. <strong>The</strong>se were estimated us<strong>in</strong>g numerical wave modell<strong>in</strong>g<br />
techniques.<br />
4.2.1 Numerical modell<strong>in</strong>g <strong>of</strong> w<strong>in</strong>d wave generation<br />
<strong>The</strong> numerical wave model SWAN (Simulat<strong>in</strong>g WAves Nearshore) was used to model the w<strong>in</strong>d<br />
wave generation with<strong>in</strong> <strong>Warnbro</strong> <strong>Sound</strong> to obta<strong>in</strong> the <strong>in</strong>puts required for the CERC equation.<br />
4.2.1.1 SWAN Background<br />
SWAN is a third generation numerical wave model, developed for obta<strong>in</strong><strong>in</strong>g realistic estimates<br />
<strong>of</strong> wave parameters <strong>in</strong> coastal areas, lakes and estuaries. <strong>The</strong> wave propagation processes it<br />
accounts for <strong>in</strong>clude: propagation through geographical space; refraction due to spatial variations<br />
<strong>in</strong> bathymetry and current; shoal<strong>in</strong>g due to spatial variations <strong>in</strong> bathymetry and current;<br />
transmission through, blockage by or reflection by obstacles. <strong>The</strong> wave generation and<br />
dissipation processes accounted for <strong>in</strong>clude: refraction; shoal<strong>in</strong>g; w<strong>in</strong>d wave generation;<br />
dissipation by white capp<strong>in</strong>g; dissipation by wave <strong>in</strong>duced break<strong>in</strong>g; dissipation by bottom<br />
friction; and wave – wave <strong>in</strong>teractions. It does not account for the effects <strong>of</strong> diffraction (Booij et<br />
al., 1999).<br />
<strong>The</strong> evolution <strong>of</strong> the wave spectrum used <strong>in</strong> SWAN is described by the spectral wave action<br />
balance equation which, for cartesian coord<strong>in</strong>ates is def<strong>in</strong>ed as:<br />
∂<br />
N +<br />
∂t<br />
∂<br />
∂<br />
C<br />
x<br />
∂<br />
∂y<br />
∂<br />
N + C<br />
∂σ<br />
∂<br />
N + C<br />
∂θ<br />
x<br />
N + C<br />
y<br />
σ<br />
θ<br />
N =<br />
S<br />
σ<br />
where ∂ is the relative frequency (the wave frequency measured from a frame <strong>of</strong> reference<br />
mov<strong>in</strong>g with a current, if a current exists); N is wave action density, equal to energy density<br />
divided by relative frequency (N = E/σ); θ is wave direction; Cg is the wave action propagation<br />
speed <strong>in</strong> (x, y, σ or θ) space; and S is the total <strong>of</strong> source/s<strong>in</strong>k terms expressed as wave energy<br />
density (Booij, et al. 1999).<br />
<strong>The</strong> SWAN output has been validated <strong>in</strong> a number <strong>of</strong> studies both <strong>in</strong> field and laboratory tests<br />
and has been found to give a good approximation <strong>of</strong> the wave field <strong>in</strong> situations were the effects<br />
<strong>of</strong> diffraction are small (Booij, et al. 1999).
4. Methods 42<br />
4.2.1.2 SWAN modell<strong>in</strong>g method<br />
<strong>The</strong> objective <strong>of</strong> the SWAN wave modell<strong>in</strong>g process was to use 3 hourly w<strong>in</strong>d data <strong>in</strong>put to<br />
obta<strong>in</strong> 3 hourly estimates <strong>of</strong> break<strong>in</strong>g wave height and direction. S<strong>in</strong>ce the output <strong>of</strong> the 100 m<br />
resolution coarse run was not sufficient to evaluate the wave break<strong>in</strong>g parameters, a two part<br />
modell<strong>in</strong>g methodology was designed. This <strong>in</strong>cluded the <strong>in</strong>itial two dimensional 100 m<br />
resolution coarse run followed by a 5 m resolution one dimensional pr<strong>of</strong>ile simulation. <strong>The</strong><br />
pr<strong>of</strong>ile simulations were carried out us<strong>in</strong>g data from the output <strong>of</strong> the coarse run, extracted us<strong>in</strong>g<br />
the MATLAB program ‘tpar_make.m’ (listed <strong>in</strong> Appendix C). Follow<strong>in</strong>g the one dimensional<br />
pr<strong>of</strong>ile run break<strong>in</strong>g wave parameters had to be extracted from the output, a description <strong>of</strong> how<br />
this was done is given <strong>in</strong> 4.2.1.4. Default SWAN command options were used.<br />
While this design had limitations it was deemed the most appropriate option for the purposes <strong>of</strong><br />
the current study. Briefly, the two major drawbacks <strong>of</strong> this method were that a cont<strong>in</strong>uous<br />
estimation <strong>of</strong> <strong>transport</strong> rates could not be made around the entire shorel<strong>in</strong>e and the fact that w<strong>in</strong>d<br />
generation was not <strong>in</strong>cluded <strong>in</strong> the one dimensional pr<strong>of</strong>ile runs, mean<strong>in</strong>g that the fetch was<br />
effectively shortened by the length <strong>of</strong> the pr<strong>of</strong>ile. However this was determ<strong>in</strong>ed to be acceptable<br />
as it allowed accurate calculation <strong>of</strong> wave break<strong>in</strong>g parameters without the need <strong>of</strong> prohibitive<br />
computational resources and time and it could be carried out with already available or easily<br />
obta<strong>in</strong>able data.<br />
Figure 4.1: SWAN wave modell<strong>in</strong>g design<br />
4.2.1.3 Input Data<br />
Input data had to be converted to a specific format (see DELFT, 2004) so it could be read by the<br />
SWAN program, this was carried out us<strong>in</strong>g MATLAB.
4. Methods 43<br />
W<strong>in</strong>d<br />
Three hourly w<strong>in</strong>d data (speed and direction) measured at Rottnest Island for 2003 by the Bureau<br />
<strong>of</strong> Meteorology (BOM) was used for the simulation. <strong>The</strong> data was processed us<strong>in</strong>g the<br />
MATLAB to convert it from knots with a meteorological direction to x and y components <strong>in</strong><br />
metres per second with a cartesian direction and to account for miss<strong>in</strong>g values. Miss<strong>in</strong>g values<br />
made up ~ 3% <strong>of</strong> the total record and were filled with the mean w<strong>in</strong>d speed and direction.<br />
Coarse Bathymetry<br />
Bathymetry data with 100 m resolution was obta<strong>in</strong>ed, orig<strong>in</strong>ally from the ‘Perth Coastal Waters<br />
Study’.<br />
4.2.1.3.1 Beach Pr<strong>of</strong>iles<br />
A series <strong>of</strong> beach pr<strong>of</strong>iles were surveyed on the 11 th <strong>of</strong> September, 2004 at 9 sites around the<br />
<strong>Sound</strong> to obta<strong>in</strong> high resolution pr<strong>of</strong>ile for the areas not covered by the DPI sound<strong>in</strong>g data.<br />
Beach pr<strong>of</strong>iles were carried out accord<strong>in</strong>g to the standard beach pr<strong>of</strong>ile survey<strong>in</strong>g methods <strong>of</strong><br />
Howd & Birkemeier (1987) us<strong>in</strong>g a Geodimeter 440. Standard Survey Marks (SSM) used as<br />
start po<strong>in</strong>ts <strong>in</strong> the beach pr<strong>of</strong>ile survey<strong>in</strong>g were Peron 8; <strong>Warnbro</strong> 2; and Kennedy 65 (Figure<br />
4.2). Pr<strong>of</strong>ile Sites were chosen such that a complete picture <strong>of</strong> the sediment <strong>transport</strong> <strong>of</strong> the<br />
<strong>Sound</strong> could be obta<strong>in</strong>ed with closer spac<strong>in</strong>g to get adequate coverage <strong>of</strong> areas where high levels<br />
<strong>of</strong> change was expected to be occurr<strong>in</strong>g based on a visual <strong>in</strong>spection <strong>of</strong> aerial photographs<br />
(Figure 4.2). <strong>The</strong> raw survey data was converted to distance and elevation along the pr<strong>of</strong>ile. This<br />
was then <strong>in</strong>terpolated to 5 m resolution us<strong>in</strong>g MATLAB.<br />
<strong>Sound</strong><strong>in</strong>g L<strong>in</strong>es<br />
High resolution sound<strong>in</strong>g data obta<strong>in</strong>ed from DPI for the Safety Bay area (2002) was used to<br />
create a series <strong>of</strong> 9 ‘sound<strong>in</strong>g pr<strong>of</strong>ile l<strong>in</strong>es’ by extract<strong>in</strong>g sections <strong>of</strong> the raw sound<strong>in</strong>g data. <strong>The</strong><br />
locations <strong>of</strong> the pr<strong>of</strong>ile l<strong>in</strong>es extracted from the sound<strong>in</strong>g data are shown <strong>in</strong> Figure 4.3. <strong>The</strong>se<br />
were then processed <strong>in</strong> the same way as the beach pr<strong>of</strong>ile data.
4. Methods 44<br />
Figure 4.2: Map <strong>of</strong> beach pr<strong>of</strong>ile sites<br />
Figure 4.3: Map <strong>of</strong> sound<strong>in</strong>g pr<strong>of</strong>ile locations used
4. Methods 45<br />
4.2.1.4 Post-process<strong>in</strong>g<br />
<strong>The</strong> output <strong>of</strong> the SWAN modell<strong>in</strong>g consisted <strong>of</strong> wave <strong>of</strong> parameters at 5 m <strong>in</strong>tervals along each<br />
pr<strong>of</strong>ile, <strong>in</strong>clud<strong>in</strong>g significant wave height (HSIG), direction (DIR) and the percentage <strong>of</strong> waves<br />
break<strong>in</strong>g due to depth <strong>in</strong>duced break<strong>in</strong>g (QB). <strong>The</strong> break<strong>in</strong>g wave height and direction were<br />
extracted from this us<strong>in</strong>g the MATLAB program ‘break<strong>in</strong>g.m’ (listed <strong>in</strong> Appendix C). This<br />
program located the break<strong>in</strong>g position at each site, for each time-step, by f<strong>in</strong>d<strong>in</strong>g the maximum<br />
value <strong>of</strong> QB. It then extracted the correspond<strong>in</strong>g wave height and direction for that position.<br />
4.3 Modell<strong>in</strong>g the effect <strong>of</strong> the Garden Island Ridge on swell<br />
Pitchen (1993) proposed that the <strong>in</strong>itial formation <strong>of</strong> the Tern Island sand bar was due to a region<br />
<strong>of</strong> low energy. This was created along the axis <strong>of</strong> the sand bar by the diffraction and refraction<br />
<strong>of</strong> the prevail<strong>in</strong>g SW swell which passes through the Garden Island Ridge and over the north<br />
sands platform. It is proposed <strong>in</strong> this research that the low energy zone is required only for the<br />
<strong>in</strong>itial formation <strong>of</strong> the shoal. <strong>The</strong> ma<strong>in</strong>tenance <strong>of</strong> the bar is then governed by the <strong>in</strong>teraction <strong>of</strong><br />
swell waves with the bar itself. S<strong>in</strong>ce SWAN does not calculate the effects <strong>of</strong> wave diffraction<br />
the numerical wave model REF/DIF1 was used to test this hypothesis.<br />
4.3.1 REF/DIF1 Background<br />
<strong>The</strong> REF/DIF1 model is a phase-resolv<strong>in</strong>g, weakly non-l<strong>in</strong>ear, comb<strong>in</strong>ed refraction-diffraction<br />
model developed by Kirby & Dalrymple which <strong>in</strong>corporates the effects <strong>of</strong> shoal<strong>in</strong>g, refraction,<br />
energy dissipation and diffraction (Kirby & Dalrymple, 1994). It has been designed to predict<br />
the propagation <strong>of</strong> a monochromatic wave <strong>in</strong> <strong>in</strong>termediate water depths us<strong>in</strong>g second order<br />
Stokes wave theory <strong>in</strong>clud<strong>in</strong>g the third order correction to the wave phase speed (CERC, 2002).<br />
<strong>The</strong> model is based on the parabolic estimation <strong>of</strong> the mild-slope, wave-current model equation<br />
developed by Kirby (1984), which may be written as:<br />
2 2<br />
( CC ∇ϕ) + ( σ − k ) = 0<br />
2<br />
D ϕ Dϕ<br />
+ ∇ ⋅U<br />
− ∇ ⋅<br />
ϕ<br />
2<br />
g<br />
CC g<br />
Dt Dt<br />
(4.1)<br />
Where φ is the velocity potential at the free surface and:
4. Methods 46<br />
D<br />
Dt<br />
∂<br />
= + U<br />
∂t<br />
⋅ ∇<br />
(4.2)<br />
⎛<br />
∇ = ⎜<br />
⎝<br />
∂ ⎞<br />
⎟<br />
x , ∂y<br />
⎠<br />
(4.3)<br />
∂<br />
∂<br />
( U ( x,<br />
y),<br />
V ( x,<br />
y))<br />
U = (4.4)<br />
σ = ω − k ⋅U<br />
(4.5)<br />
C = σ<br />
(4.6)<br />
k<br />
∂<br />
C g<br />
= σ (4.7)<br />
∂k<br />
2<br />
σ = gk ⋅ tanh( kh)<br />
(4.8)<br />
REF/DIF1 has been shown to be capable <strong>of</strong> provid<strong>in</strong>g a detailed picture <strong>of</strong> the water surface,<br />
<strong>in</strong>clud<strong>in</strong>g the geometry <strong>of</strong> crests and troughs as well as the location <strong>of</strong> regions <strong>of</strong> high or low<br />
wave heights. <strong>The</strong> results <strong>of</strong> laboratory verification tests demonstrate the higher-order parabolic<br />
approximation, together with nonl<strong>in</strong>ear correction to the wave phase speed, can correctly predict<br />
the distribution <strong>of</strong> wave heights and nodal po<strong>in</strong>ts <strong>in</strong> the evolv<strong>in</strong>g wave field (CERC, 2002).<br />
4.3.2 REF/DIF1 Inputs<br />
<strong>The</strong> REF/DIF1 simulation was carried out us<strong>in</strong>g the default command options and required the<br />
<strong>in</strong>put <strong>of</strong> bathymetry data and <strong>in</strong>com<strong>in</strong>g wave conditions. <strong>The</strong> bathymetry data was obta<strong>in</strong>ed<br />
from the ‘Perth Coastal Waters Study’, which provided 100 m resolution data relative to mean<br />
sea level. For use <strong>in</strong> the REF/DIF1 simulation a section compris<strong>in</strong>g the whole <strong>of</strong> <strong>Warnbro</strong><br />
<strong>Sound</strong> extend<strong>in</strong>g westward to just past the Garden Island Ridge was extracted from the orig<strong>in</strong>al<br />
data. This was then <strong>in</strong>terpolated us<strong>in</strong>g MATLAB to obta<strong>in</strong> a 50 m resolution grid. <strong>The</strong> wave<br />
<strong>in</strong>put parameters used were those identified by Lemm et al. (1999) to be the annual mean<br />
prevail<strong>in</strong>g <strong>of</strong>fshore wave conditions, with wave height 2.0 m; period 9 sec; and direction from<br />
the SW used. . Default command options were used.
4. Methods 47<br />
4.4 Application <strong>of</strong> the ‘parabolic bay shape equation’ to Tern Island<br />
In an effort to predict the future shorel<strong>in</strong>e changes <strong>in</strong> the vic<strong>in</strong>ity <strong>of</strong> the Tern Island sandbar<br />
equilibrium beach planform shapes were estimated based upon the parabolic bay shape model.<br />
This was carried out us<strong>in</strong>g the s<strong>of</strong>tware package MEPBay.<br />
From observation <strong>of</strong> aerial photographs, the shape <strong>of</strong> the shorel<strong>in</strong>e <strong>in</strong> the vic<strong>in</strong>ity <strong>of</strong> the Tern<br />
Island sand bar suggests that s<strong>in</strong>ce it has become a major presence the sandbar is exert<strong>in</strong>g<br />
‘headland control’ upon the beaches, which appear to have the shape <strong>of</strong> embayed beaches.<br />
Due to their morphological importance, several empirical models have been proposed to fit<br />
curves to the shorel<strong>in</strong>es <strong>of</strong> curved beaches <strong>in</strong>clud<strong>in</strong>g the logarithmic spiral, hyperbolic tangent;<br />
and parabolic bay shape models. <strong>The</strong> most well received be<strong>in</strong>g the parabolic bay shape equation,<br />
proposed by Hsu and Evans (1989) which is recognised <strong>in</strong> the current (2002) Coastal<br />
Eng<strong>in</strong>eer<strong>in</strong>g Manual as be<strong>in</strong>g <strong>of</strong> use <strong>in</strong> coastal sediment processes and shore protection projects.<br />
(Kle<strong>in</strong> et al., 2003)<br />
4.4.1 Parabolic bay shape equation<br />
Proposed by Evans and Hsu (1989) the parabolic bay shape for a headland bay beach <strong>in</strong> static<br />
equilibrium is described by the follow<strong>in</strong>g equation:<br />
R<br />
R<br />
n<br />
β<br />
= C<br />
⎛ β ⎞<br />
+ C<br />
⎜<br />
⎟ + C<br />
⎛ β ⎞<br />
⎜<br />
0 1<br />
2 ⎟ ⎝θ<br />
n ⎠ ⎝θ<br />
n ⎠<br />
2<br />
(4.9)<br />
Where: β is the reference wave angle and R β the control l<strong>in</strong>e length (represent<strong>in</strong>g the distance<br />
between the up-coast and down-coast control po<strong>in</strong>ts). R n is the distance to any po<strong>in</strong>t around the<br />
bay periphery angled at θ n from the wave crest l<strong>in</strong>e.
4. Methods 48<br />
Figure 4.4: Wave–headland–beach relationship for a bayed beach <strong>in</strong> static equilibrium (from Kle<strong>in</strong>, 2003)<br />
<strong>The</strong> constants C 0 , C 1 and C 2 are dependant upon the reference angle (β) and were generated by<br />
regression analysis to fit the peripheries <strong>of</strong> 27 prototype and model bays and are given by:<br />
C<br />
2<br />
3<br />
0<br />
= .0707 − 0.0047β + 0.000349β<br />
− 0.00000875β<br />
+ 0.00000004765<br />
4<br />
0 β<br />
(4.10)<br />
C<br />
2<br />
3<br />
1<br />
= .9536 + 0.0078β<br />
− 0.00004879β<br />
+ 0.0000182β<br />
− 0. 0000001281<br />
4<br />
0 β<br />
(4.11)<br />
C<br />
2<br />
3<br />
2<br />
= .0214 − 0.0078β + 0.0003004β<br />
− 0.00001183β<br />
+ 0.00000009343<br />
4<br />
0 β<br />
(4.12)<br />
<strong>The</strong> parabolic bay shape equation has been verified by Silvester and Hsu (1993, 1997) for<br />
various situations.<br />
MEPBay is a s<strong>of</strong>tware package developed by Kle<strong>in</strong> et al. (2003) for the application <strong>of</strong> the<br />
parabolic bay shape equation. Us<strong>in</strong>g this s<strong>of</strong>tware, up-coast control po<strong>in</strong>t, down-coast control<br />
po<strong>in</strong>t and wave direction are def<strong>in</strong>ed on a digitised aerial photograph then the equilibrium bay<br />
shape is calculated and plotted over the photograph (Kle<strong>in</strong> et al., 2003).<br />
In apply<strong>in</strong>g this to Tern Island, the equilibrium bay shapes were calculated for the western and<br />
eastern sides <strong>of</strong> the sand bar based upon control po<strong>in</strong>ts estimated from the aerial photographs.
5. Results and Discussion 49<br />
5 RESULTS & DISCUSSION<br />
A number <strong>of</strong> methods were used, both qualitative and quantitative, to exam<strong>in</strong>e the large scale<br />
sediment dynamics <strong>of</strong> the <strong>Sound</strong>. Each will be considered <strong>in</strong> turn before be<strong>in</strong>g comb<strong>in</strong>ed to<br />
create an overall picture <strong>of</strong> the net sediment movements occurr<strong>in</strong>g <strong>in</strong> the <strong>Sound</strong>. <strong>The</strong> Tern Island<br />
sand bar has been identified as particularly important to future dynamics <strong>of</strong> the area and as such<br />
will be considered <strong>in</strong> detail. Follow<strong>in</strong>g this, predictions <strong>of</strong> future coastl<strong>in</strong>e change will be made<br />
based upon a comb<strong>in</strong>ation <strong>of</strong> all the prior analysis.<br />
5.1 Qualitative estimation <strong>of</strong> sediment <strong>transport</strong><br />
<strong>The</strong> qualitative estimation <strong>of</strong> sediment <strong>transport</strong> <strong>in</strong>volved analysis <strong>of</strong> coastl<strong>in</strong>e plots to evaluate<br />
past changes and observation <strong>of</strong> aerial photographs to determ<strong>in</strong>e likely sediment <strong>transport</strong><br />
directions.<br />
5.1.1 Coastl<strong>in</strong>e movement plots<br />
From the prelim<strong>in</strong>ary analysis <strong>of</strong> coastl<strong>in</strong>e movement plots three areas <strong>of</strong> significant change were<br />
identified: Mersey Po<strong>in</strong>t, Safety Bay; and Becher Po<strong>in</strong>t. <strong>The</strong> extent <strong>of</strong> these regions is shown <strong>in</strong><br />
Figure 5.1. Coastl<strong>in</strong>e movement plots were analysed for each area to exam<strong>in</strong>e the change to the<br />
shorel<strong>in</strong>e planform, these are given <strong>in</strong> Appendices A1, A2 and A3. <strong>The</strong> major changes <strong>in</strong> each<br />
area will be discussed, <strong>in</strong>clud<strong>in</strong>g the possible reasons beh<strong>in</strong>d the changes. <strong>The</strong>re was no<br />
significant coastl<strong>in</strong>e movement observed on <strong>Warnbro</strong> Beach <strong>in</strong> the central section <strong>of</strong> the <strong>Sound</strong><br />
(front<strong>in</strong>g the central bas<strong>in</strong>), further<strong>in</strong>g the notion that it is <strong>in</strong> ‘equilibrium’. This <strong>in</strong>dicates a<br />
neutral sediment balance when consider<strong>in</strong>g all possible fluxes.<br />
Figure 5.1: Areas <strong>of</strong> coastl<strong>in</strong>e movement plots
5. Results and Discussion 50<br />
5.1.1.1 Mersey Po<strong>in</strong>t<br />
Between 1942 and 1973 significant accretion occurred on the western flank <strong>of</strong> Mersey Po<strong>in</strong>t and<br />
<strong>in</strong> Shoalwater Bay. Between 1976 and 1991 Mersey Po<strong>in</strong>t accreted, with its alignment shift<strong>in</strong>g<br />
towards the SW. S<strong>in</strong>ce the Po<strong>in</strong>t is ma<strong>in</strong>ta<strong>in</strong>ed by the convergence <strong>of</strong> waves pass<strong>in</strong>g around<br />
Pengu<strong>in</strong> Island this <strong>in</strong>dicates a higher level <strong>of</strong> wave energy from the SW. <strong>The</strong> southern marg<strong>in</strong><br />
<strong>of</strong> the po<strong>in</strong>t has accreted s<strong>in</strong>ce 1976; it is possible that this <strong>in</strong>dicates a reduced level <strong>of</strong> NW storm<br />
energy. Under <strong>in</strong>creased NW storm energy waves diffracted through the Mersey Po<strong>in</strong>t –<br />
Pengu<strong>in</strong> Island open<strong>in</strong>g will move sand from Mersey po<strong>in</strong>t eastward along the along the Safety<br />
Bay shore. This will result <strong>in</strong> the erosion <strong>of</strong> the southern marg<strong>in</strong> <strong>of</strong> the Po<strong>in</strong>t. Mersey po<strong>in</strong>t is<br />
entirely sedimentary and its position is controlled by the effect <strong>of</strong> Pengu<strong>in</strong> Island on <strong>in</strong>com<strong>in</strong>g<br />
waves. <strong>The</strong>refore changes to the po<strong>in</strong>t are likely to be due to the predom<strong>in</strong>ant direction <strong>of</strong> wave<br />
energy as well as the sediment supply.<br />
5.1.1.2 Safety Bay<br />
Prior to 1964 erosion occurred <strong>in</strong> the eastern section <strong>of</strong> Safety Bay. This resulted <strong>in</strong> the<br />
construction <strong>of</strong> the protective rock wall and is likely to be due to higher levels <strong>of</strong> NW storm<br />
activity <strong>in</strong>creas<strong>in</strong>g the movement <strong>of</strong> sand eastward <strong>in</strong> Safety Bay. This is supported by the<br />
relatively high frequency <strong>of</strong> NW storm activity dur<strong>in</strong>g the 1940s – 1950s (Personal<br />
Communication: Ian Eliot). This region has slowly accreted s<strong>in</strong>ce 1982 <strong>in</strong>dicat<strong>in</strong>g that these<br />
sand movements have been less frequent or less <strong>in</strong>tense, correspond<strong>in</strong>g to the reduced frequency<br />
<strong>of</strong> NW storms. <strong>The</strong> rate <strong>of</strong> accretion has <strong>in</strong>creased s<strong>in</strong>ce Tern Island jo<strong>in</strong>ed the shorel<strong>in</strong>e, likely<br />
to be due to the accumulation <strong>of</strong> sediment to the west <strong>of</strong> the sand bar.<br />
<strong>The</strong> Safety Bay shorel<strong>in</strong>e has advanced s<strong>in</strong>ce 1959, <strong>in</strong> the lee <strong>of</strong> the Tern Island sand bar. This<br />
suggests the formation <strong>of</strong> a salient caused by the alteration <strong>of</strong> the wave field by the sand bar,<br />
creat<strong>in</strong>g a wave convergence zone <strong>in</strong> its lee. <strong>The</strong> sand bar also appears to have contributed to the<br />
sediment budget <strong>of</strong> the region, <strong>in</strong>creas<strong>in</strong>g availability <strong>of</strong> sand. S<strong>in</strong>ce the sand bar jo<strong>in</strong>ed the<br />
coast the Safety bay shorel<strong>in</strong>e to the east <strong>of</strong> it has rapidly accreted, adopt<strong>in</strong>g a shape similar to<br />
that <strong>of</strong> an embayed beach. Over the same period there has been no observable change to the<br />
shorel<strong>in</strong>e directly to the east <strong>of</strong> the bar.<br />
5.1.1.3 Becher Po<strong>in</strong>t<br />
Over the past 40 years Becher Po<strong>in</strong>t has experienced much change <strong>in</strong> both its length and<br />
alignment. Extensive erosion was experienced by the coastl<strong>in</strong>e directly to the south <strong>of</strong> Becher
5. Results and Discussion 51<br />
Po<strong>in</strong>t between 1967 and 1976. Between 1967 and 1987 the po<strong>in</strong>t was diverted a considerable<br />
distance northward. From 1987 to 2000 the length <strong>of</strong> the po<strong>in</strong>t was reduced due to erosion.<br />
Accord<strong>in</strong>g to Silvester (1987) <strong>in</strong> the late 1960’s a large collapse occurred <strong>in</strong> the reef just south <strong>of</strong><br />
Becher Po<strong>in</strong>t. Such a collapse would have altered the wave energy reach<strong>in</strong>g the Po<strong>in</strong>t and the<br />
area directly to the south and is likely to be the reason beh<strong>in</strong>d the extensive erosion experienced<br />
between 1967 and 1976 by the shorel<strong>in</strong>e to the south <strong>of</strong> Becher Po<strong>in</strong>t (Silvester, 1987).<br />
S<strong>in</strong>ce Becher Po<strong>in</strong>t is entirely sedimentary, its position and ma<strong>in</strong>tenance is controlled by the<br />
balance <strong>of</strong> energy from the north and south. This balance is controlled by both the wave<br />
transmission through the Garden Island Ridge as well as the relative frequencies <strong>of</strong> NW and SW<br />
storm events as well as the contributions <strong>of</strong> swell and sea breeze. Changes to this energy ratio<br />
due to reef collapse or altered storm frequency will alter the alignment <strong>of</strong> the Po<strong>in</strong>t. For example<br />
if a strong, long duration storm from the NW occurred, or NW storms were more frequent, the<br />
Po<strong>in</strong>t could be diverted southward. If energy from the SW <strong>in</strong>creased due to more frequent SW<br />
storms or reef collapse occurred to the south <strong>of</strong> the Po<strong>in</strong>t its alignment could be diverted<br />
northward with material be<strong>in</strong>g deposited on the coast to the west <strong>of</strong> Bridport Po<strong>in</strong>t (Silvester,<br />
1987).<br />
<strong>The</strong>refore the northward diversion <strong>of</strong> the Po<strong>in</strong>t occurr<strong>in</strong>g between 1967 and 1987 could be due to<br />
either the reef collapse discussed earlier or a reduced level <strong>of</strong> energy from the NW associated<br />
with NW storms be<strong>in</strong>g less frequent over this period. <strong>The</strong> later is the more likely s<strong>in</strong>ce the<br />
effects <strong>of</strong> the reef collapse would not have cont<strong>in</strong>ued for 20 – 30 years, as it is expected that<br />
equilibrium would have been established far earlier and it has been identified that the frequency<br />
<strong>of</strong> NW storms has decreased over this time period.<br />
<strong>The</strong> extensive erosion experienced to the south <strong>of</strong> Becher Po<strong>in</strong>t as a result <strong>of</strong> reef collapse <strong>in</strong> the<br />
1960’s demonstrates the possible effects that further reef collapse can have on the shorel<strong>in</strong>e<br />
position <strong>of</strong> the <strong>Sound</strong>.<br />
5.1.2 Aerial Photographs - <strong>in</strong>dicators <strong>of</strong> sediment dynamics<br />
Geomorphic features for use as <strong>in</strong>dicators <strong>of</strong> the direction <strong>of</strong> net sand movement and temporal<br />
geomorphic changes which may also <strong>in</strong>dicate possible <strong>transport</strong> directions were observed form<br />
aerial photographs.
5. Results and Discussion 52<br />
Figure 5.2: Photo show<strong>in</strong>g relevant <strong>in</strong>dicators <strong>of</strong> sediment dynamics<br />
South sands platform<br />
A sand shoal extends from a sand deposit, <strong>in</strong> the lee <strong>of</strong> the Garden Island Ridge, to the coast<br />
between Becher and Bridport Po<strong>in</strong>ts (Figure 5.3). This shoal appears to follow the path <strong>of</strong> swell<br />
diffracted through the open<strong>in</strong>gs <strong>in</strong> the ridge, arriv<strong>in</strong>g normal to the shorel<strong>in</strong>e. A small salient has<br />
formed where this shoal meets the shore and <strong>in</strong> the current high resolution SKVIEW image<br />
(DOLA, 2004) wave convergence over the shoal is evident. This suggests that sand is be<strong>in</strong>g
5. Results and Discussion 53<br />
<strong>transport</strong>ed shoreward along the shoal due to the convergence <strong>of</strong> swell waves over it, similar to<br />
the mechanism described by Carter (1988) for the shoreward migration <strong>of</strong> a transverse sand bar<br />
(see 3.1, p30). It is believed that this is a similar situation to that <strong>of</strong> the Tern Island sand bar but<br />
with a smaller <strong>in</strong>itial deposit <strong>of</strong> sand.<br />
Figure 5.3: Sand shoal meet<strong>in</strong>g the shore near Becher Po<strong>in</strong>t (2000)<br />
<strong>The</strong> shape <strong>of</strong> the south sands platform is also believed to be significant. <strong>The</strong>re are two lobes on<br />
the edge <strong>of</strong> the platform adjo<strong>in</strong><strong>in</strong>g the central bas<strong>in</strong>. It is believed that these lobes are the result<br />
<strong>of</strong> diffraction <strong>of</strong> swell waves through the open<strong>in</strong>gs on the Garden Island Ridge form<strong>in</strong>g wave<br />
convergence zones centred on sections <strong>of</strong> the reef. This is supported by both the lobes be<strong>in</strong>g<br />
directly to the NE <strong>of</strong> sections <strong>of</strong> unbroken reef. In addition to this, the growth <strong>of</strong> the lobes<br />
requires an <strong>in</strong>put <strong>of</strong> sediment. This is believed to orig<strong>in</strong>ate from south <strong>of</strong> the <strong>Sound</strong> and migrate<br />
northward over the sand platform.<br />
<strong>Sediment</strong> trapp<strong>in</strong>g groyne<br />
A sediment trapp<strong>in</strong>g groyne was <strong>in</strong>stalled <strong>in</strong> the south <strong>of</strong> <strong>Warnbro</strong> Beach <strong>in</strong> 1986 to measure<br />
longshore sediment <strong>transport</strong> rates. A photograph <strong>of</strong> the groyne taken <strong>in</strong> February 1987, Figure<br />
5.4, clearly shows an accumulation <strong>of</strong> sediment on the southern side as well as some erosion on<br />
the northern side. S<strong>in</strong>ce this is at the end <strong>of</strong> the summer period it may simply represent the<br />
northward longshore <strong>transport</strong> due to the sea breeze. However, Figure 5.5, taken <strong>in</strong> November<br />
1990 before the summer period, shows a similar but <strong>in</strong>creased accumulation, suggest<strong>in</strong>g that it is<br />
not just a seasonal effect rather it is a net northward <strong>transport</strong> <strong>in</strong> the centre <strong>of</strong> the <strong>Sound</strong>.
5. Results and Discussion 54<br />
Figure 5.4: Shore normal groyne <strong>in</strong> the south <strong>of</strong><br />
<strong>Warnbro</strong> <strong>Sound</strong> (02/1987)<br />
Figure 5.5: Shore normal groyne <strong>in</strong> the south <strong>of</strong><br />
<strong>Warnbro</strong> <strong>Sound</strong> (11/1990)<br />
<strong>Warnbro</strong> Beach dunes<br />
High well developed foredunes exist around <strong>Warnbro</strong> Beach <strong>in</strong> the central section <strong>of</strong> the <strong>Sound</strong>.<br />
<strong>The</strong>se suggest a positive sand supply to the dune system from the beach as well as little shorel<strong>in</strong>e<br />
movement (see 3.4, p36).<br />
Figure 5.6: <strong>Warnbro</strong> Beach Dunes (high resolution aerial photographs not available)<br />
Large parabolic dunes exist <strong>in</strong> the southern two thirds <strong>of</strong> <strong>Warnbro</strong> Beach, particularly <strong>in</strong> the<br />
central section (DOLA, 2004). Parabolic dunes require strong onshore w<strong>in</strong>ds and a large amount<br />
<strong>of</strong> sediment from the beach for the dune to form and be ma<strong>in</strong>ta<strong>in</strong>ed and therefore are likely to<br />
represent a large sediment s<strong>in</strong>k for the <strong>Warnbro</strong> Beach system.
5. Results and Discussion 55<br />
Garden Island Ridge<br />
Large sand deposits exist <strong>in</strong> the lee <strong>of</strong> the unbroken sections <strong>of</strong> the reef (Figure 5.2). <strong>The</strong>re also<br />
appears to be deposits <strong>of</strong> sand extend<strong>in</strong>g through open<strong>in</strong>gs <strong>in</strong> the reef (Figure 5.2). <strong>The</strong><br />
existence <strong>of</strong> these sand deposits reef strongly suggests a <strong>transport</strong> across the Garden Island<br />
Ridge. <strong>The</strong> generally SW – NE orientation <strong>of</strong> the deposits suggests that the <strong>transport</strong> is due to the<br />
prevail<strong>in</strong>g SW swell.<br />
Tern Island sand bar<br />
A well def<strong>in</strong>ed sand shoal extends from a sand deposit <strong>in</strong> the lee <strong>of</strong> the Garden Island Ridge to<br />
the tail <strong>of</strong> the tern island sand bar (Figure 5.2). Wave convergence along the shoal is expected to<br />
drive a sediment <strong>transport</strong> down the shoal towards the sand bar. <strong>The</strong> time series <strong>of</strong> photos <strong>of</strong> the<br />
Safety Bay area (Appendix B) <strong>in</strong>dicate that there has been little change to the eastern side <strong>of</strong> the<br />
sand bar s<strong>in</strong>ce 1996, while the western side has developed significantly extend<strong>in</strong>g to jo<strong>in</strong> the<br />
coast. A submerged platform has developed on the sand bar’s western flank, the size <strong>of</strong> which<br />
appears to be <strong>in</strong>creas<strong>in</strong>g. <strong>The</strong>re is no such feature on the eastern side. This suggests that sand<br />
<strong>transport</strong>ed along the bar moves along the western flank but not along the eastern flank. S<strong>in</strong>ce<br />
jo<strong>in</strong><strong>in</strong>g the shore there has been an accumulation <strong>of</strong> sand on the western side <strong>of</strong> the bar with the<br />
coastl<strong>in</strong>e advanc<strong>in</strong>g considerably. Over the same period there has been no change to the<br />
shorel<strong>in</strong>e immediately to the sand bar’s east <strong>in</strong>dicat<strong>in</strong>g there is no net sediment supply to this<br />
area.<br />
Pengu<strong>in</strong> Island Tombolo<br />
<strong>The</strong> size and cont<strong>in</strong>uity <strong>of</strong> the Pengu<strong>in</strong> Island Tombolo has changed periodically and is expected<br />
to be due to recent events. In recent aerial photographs the landward end <strong>of</strong> the tombolo has been<br />
consistently hooked towards the south (Figure 5.7). This is observed <strong>in</strong> photographs from both<br />
the beg<strong>in</strong>n<strong>in</strong>g and end <strong>of</strong> the summer period. This suggests a possible south – east net sediment<br />
<strong>transport</strong> around Mersey Po<strong>in</strong>t.<br />
Figure 5.7: Pengu<strong>in</strong> Island Tombolo (2000)
5. Results and Discussion 56<br />
5.2 Numerical estimation <strong>of</strong> sediment <strong>transport</strong><br />
<strong>The</strong> results presented are the estimated net <strong>transport</strong> volumes for w<strong>in</strong>d wave driven longshore<br />
<strong>transport</strong> for 2003, over both annual and monthly time periods at each site. <strong>The</strong>y are given <strong>in</strong> two<br />
parts, the first conta<strong>in</strong><strong>in</strong>g <strong>transport</strong> volumes for the beach pr<strong>of</strong>ile sites around the <strong>Sound</strong> and the<br />
second focus<strong>in</strong>g on the sound<strong>in</strong>g sites <strong>in</strong> the Safety Bay area. Pr<strong>of</strong>ile 1 was not used as it was<br />
decided that the pr<strong>of</strong>ile length was too short to take <strong>in</strong>to account the effects the Tern Island and<br />
the Berry Street sand bars have <strong>in</strong> shelter<strong>in</strong>g the site from wave energy. <strong>The</strong> analysis <strong>of</strong> this data<br />
was restricted due to limitations associated with the results discussed below.<br />
5.2.1 Annual <strong>transport</strong> volumes<br />
Figure 5.8: Estimated annual longshore <strong>transport</strong> volumes at each <strong>of</strong> the pr<strong>of</strong>ile sites (m 3 yr -1 )<br />
<strong>The</strong> results for the pr<strong>of</strong>ile sites show a clear net northward <strong>transport</strong> around the southern and<br />
central sections <strong>of</strong> the <strong>Sound</strong>. <strong>The</strong> magnitudes vary due to the exposure or orientation <strong>of</strong> the<br />
sites, particularly <strong>in</strong> relation to the sea breeze. <strong>The</strong> most noticeable feature is the significant<br />
amount <strong>of</strong> sand which appears to be ‘lost’ between sites P3 and P2 where the annual <strong>transport</strong><br />
volume decreases by a factor <strong>of</strong> 4. S<strong>in</strong>ce there as been no change to this coastl<strong>in</strong>e over a long
5. Results and Discussion 57<br />
period <strong>of</strong> time this may <strong>in</strong>dicate the existence <strong>of</strong> a large sediment s<strong>in</strong>k. <strong>The</strong> discont<strong>in</strong>uities<br />
around <strong>Warnbro</strong> Beach suggest that the longshore <strong>transport</strong> <strong>of</strong> this area can not be accurately<br />
estimated us<strong>in</strong>g only locally generated w<strong>in</strong>d waves. It may also represent an error associated<br />
with the pr<strong>of</strong>ile angles but this is believed to be unlikely as the variation is roughly uniform<br />
around <strong>Warnbro</strong> Beach. <strong>The</strong> large change between P9 and P7, where the <strong>transport</strong> volume<br />
<strong>in</strong>creases by a factor <strong>of</strong> 3, may suggest that there is a significant cross-shore sediment <strong>in</strong>put <strong>in</strong><br />
the Becher Po<strong>in</strong>t – Bridport Po<strong>in</strong>t region.<br />
It is also apparent that the longshore <strong>transport</strong> with<strong>in</strong> the <strong>Sound</strong> is much less than that <strong>of</strong> the<br />
open coast. <strong>The</strong> estimated <strong>transport</strong> volumes with<strong>in</strong> the <strong>Sound</strong> are <strong>of</strong> the order <strong>of</strong> only a few<br />
thousand cubic meters per year, much less than the 60,000 m 3 .yr -1 estimated for Madora Bay by<br />
Searle and Logan (1979). This large difference is partly due to the limited fetch with<strong>in</strong> the<br />
<strong>Sound</strong>.<br />
Figure 5.9: Estimated annual longshore <strong>transport</strong> volumes at each <strong>of</strong> the sound<strong>in</strong>g sites (m 3 yr -1 )<br />
<strong>The</strong> results from the sound<strong>in</strong>g sites <strong>in</strong>dicate a clear net eastward <strong>transport</strong> <strong>in</strong> Safety Bay.<br />
Transport volumes <strong>in</strong> this region are small which is likely to be due to the shelter<strong>in</strong>g effect <strong>of</strong> the<br />
north sands platform and the sand bars and sand shoals <strong>in</strong> the area. Also the orientation <strong>of</strong> the<br />
sites, almost normal, to the sea breeze will limit its effect on the longshore <strong>transport</strong>.<br />
A m<strong>in</strong>imal, almost zero, net <strong>transport</strong> was calculated directly to the east <strong>of</strong> the Tern Island sand<br />
bar. This is due to extensive shelter<strong>in</strong>g from the Tern Island and Berry Street sand bars.
5. Results and Discussion 58<br />
<strong>The</strong> accuracy <strong>of</strong> the <strong>in</strong>creas<strong>in</strong>g <strong>transport</strong> <strong>in</strong> S8 and S9 is questionable when compared to the<br />
northward <strong>transport</strong> estimated for P2. A possible explanation is that it is due to error associated<br />
with the modell<strong>in</strong>g procedure (see 5.2.3, p59).<br />
5.2.2 Monthly Transport Volumes<br />
Monthly <strong>transport</strong> volumes were <strong>in</strong>cluded to demonstrate the seasonality <strong>of</strong> the longshore<br />
<strong>transport</strong> and to illustrate how this seasonal variation varies with the orientation and exposure <strong>of</strong><br />
the sites. Figure 5.10 and Figure 5.11 show the net monthly <strong>transport</strong> volumes for 2003. A<br />
positive value <strong>in</strong>dicates an up-coast (northward) <strong>transport</strong>, while a negative value represents a<br />
down-coast (southward) <strong>transport</strong>.<br />
1600.00<br />
1400.00<br />
1200.00<br />
1000.00<br />
800.00<br />
600.00<br />
400.00<br />
200.00<br />
0.00<br />
-200.00<br />
-400.00<br />
January<br />
February<br />
March<br />
April<br />
May<br />
June<br />
July<br />
August<br />
September<br />
October<br />
November<br />
December<br />
(m 3 /month)<br />
Pr<strong>of</strong>ile 2<br />
Pr<strong>of</strong>ile 3<br />
Pr<strong>of</strong>ile 4<br />
Pr<strong>of</strong>ile 5<br />
Pr<strong>of</strong>ile 6<br />
Pr<strong>of</strong>ile 7<br />
Pr<strong>of</strong>ile 8<br />
Pr<strong>of</strong>ile 9<br />
Figure 5.10: Estimated 2003 monthly longshore <strong>transport</strong> volumes (Pr<strong>of</strong>iles)<br />
Pr<strong>of</strong>iles 2 to 6 <strong>in</strong>clusive all show a clear seasonal variation <strong>in</strong> the <strong>transport</strong> direction. This<br />
appears to follow the seasonal variation <strong>in</strong> the w<strong>in</strong>d field which is expected as these sites are<br />
located <strong>in</strong> the central, most exposed, section <strong>of</strong> the <strong>Sound</strong>. Sites 7, 8 and 9 do not show this<br />
seasonality. This is probably due to the almost E –W orientation <strong>of</strong> the section <strong>of</strong> coastl<strong>in</strong>e they<br />
lie on which has limited fetch for w<strong>in</strong>ds from the S-SW. <strong>The</strong> <strong>transport</strong> volumes dur<strong>in</strong>g the<br />
w<strong>in</strong>ter months have a much smaller variance between sites than those dur<strong>in</strong>g the summer<br />
months. It is likely that this is a result <strong>of</strong> summer <strong>transport</strong> be<strong>in</strong>g dom<strong>in</strong>ated by the sea breeze<br />
and the sites hav<strong>in</strong>g the greatest fetch variation for S – SW w<strong>in</strong>ds.
5. Results and Discussion 59<br />
200.00<br />
100.00<br />
0.00<br />
-100.00<br />
-200.00<br />
-300.00<br />
-400.00<br />
-500.00<br />
-600.00<br />
January<br />
February<br />
March<br />
April<br />
May<br />
June<br />
July<br />
August<br />
September<br />
October<br />
November<br />
December<br />
(m 3 /month)<br />
<strong>Sound</strong> 1<br />
<strong>Sound</strong> 2<br />
<strong>Sound</strong> 3<br />
<strong>Sound</strong> 4<br />
<strong>Sound</strong> 5<br />
<strong>Sound</strong> 6<br />
<strong>Sound</strong> 7<br />
<strong>Sound</strong> 8<br />
<strong>Sound</strong> 9<br />
Figure 5.11: Estimated 2003 monthly longshore <strong>transport</strong> volumes (<strong>Sound</strong><strong>in</strong>gs)<br />
<strong>The</strong> monthly <strong>transport</strong> volume for all sound<strong>in</strong>g sites follows the same general seasonal trend.<br />
This is due to the close proximity and similar orientation <strong>of</strong> theses sites. Dur<strong>in</strong>g the w<strong>in</strong>ter<br />
months the <strong>transport</strong> volumes are generally more negative or up-coast while <strong>in</strong> summer they are<br />
more positive and around zero. <strong>The</strong> variations <strong>in</strong> the magnitudes are likely to be due to<br />
shelter<strong>in</strong>g provided by the Tern Island and Berry Street sand bars.<br />
5.2.3 Limitations <strong>of</strong> the numerical modell<strong>in</strong>g study<br />
Caution must be employed when analys<strong>in</strong>g the data from this numerical modell<strong>in</strong>g. <strong>The</strong> output<br />
is subject to a number <strong>of</strong> important limitations which significantly reduce the level <strong>of</strong> confidence<br />
and have limited the extent <strong>of</strong> analysis possible.<br />
It was found that the output <strong>of</strong> the CERC equation was very sensitive to the breaker angle, which<br />
was calculated us<strong>in</strong>g the estimated pr<strong>of</strong>ile angle and wave direction. A one degree adjustment to<br />
the pr<strong>of</strong>ile angle results <strong>in</strong> a change <strong>of</strong> up to 25% <strong>in</strong> the calculated annual <strong>transport</strong> volume. This<br />
problematic due to the fact that pr<strong>of</strong>ile angles were estimated from coastl<strong>in</strong>e plots and are not<br />
exact. As such, they have an associated error <strong>of</strong> the order <strong>of</strong> about 5 degrees. On a straight<br />
stretch <strong>of</strong> coastl<strong>in</strong>e the orientation could be estimated to a much higher accuracy. <strong>The</strong> sensitivity<br />
<strong>of</strong> the results to changes <strong>in</strong> the pr<strong>of</strong>ile angle means that they can not be used with any confidence<br />
<strong>in</strong> volumetric analysis or sediment budget calculations.
5. Results and Discussion 60<br />
Consideration <strong>of</strong> the modell<strong>in</strong>g output suggested that w<strong>in</strong>d waves and swell can not be<br />
considered as separate, with the effects <strong>of</strong> each be<strong>in</strong>g mutually exclusive. Swell, local w<strong>in</strong>ds and<br />
locally generated w<strong>in</strong>d waves <strong>in</strong>teract with each other to form the nearshore wave climate. <strong>The</strong><br />
result<strong>in</strong>g longshore <strong>transport</strong> depends upon both the <strong>in</strong>dividual components and the effect <strong>of</strong> this<br />
<strong>in</strong>teraction. It is expected that if both were considered a greater level <strong>of</strong> cont<strong>in</strong>uity <strong>in</strong> the<br />
<strong>transport</strong> rates between the sites may have been obta<strong>in</strong>ed.<br />
<strong>The</strong> value <strong>of</strong> the numerical modell<strong>in</strong>g is also reduced as a result <strong>of</strong> the major contributions made<br />
by aeolian <strong>transport</strong> and locally significant cross-shore <strong>transport</strong>s with<strong>in</strong> the <strong>Sound</strong>. While<br />
discont<strong>in</strong>uities <strong>in</strong> the predicted longshore <strong>transport</strong> volumes can be used to <strong>in</strong>fer other fluxes,<br />
both sources and s<strong>in</strong>ks, it becomes difficult to estimate the relative importance <strong>of</strong> these when<br />
they make up a significant portion <strong>of</strong> the total <strong>transport</strong>. This is also limited by the confidence <strong>in</strong><br />
the output. Furthermore, to make these conclusions other methods must be used to identify the<br />
other possible fluxes.<br />
<strong>The</strong>refore, due to the uncerta<strong>in</strong>ty associated with it, the importance <strong>of</strong> other <strong>transport</strong> processes<br />
and <strong>in</strong>ter-annual variation, numerical modell<strong>in</strong>g us<strong>in</strong>g the CERC method consider<strong>in</strong>g only w<strong>in</strong>d<br />
wave driven longshore <strong>transport</strong> is <strong>of</strong> limited use. However, when comb<strong>in</strong>ed with the qualitative<br />
aspect <strong>of</strong> this study, a conceptual overview <strong>of</strong> sediment dynamics can be attempted.
5. Results and Discussion 61<br />
5.3 Net sediment <strong>transport</strong> pathways<br />
Based upon the qualitative observations and numerically estimated <strong>transport</strong> volumes previously<br />
discussed, an account <strong>of</strong> the major sediment <strong>transport</strong> pathways both <strong>in</strong>to and with<strong>in</strong> the <strong>Sound</strong><br />
was developed. S<strong>in</strong>ce the weather events which drive a part <strong>of</strong> the sediment <strong>transport</strong> <strong>in</strong>to and<br />
with<strong>in</strong> the <strong>Sound</strong> have an episodic nature, the sediment <strong>transport</strong> will not be constant. It too will<br />
have an episodic nature and will be strongly dependant upon the weather patterns. While there<br />
are many <strong>in</strong>stances where the <strong>transport</strong> direction will change seasonally, the <strong>transport</strong> pathways<br />
discussed <strong>in</strong> this study are longer term net pathways and generally do not take the seasonal<br />
variation <strong>in</strong>to account.<br />
5.3.1 Transport <strong>in</strong>to the <strong>Sound</strong><br />
<strong>The</strong>re is much disagreement on the major sources <strong>of</strong> sediment <strong>in</strong>put to the <strong>Sound</strong>, particularly to<br />
whether sand <strong>transport</strong>ed from the Sepia Depression directly through open<strong>in</strong>gs <strong>in</strong> the Garden<br />
Island Ridge can be a significant source. It is accepted that a significant supply <strong>of</strong> sediment is<br />
<strong>transport</strong>ed northwards around Becher Po<strong>in</strong>t from Comet bay. This route was described by<br />
Searle and Logan (1979) who estimated a net northward <strong>transport</strong> <strong>of</strong> 60,000m 3 .yr -1 for Madora<br />
Bay, while a portion <strong>of</strong> this will be lost to the parabolic dunes to the south <strong>of</strong> Becher Po<strong>in</strong>t a<br />
considerable proportion will enter the <strong>Sound</strong> (Searle & Logan, 1979). Also, the <strong>in</strong>cremental<br />
pattern <strong>of</strong> the proposed formation <strong>of</strong> the <strong>Sound</strong> over the Holocene <strong>in</strong>dicates that over the <strong>Sound</strong>’s<br />
history the major sediment source has been from the south (Searle et al., 1988).<br />
<strong>The</strong> major question which rema<strong>in</strong>s is whether sand from the Sepia Depression can be a<br />
significant source to the <strong>Sound</strong>. An exam<strong>in</strong>ation <strong>of</strong> hydrographic charts from 1985 shows a very<br />
steep, almost vertical, seaward slope <strong>of</strong> the reef. <strong>The</strong>re is also a large variation between the<br />
depths seaward and landward <strong>of</strong> the reef. Depths <strong>in</strong> the northern section <strong>of</strong> the <strong>Sound</strong> seaward <strong>of</strong><br />
the reef are approximately 10 m while on the landward side they are around 3 m. In the southern<br />
section seaward depths are around 5 m while landward depths are around 2.5 m (Silvester,<br />
1987). This depth variation is due to accumulation with<strong>in</strong> the <strong>Sound</strong> that has occurred due to the<br />
shelter<strong>in</strong>g effect <strong>of</strong> the reef and the creation <strong>of</strong> wave convergence zones where sediment is<br />
deposited.<br />
While a large northward longshore <strong>transport</strong> exists on the seaward side <strong>of</strong> the reef due to the<br />
oblique reflection <strong>of</strong> the prevail<strong>in</strong>g SW swell by the almost vertical reef ‘wall’, Silvester (1987)
5. Results and Discussion 62<br />
proposed that it is unlikely that much <strong>of</strong> this will pass through the gaps <strong>in</strong>to the <strong>Sound</strong> as waves<br />
can not <strong>transport</strong> sand over vertical faces <strong>of</strong> the order <strong>of</strong> a few meters. S<strong>in</strong>ce further breakages <strong>in</strong><br />
the reef are likely to occur at some height above the sea floor this barrier to sediment <strong>transport</strong><br />
will be ma<strong>in</strong>ta<strong>in</strong>ed (Silvester, 1987).<br />
Aerial photographs (DOLA, 2004; Figure 5.2) show clear sand deposits which extend through<br />
the reef and strongly suggest that sand from the Sepia Depression can be a source to the <strong>Sound</strong>.<br />
In light <strong>of</strong> the height which the sand would have to rise, the mechanics <strong>of</strong> this <strong>transport</strong> are<br />
difficult to envisage. Accord<strong>in</strong>gly, this has been the major argument aga<strong>in</strong>st sand be<strong>in</strong>g<br />
<strong>transport</strong>ed from the Sepia Depression <strong>in</strong>to the <strong>Sound</strong>.<br />
One possible explanation is that the sand is suspended by storm wave <strong>in</strong>duced turbulence which<br />
may be able to raise the sediment to a height such that it could enter the open<strong>in</strong>gs, be<strong>in</strong>g<br />
deposit<strong>in</strong>g with<strong>in</strong> the reef. This sand could then be moved <strong>in</strong>to the <strong>Sound</strong> under the <strong>in</strong>fluence <strong>of</strong><br />
the prevail<strong>in</strong>g SW swell. This is supported by the sand deposits <strong>in</strong> question be<strong>in</strong>g orientated <strong>in</strong> a<br />
generally SW – NW direction. This poses the question ‘can wave <strong>in</strong>duced turbulence <strong>transport</strong><br />
sediment up heights <strong>of</strong> the order a few metres’.<br />
Another possible explanation is related to the possible existence <strong>of</strong> large sand waves with<strong>in</strong> the<br />
Sepia Depression. Due to the abundant sediment supply and restricted currents with<strong>in</strong> the Sepia<br />
Depression, large sand waves are believed to exist and migrate along the depression.<br />
Bathymetric surveys <strong>of</strong> the Sepia Depression suggest the possible existence <strong>of</strong> such waves<br />
(Figure 2.2, p17). It is possible that these sand waves extend up high enough to reach the<br />
open<strong>in</strong>gs <strong>in</strong> the Garden Island Ridge, allow<strong>in</strong>g sediment <strong>transport</strong> <strong>in</strong>to the <strong>Sound</strong> or allow<strong>in</strong>g<br />
<strong>transport</strong> by reduc<strong>in</strong>g the height that sand would need to rise to enter the open<strong>in</strong>gs. A sediment<br />
supply <strong>of</strong> this form will be pulsational with <strong>in</strong>puts correspond<strong>in</strong>g to the pass<strong>in</strong>g <strong>of</strong> the sand wave<br />
‘peaks’ past the open<strong>in</strong>gs <strong>in</strong> the reef.<br />
S<strong>in</strong>ce there are no significant <strong>transport</strong> pathways out <strong>of</strong> the <strong>Sound</strong>, once sediment enters it is<br />
effectively trapped and rema<strong>in</strong>s with<strong>in</strong> the system, until lost to the dunes.<br />
5.3.2 Transport with<strong>in</strong> the <strong>Sound</strong><br />
A conceptual model <strong>of</strong> net sediment <strong>transport</strong> pathways with<strong>in</strong> the <strong>Sound</strong> (Figure 5.12) was<br />
established from the comb<strong>in</strong>ation <strong>of</strong> all the methods previously discussed.
5. Results and Discussion 63<br />
A northward longshore <strong>transport</strong> is expected to exist around Becher Po<strong>in</strong>t as a cont<strong>in</strong>uation <strong>of</strong><br />
the northward net longshore <strong>transport</strong> which exists <strong>in</strong> Comet Bay (Figure 5.12, A). Another<br />
likely sediment source to this area is sand <strong>transport</strong>ed onshore along the sand shoal due to swell<br />
convergence along its crest (Figure 5.12, B).<br />
Figure 5.12: Conceptual model <strong>of</strong> net sediment <strong>transport</strong>
5. Results and Discussion 64<br />
A w<strong>in</strong>d wave driven northward longshore <strong>transport</strong> has been shown to exist on <strong>Warnbro</strong> Beach<br />
<strong>in</strong> the central section <strong>of</strong> the <strong>Sound</strong>, illustrated by the numerically estimated longshore <strong>transport</strong><br />
and supported by the accumulation <strong>of</strong> sediment on the southern side <strong>of</strong> the previously mentioned<br />
shore normal groyne (Figure 5.12, C). This longshore <strong>transport</strong> can not cont<strong>in</strong>ue northward to<br />
Safety Bay due to negligible accumulation or movement on the eastern side <strong>of</strong> Tern Island s<strong>in</strong>ce<br />
it jo<strong>in</strong>ed the shorel<strong>in</strong>e. This is also <strong>in</strong>dicated by the numerical modell<strong>in</strong>g results which show a<br />
large amount <strong>of</strong> sediment ‘lost’ from the <strong>transport</strong> path <strong>in</strong> the northern section <strong>of</strong> <strong>Warnbro</strong><br />
Beach. It is believed that this s<strong>in</strong>k is accounted for by the large parabolic dunes and blowouts <strong>in</strong><br />
the central and southern sections <strong>of</strong> the <strong>Sound</strong>. It is likely that a large portion <strong>of</strong> the sand<br />
<strong>transport</strong>ed by longshore processes northward from the Becher – Bridport Po<strong>in</strong>t area is<br />
ultimately <strong>transport</strong>ed through aeolian processes <strong>in</strong>to the dunes.<br />
Onshore sediment <strong>transport</strong> is expected to occur along the Tern Island sand bar and the adjo<strong>in</strong><strong>in</strong>g<br />
sand shoal due to the convergence <strong>of</strong> swell over the shoal (Figure 5.12, D). This follows from<br />
the f<strong>in</strong>d<strong>in</strong>gs <strong>of</strong> Caston (1981) who suggested that the planform <strong>of</strong> a sand bar may be used to<br />
estimate the direction <strong>of</strong> net sediment movement. Upon reach<strong>in</strong>g the sand bar this <strong>transport</strong> is<br />
expected to progress down the western flank <strong>of</strong> the bar (Figure 5.12, E). This is due to the<br />
existence and growth <strong>of</strong> a large submerged platform s<strong>in</strong>ce the sand bar neared the shore. Over<br />
the same period there has been negligible sediment accumulation or change on the bar’s eastern<br />
flank.<br />
Observations <strong>of</strong> the Pengu<strong>in</strong> Island Tombolo have shown it to be consistently hooked to the<br />
south. This may <strong>in</strong>dicate that there is a south – eastward <strong>transport</strong> around Mersey Po<strong>in</strong>t (Figure<br />
5.12, F). This argument may also be supported by the accumulation <strong>of</strong> sand aga<strong>in</strong>st the western<br />
side <strong>of</strong> the Tern Island sand bar s<strong>in</strong>ce it jo<strong>in</strong>ed the shore, possibly <strong>in</strong>terrupt<strong>in</strong>g an eastward<br />
littoral drift. Another explanation for the source for this accumulation is sand <strong>transport</strong>ed<br />
shoreward along the western flank <strong>of</strong> the sand bar.<br />
If a significant amount <strong>of</strong> sand can not be <strong>transport</strong>ed from through the Garden Island ridge an<br />
explanation is required <strong>of</strong> where the sand mak<strong>in</strong>g up the accumulations on the north sands<br />
platform orig<strong>in</strong>ated from. One possibility is that sand is redistributed with<strong>in</strong> the <strong>Sound</strong> and may<br />
be <strong>transport</strong>ed from the south sands platform under extreme conditions, either SW storm or sea<br />
breeze (Figure 5.12, G).
5. Results and Discussion 65<br />
It is also believed that sediment redistribution due to longshore <strong>transport</strong> driven by diffracted<br />
swell waves is an important factor <strong>in</strong> sediment movement with<strong>in</strong> the <strong>Sound</strong> and is responsible<br />
form ma<strong>in</strong>ta<strong>in</strong><strong>in</strong>g the shape <strong>of</strong> the <strong>Sound</strong>, particularly the central section.
5. Results and Discussion 66<br />
5.4 Tern Island sand bar<br />
S<strong>in</strong>ce the first available aerial photographs from 1942, the Tern Island sand bar has gone from<br />
be<strong>in</strong>g entirely submerged to emergent and has grown and migrated shoreward at an average rate<br />
<strong>of</strong> 10 - 15 m.yr -1 . <strong>The</strong> photographic time history <strong>of</strong> the development and movement <strong>of</strong> the sand<br />
bar is shown <strong>in</strong> Appendix B. In the first available photograph from 1942 the submerged form <strong>of</strong><br />
the sand bar can be observed approximately 700 m from the shorel<strong>in</strong>e (Figure 5.13). <strong>The</strong> most<br />
recent aerial photograph taken <strong>in</strong> April 2004 shows the sandbar connected to the shore with a<br />
well def<strong>in</strong>ed sand shoal extend<strong>in</strong>g from the Garden Island Ridge to the tail <strong>of</strong> the bar (Figure<br />
5.14).<br />
Figure 5.13: Safety Bay 1942<br />
Figure 5.14: Safety Bay 2004
5. Results and Discussion 67<br />
5.4.1 Formation, Migration & Ma<strong>in</strong>tenance<br />
As discussed earlier, it is believed that the formation <strong>of</strong> the Tern Island sand bar was due to the<br />
existence <strong>of</strong> a low energy zone created by the diffraction <strong>of</strong> prevail<strong>in</strong>g swell waves pass<strong>in</strong>g<br />
through open<strong>in</strong>gs <strong>in</strong> the Garden Island Ridge. <strong>The</strong> results <strong>of</strong> the REF/DIF1 simulation for the<br />
mean prevail<strong>in</strong>g swell conditions, presented <strong>in</strong> Figure 5.15, show an area <strong>of</strong> low wave heights,<br />
analogous to low energy, <strong>in</strong> the region where the <strong>in</strong>itial formation <strong>of</strong> the sand bar occurred. This<br />
f<strong>in</strong>d<strong>in</strong>g supports the formation hypothesis proposed by Pitchen (1993).<br />
Aerial photographs <strong>of</strong> this region also support this argument. An accumulation <strong>of</strong> bare sands can<br />
be seen on the shoreward side <strong>of</strong> the Garden Island Ridge with a sand shoal extend<strong>in</strong>g from this<br />
area to the sand bar along the path followed by the sand bar dur<strong>in</strong>g its shoreward migration<br />
(Figure 5.14).<br />
Figure 5.15: REF/DIF1 Output for prevail<strong>in</strong>g swell<br />
Once the accumulation <strong>of</strong> sand became large enough it is likely that the ma<strong>in</strong>tenance and<br />
shoreward movement <strong>of</strong> the bar was governed by the <strong>in</strong>teraction <strong>of</strong> the prevail<strong>in</strong>g swell with the
5. Results and Discussion 68<br />
bar accord<strong>in</strong>g to the process described by Carter (1988) (see 3.1, p30). Waves refracted around<br />
the bar <strong>transport</strong> sediment from the tail to the head form<strong>in</strong>g and ma<strong>in</strong>ta<strong>in</strong><strong>in</strong>g the bar’s l<strong>in</strong>ear<br />
shape and mov<strong>in</strong>g it <strong>in</strong> the direction <strong>of</strong> the prevail<strong>in</strong>g swell.<br />
Dur<strong>in</strong>g the shoreward migration <strong>of</strong> the bar its alignment changed both <strong>in</strong> the shorter term and<br />
longer term. It is likely that the long term change from a SW – NE to S – N alignment has been<br />
due to the refraction <strong>of</strong> swell waves by the north sands platform. Initially hav<strong>in</strong>g a SW direction<br />
upon enter<strong>in</strong>g the <strong>Sound</strong> the prevail<strong>in</strong>g swell wave direction changes to an almost S direction<br />
upon reach<strong>in</strong>g the shorel<strong>in</strong>e. This is <strong>in</strong>dicated by the roughly W – E orientation <strong>of</strong> the Safety<br />
Bay shorel<strong>in</strong>e, before Tern Island became a significant presence. As the bar moved shoreward it<br />
too followed this path, due to the likely migration mechanism <strong>of</strong> the bar (see 3.1, p30).<br />
In the shorter term the alignment <strong>of</strong> the bar as well as its shape has also changed. As Pitchen<br />
(1993) noted, these changes are due to the effect <strong>of</strong> storms. <strong>The</strong> direction <strong>of</strong> the storm is<br />
particularly important as it will determ<strong>in</strong>e its effect on the sand bar. SW storm waves are<br />
unlikely to affect the shape or alignment <strong>of</strong> the sand bar as they have the same direction as the<br />
swell and will act similarly <strong>in</strong> ma<strong>in</strong>ta<strong>in</strong><strong>in</strong>g the bar. Conversely, NW storm waves will affect the<br />
shape and alignment <strong>of</strong> the bar as they provide wave energy from a direction different to that<br />
which ma<strong>in</strong>ta<strong>in</strong>s the bar. <strong>The</strong> observed S-shape <strong>of</strong> the bar is likely to be a result <strong>of</strong> a sequence <strong>of</strong><br />
NW then SW wave energy. NW waves are expected to deflect the head <strong>of</strong> the bar towards the<br />
SE, creat<strong>in</strong>g a crescentic shape. Dur<strong>in</strong>g the follow<strong>in</strong>g period <strong>of</strong> SW wave energy the usual<br />
ma<strong>in</strong>tenance is expected to resume with the head be<strong>in</strong>g deflected back towards the NE, caus<strong>in</strong>g<br />
the S-shape.<br />
<strong>The</strong> sand supply for the formation <strong>of</strong> Tern Island is likely to be from the redistribution <strong>of</strong> sands<br />
with<strong>in</strong> the <strong>Sound</strong>, orig<strong>in</strong>ally <strong>transport</strong>ed <strong>in</strong>to the <strong>Sound</strong> from the south. However, there still<br />
rema<strong>in</strong>s the possibility that it has entered the <strong>Sound</strong> through open<strong>in</strong>gs <strong>in</strong> the Garden Island Ridge<br />
from the Sepia Depression.<br />
<strong>The</strong>re are large volumes <strong>of</strong> bare sands with<strong>in</strong> the <strong>Sound</strong> however there is no clear <strong>transport</strong><br />
mechanism by which these sands could get to the zone <strong>of</strong> the Tern Island source. <strong>The</strong> first <strong>of</strong> the<br />
two most likely scenarios is sand <strong>transport</strong>ed northward from Comet Bay proceeds over the<br />
south sands, and under sea breeze and SW storm conditions is <strong>transport</strong>ed <strong>in</strong>to the area <strong>of</strong><br />
sandbar formation where it is deposited <strong>in</strong> the low energy zone. <strong>The</strong> other possibility be<strong>in</strong>g NW<br />
storm waves, diffracted upon pass<strong>in</strong>g through the Pengu<strong>in</strong> Island – Mersey Po<strong>in</strong>t Gap entra<strong>in</strong> and<br />
<strong>transport</strong> sand from the north sands platform towards the low energy zone where it accumulates.
5. Results and Discussion 69<br />
<strong>The</strong> later possibility is unlikely to contribute significantly to the total sediment supply due to<br />
simultaneous <strong>in</strong>creases <strong>in</strong> size <strong>of</strong> the sand bar and the tombolo noted by Pitchen (1993).<br />
This theory <strong>of</strong> sand redistribution with<strong>in</strong> the <strong>Sound</strong> is supported by the depth difference between<br />
the seaward and landward sides <strong>of</strong> the reef, the shallower landward side suggests that sand,<br />
redistributed with<strong>in</strong> the <strong>Sound</strong>, has accumulated build<strong>in</strong>g up the sea floor with<strong>in</strong> the <strong>Sound</strong> up to<br />
its present level. Also the lesser depth <strong>of</strong> the south sands platform <strong>in</strong>dicates a greater supply <strong>of</strong><br />
sand from the south, some <strong>of</strong> which is then moved northward with<strong>in</strong> the <strong>Sound</strong>.<br />
Extend<strong>in</strong>g upon the possibility that a major supply to the sand bar occurs through the Garden<br />
Island Ridge, sand <strong>transport</strong>ed through the Garden Island Ridge is likely to be pulsational for<br />
reasons previously discussed. It is possible that these pulses <strong>of</strong> sediment are <strong>transport</strong>ed through<br />
the open<strong>in</strong>g directly to the south <strong>of</strong> the formation zone, moved northward, and deposited <strong>in</strong> the<br />
low energy zone. <strong>The</strong>re is also the likelihood that the <strong>in</strong>itial sand bar form<strong>in</strong>g deposit was a<br />
s<strong>in</strong>gle large pulse <strong>of</strong> sediment <strong>transport</strong>ed through the open<strong>in</strong>g. However, this theory can not be<br />
verified due to the lack <strong>of</strong> pre 1942 aerial photographs.<br />
5.4.2 Future <strong>of</strong> Tern Island<br />
5.4.2.1 Accretion on the western flank<br />
Sand <strong>transport</strong> along the bar from <strong>of</strong>fshore appears to be predom<strong>in</strong>ately along its western flank.<br />
This, <strong>in</strong> comb<strong>in</strong>ation with the previously mentioned possible net eastward longshore <strong>transport</strong><br />
between Mersey Po<strong>in</strong>t and the east <strong>of</strong> the bar, is likely to result <strong>in</strong> the cont<strong>in</strong>ued accretion <strong>of</strong> the<br />
shorel<strong>in</strong>e directly to the bar’s west until the shorel<strong>in</strong>e reaches an equilibrium state.<br />
5.4.2.2 Spit formation<br />
It is possible that the effect <strong>of</strong> NW storm waves will result <strong>in</strong> the formation <strong>of</strong> a l<strong>in</strong>ear (or<br />
recurved) spit extend<strong>in</strong>g eastward from the tail end <strong>of</strong> the sand bar (spit formation process<br />
described <strong>in</strong> 3.3, p34). Storm waves pass<strong>in</strong>g through the Pengu<strong>in</strong> Island – Mersey Po<strong>in</strong>t gap will<br />
cause a strong eastward longshore <strong>transport</strong>, possibly break<strong>in</strong>g through the sand bar. If this<br />
occurred a large amount <strong>of</strong> sand could be <strong>transport</strong>ed through the break and deposited on the<br />
eastern side. Follow<strong>in</strong>g this, it is possible that the prevail<strong>in</strong>g SW swell will act to curve the end<br />
<strong>of</strong> the spit to the north (shoreward).
5. Results and Discussion 70<br />
Field observations <strong>of</strong> the bar (11-09-04) at low tide follow<strong>in</strong>g a NW storm event showed a<br />
channel cut through the bar just seaward <strong>of</strong> the emergent tail. This <strong>in</strong> comb<strong>in</strong>ation with the<br />
observed eastward deflection <strong>of</strong> the bar’s tail between 2000 and 2004 suggest that the formation<br />
<strong>of</strong> a l<strong>in</strong>ear spit extend<strong>in</strong>g eastward may be occurr<strong>in</strong>g, the growth <strong>of</strong> which would be largely<br />
controlled by the frequency, strength and duration <strong>of</strong> NW storms.<br />
If this spit were to develop it will result <strong>in</strong> a situation similar to that <strong>of</strong> Peel Harbour. With<br />
cont<strong>in</strong>ued progradation the spit would eventually reach the shorel<strong>in</strong>e. Based upon the records <strong>of</strong><br />
the development <strong>of</strong> the spit enclos<strong>in</strong>g Peel Harbour the timescale <strong>of</strong> this process is estimated to<br />
be between 30 and 40 years but is highly reliant upon the weather conditions, particularly storm<br />
frequency and direction. <strong>The</strong> formation <strong>of</strong> such as spit has implications to shorel<strong>in</strong>e change <strong>in</strong><br />
the area.<br />
5.4.2.3 Destruction <strong>of</strong> the bar<br />
In the event <strong>of</strong> a prolonged period <strong>of</strong> <strong>in</strong>creased NW storm activity large volumes <strong>of</strong> sand could<br />
be <strong>transport</strong>ed southward from Safety Bay due to the effect <strong>of</strong> storm waves pass<strong>in</strong>g through the<br />
Pengu<strong>in</strong> Island tombolo, possibly result<strong>in</strong>g <strong>in</strong> the destruction <strong>of</strong> the bar. It is likely that this is<br />
the reason beh<strong>in</strong>d the disappearance <strong>of</strong> the Peel Harbour spit between 1859 and 1878 however<br />
this can not be verified due to the unavailability <strong>of</strong> storm records over this period.<br />
S<strong>in</strong>ce this series <strong>of</strong> events has occurred previously <strong>in</strong> the areas recent history it is a probable<br />
future scenario <strong>in</strong> accordance with the cyclic pattern, suggested by Pitchen (1993). It is likely<br />
that this cyclic pattern is driven by patterns <strong>of</strong> storm<strong>in</strong>ess. This is suggested by the different<br />
stages <strong>in</strong> the development be<strong>in</strong>g driven by differ<strong>in</strong>g ratios <strong>of</strong> NW to SW storm energy. Sandbar<br />
formation and migration appears to require a greater level <strong>of</strong> SW wave energy while spit<br />
formation and the eventual destruction <strong>of</strong> the bar appear to be driven by a greater level <strong>of</strong> NW<br />
wave energy.
5. Results and Discussion 71<br />
5.5 Future shorel<strong>in</strong>e change<br />
5.5.1 Predicted future shorel<strong>in</strong>e changes<br />
Predicted future shorel<strong>in</strong>e changes were established based upon past changes which have been<br />
observed, the proposed sediment <strong>transport</strong> pathways and the results <strong>of</strong> apply<strong>in</strong>g the parabolic bay<br />
shape to the Safety Bay area.<br />
5.5.1.1 Parabolic bay shape<br />
<strong>The</strong> parabolic bay shape equation was applied to the shorel<strong>in</strong>es <strong>in</strong> the vic<strong>in</strong>ity <strong>of</strong> the Tern Island<br />
sand bar <strong>in</strong> an attempt to predict future shorel<strong>in</strong>e change due to the effect <strong>of</strong> the sand bar. This<br />
was done by evaluat<strong>in</strong>g the equilibrium shorel<strong>in</strong>e position.<br />
It is difficult to def<strong>in</strong>e the position <strong>of</strong> the up coast control po<strong>in</strong>t for the western side <strong>of</strong> the bar<br />
s<strong>in</strong>ce there is no def<strong>in</strong>ite cut-<strong>of</strong>f; rather there is a long gradual slope. It is likely that the control<br />
po<strong>in</strong>t will be def<strong>in</strong>ed by a certa<strong>in</strong> depth at which waves will break, prevent<strong>in</strong>g the pass<strong>in</strong>g <strong>of</strong> the<br />
bulk <strong>of</strong> wave energy. Such a position will change with variations <strong>in</strong> the wave height, water depth<br />
level with the migration <strong>of</strong> the bar.<br />
S<strong>in</strong>ce the actual control po<strong>in</strong>t will vary and it cannot be confidently def<strong>in</strong>ed, a number <strong>of</strong> control<br />
po<strong>in</strong>ts were used at vary<strong>in</strong>g depths (lengths along the bar) to demonstrate that the shape <strong>of</strong> the<br />
shorel<strong>in</strong>e ‘fits’ to the equilibrium parabolic bay shape as well as to show the effect that chang<strong>in</strong>g<br />
the control po<strong>in</strong>t has on the predicted equilibrium shorel<strong>in</strong>e shape. (In the figures the up-coast<br />
control po<strong>in</strong>t is <strong>in</strong>dicated by the red po<strong>in</strong>t)<br />
Figure 5.16: Predicted equilibrium bay shape <strong>of</strong> the western side <strong>of</strong> Tern Island (1)
5. Results and Discussion 72<br />
Figure 5.17: Predicted equilibrium bay shape <strong>of</strong> the western side <strong>of</strong> Tern Island (2)<br />
Figure 5.18: Predicted equilibrium bay shape <strong>of</strong> the western side <strong>of</strong> Tern Island (3)<br />
From Figure 5.16 it is clear that the shape <strong>of</strong> the western shorel<strong>in</strong>e closely fits the equilibrium<br />
parabolic bay shape. However due to the difficulties <strong>in</strong> def<strong>in</strong><strong>in</strong>g the exact up-coast control po<strong>in</strong>t<br />
the shorel<strong>in</strong>e change can not be accurately estimated. Figure 5.17 and Figure 5.18 show the<br />
effect <strong>of</strong> chang<strong>in</strong>g the control po<strong>in</strong>t to a greater depth (as is likely to occur with larger waves or<br />
lower water levels). If either <strong>of</strong> these po<strong>in</strong>ts act as the up-coast control po<strong>in</strong>t they <strong>in</strong>dicate that<br />
shorel<strong>in</strong>e advance will occur, as opposed to the static shorel<strong>in</strong>e suggested by Figure 5.16.<br />
On the eastern side <strong>of</strong> the bar due to the steep depth gradient the up coast control po<strong>in</strong>t could be<br />
accurately estimated.
5. Results and Discussion 73<br />
Figure 5.19: Predicted equilibrium bay shape <strong>of</strong> the eastern side <strong>of</strong> Tern Island<br />
<strong>The</strong> shape <strong>of</strong> the shorel<strong>in</strong>e represents that <strong>of</strong> the equilibrium parabolic bay shape but does not<br />
follow the shorel<strong>in</strong>e; this is likely to be due to the shelter<strong>in</strong>g given to the area by the two sand<br />
bars, not allow<strong>in</strong>g enough swell energy to reach the shorel<strong>in</strong>e to rework it <strong>in</strong>to equilibrium bay<br />
shape. It is likely that the shorel<strong>in</strong>e will slowly prograde to reach the equilibrium state.<br />
5.5.1.2 Future shorel<strong>in</strong>e change<br />
Changes to Becher Po<strong>in</strong>t are reliant upon changes to the wave energy balance from the north and<br />
south which will change with altered patterns <strong>of</strong> storm<strong>in</strong>ess and breakdown <strong>of</strong> the reef.<br />
<strong>The</strong>refore it is not possible to predict future shorel<strong>in</strong>e changes without predict<strong>in</strong>g these<br />
controll<strong>in</strong>g factors.<br />
<strong>Warnbro</strong> Beach <strong>in</strong> the centre <strong>of</strong> the <strong>Sound</strong> has rema<strong>in</strong>ed static for a long period <strong>of</strong> time. This is<br />
<strong>in</strong>dicated by the well developed nature <strong>of</strong> the s<strong>in</strong>gle foredune. It is likely that it will not<br />
experience significant change <strong>in</strong> the foreseeable future.<br />
Changes to the Safety Bay region will be dom<strong>in</strong>ated by the Tern Island sand bar. Based upon the<br />
established sediment <strong>transport</strong> paths and the results <strong>of</strong> apply<strong>in</strong>g the parabolic bay shape there is<br />
likely to be cont<strong>in</strong>ued accretion and shorel<strong>in</strong>e advance to the west <strong>of</strong> the sand bar while there<br />
will be little change to the shorel<strong>in</strong>e east <strong>of</strong> the bar. However the possible growth <strong>of</strong> a spit from<br />
the sand bar, which is expected to eventually jo<strong>in</strong> the shore, will result <strong>in</strong> <strong>of</strong>fshore accretion,<br />
reduc<strong>in</strong>g water depths <strong>in</strong> its vic<strong>in</strong>ity, effectively form<strong>in</strong>g an <strong>of</strong>fshore barrier to the east <strong>of</strong> the bar.<br />
Anthropogenic changes made to the coast, should also be considered, namely the <strong>in</strong>fluence<br />
stabilis<strong>in</strong>g the parabolic dunes around <strong>Warnbro</strong> Beach for hous<strong>in</strong>g developments will have on<br />
the Safety Bay sediment budget. <strong>The</strong>se dunes are likely to provide a major sediment s<strong>in</strong>k for the
5. Results and Discussion 74<br />
beach system, consum<strong>in</strong>g the entire northward longshore sediment <strong>transport</strong>. <strong>The</strong>refore it is<br />
possible that by stabilis<strong>in</strong>g them they will no longer act as a sediment s<strong>in</strong>k. It is probable that,<br />
without this s<strong>in</strong>k, sediment would cont<strong>in</strong>ue north to Safety Bay, <strong>in</strong>creas<strong>in</strong>g the sediment supply<br />
and further exacerbat<strong>in</strong>g the accretion problems <strong>of</strong> the area.<br />
5.5.2 Effect <strong>of</strong> predicted changes on exist<strong>in</strong>g coastal <strong>in</strong>frastructure<br />
Currently all coastal <strong>in</strong>frastructure (boat ramps, jetties, etc) <strong>in</strong> <strong>Warnbro</strong> <strong>Sound</strong> is concentrated <strong>in</strong><br />
the Safety Bay region. This has been and cont<strong>in</strong>ues to be one <strong>of</strong> the most dynamic areas <strong>of</strong> the<br />
<strong>Sound</strong> with respect to coastl<strong>in</strong>e moment. <strong>The</strong> locations <strong>of</strong> this <strong>in</strong>frastructure are shown <strong>in</strong> Figure<br />
5.20.<br />
Figure 5.20: Current Safety Bay <strong>in</strong>frastructure<br />
<strong>The</strong> effects <strong>of</strong> the coastl<strong>in</strong>e change caused by the Tern Island sand bar have already resulted <strong>in</strong><br />
the Waimea Street Boat ramp (Figure 5.21) and the SBYC jetty (Figure 5.22) becom<strong>in</strong>g unusable<br />
due to sedimentation. <strong>The</strong> jetty now does not reach the shorel<strong>in</strong>e while the Waimea Street Boat<br />
ramp has been out <strong>of</strong> use for several years and is currently situated a few hundred meters from<br />
the shorel<strong>in</strong>e.
5. Results and Discussion 75<br />
Figure 5.21: Waimea Street Boat Ramp<br />
Figure 5.22: Safety Bay Yacht Club Jetty<br />
If the current pattern cont<strong>in</strong>ues it is likely that sediment accumulation on the western side <strong>of</strong> the<br />
sand bank will result <strong>in</strong> the Carlisle Street boat also becom<strong>in</strong>g unusable <strong>in</strong> the foreseeable future.<br />
<strong>The</strong> Bent Street boat ramp may become cut <strong>of</strong> from the <strong>Sound</strong> by the develop<strong>in</strong>g sand spit, once<br />
this reaches the Berry Street sand bar depths will be too small for boats to get out <strong>in</strong>to the <strong>Sound</strong>.<br />
Of all the exist<strong>in</strong>g ramps <strong>in</strong> the area it is apparent that the June Road boat ramp has the most<br />
favourable future outlook. It is located on the northern most region <strong>of</strong> <strong>Warnbro</strong> Beach adjacent<br />
to the central bas<strong>in</strong>. <strong>The</strong> coastl<strong>in</strong>e <strong>of</strong> this area has rema<strong>in</strong>ed static and is not expected to change<br />
considerably <strong>in</strong> the foreseeable future.
6. Conclusions 76<br />
6 CONCLUSIONS<br />
Significant shorel<strong>in</strong>e change has occurred <strong>in</strong> the Becher Po<strong>in</strong>t, Safety Bay and Mersey Po<strong>in</strong>t<br />
regions. Conversely, the <strong>Warnbro</strong> Beach shorel<strong>in</strong>e has rema<strong>in</strong>ed static. It is believed that<br />
changes to the shorel<strong>in</strong>es <strong>in</strong> the vic<strong>in</strong>ity <strong>of</strong> Becher and Mersey Po<strong>in</strong>ts have been caused by<br />
changes to the <strong>in</strong>cident wave energy, due to reef collapse or variations <strong>in</strong> long term weather<br />
patterns. Shorel<strong>in</strong>e advance <strong>in</strong> the Safety Bay region has been due to the presence <strong>of</strong> the Tern<br />
Island sand bar which has affected both the wave energy reach<strong>in</strong>g the shorel<strong>in</strong>e and the sediment<br />
supply to the region.<br />
It was determ<strong>in</strong>ed that the large scale sediment dynamics <strong>of</strong> the <strong>Sound</strong> are the result <strong>of</strong> a<br />
comb<strong>in</strong>ation <strong>of</strong> <strong>transport</strong> processes and can not simply be considered <strong>in</strong> terms <strong>of</strong> w<strong>in</strong>d wave<br />
driven longshore <strong>transport</strong>. <strong>The</strong> contributions <strong>of</strong> cross shore <strong>transport</strong>s along the shoals <strong>in</strong> the<br />
north and south sand platforms as well as aeolian <strong>transport</strong> <strong>in</strong>to the dunes <strong>in</strong> the central section <strong>of</strong><br />
the <strong>Sound</strong> are both believed to be important <strong>in</strong> the identification <strong>of</strong> the sediment sources and<br />
s<strong>in</strong>ks <strong>of</strong> the beach system. <strong>The</strong> effect <strong>of</strong> diffracted swell <strong>in</strong> caus<strong>in</strong>g an alongshore redistribution<br />
<strong>of</strong> sediment may also be important and is likely to be one <strong>of</strong> the reasons why the shorel<strong>in</strong>e <strong>of</strong><br />
<strong>Warnbro</strong> Beach has rema<strong>in</strong>ed static.<br />
It was concluded that the ma<strong>in</strong> source <strong>of</strong> sediment to the Safety Bay region is the Tern Island<br />
sand bar and sand <strong>transport</strong>ed shoreward along its length. Northward longshore <strong>transport</strong> from<br />
<strong>Warnbro</strong> Beach is not expected to be a source to the area.<br />
Modell<strong>in</strong>g <strong>of</strong> the sediment <strong>transport</strong> at discrete locations consider<strong>in</strong>g only locally generated w<strong>in</strong>d<br />
waves was identified to be <strong>of</strong> limited value <strong>in</strong> <strong>in</strong>vestigat<strong>in</strong>g the large scale sediment dynamics<br />
and coastl<strong>in</strong>e change <strong>of</strong> <strong>Warnbro</strong> <strong>Sound</strong>. This is due to the significant contributions <strong>of</strong> other<br />
<strong>transport</strong> processes as well as limited confidence <strong>in</strong> the modell<strong>in</strong>g result.<br />
A zone <strong>of</strong> low wave energy was identified <strong>in</strong> the region <strong>in</strong> which the Tern Island sand bar<br />
formed, verify<strong>in</strong>g the <strong>in</strong>itial formation mechanism proposed by Pitchen (1993). It was also<br />
concluded that the most likely sediment supply for the sand bar is sand redistributed from with<strong>in</strong><br />
the <strong>Sound</strong>, with the possibility that the ma<strong>in</strong> source is from seaward <strong>of</strong> the Garden Island Ridge<br />
also acknowledged.<br />
It is expected that shorel<strong>in</strong>e change <strong>in</strong> the Safety Bay region will cont<strong>in</strong>ue. Little shorel<strong>in</strong>e<br />
advance is expected to the east <strong>of</strong> the Tern Island sand bar but shorel<strong>in</strong>e advance is expected to
6. Conclusions 77<br />
cont<strong>in</strong>ue on the western side <strong>of</strong> the sand bar until an equilibrium state is reached. <strong>The</strong>re is a high<br />
possibility <strong>of</strong> the development <strong>of</strong> a spit from the end <strong>of</strong> the sand bar. This would result <strong>in</strong> a<br />
shorel<strong>in</strong>e configuration similar to that <strong>in</strong> 1839 and strongly suggest the possibility <strong>of</strong> a long term<br />
cycle <strong>of</strong> sediment movement with<strong>in</strong> the <strong>Sound</strong>. Future shorel<strong>in</strong>e change <strong>in</strong> the Becher Po<strong>in</strong>t and<br />
Mersey Po<strong>in</strong>t regions is likely to be due to variations <strong>in</strong> the <strong>in</strong>cident wave energy caused by<br />
changes <strong>in</strong> weather pattens or breakdown <strong>of</strong> sections <strong>of</strong> the Garden Island Ridge. It is therefore<br />
not possible to predict the future changes <strong>of</strong> these areas without further <strong>in</strong>vestigation <strong>in</strong>to both<br />
these scenarios.<br />
F<strong>in</strong>ally based upon the fate <strong>of</strong> <strong>in</strong>frastructure <strong>in</strong> Safety Bay, particularly the Waimea street boat<br />
ramp and the Safety Bay Yacht Club Jetty, it is clear that where possible, future coastal<br />
<strong>in</strong>frastructure should be built <strong>in</strong> the areas identified to have little likelihood <strong>of</strong> change rather than<br />
<strong>in</strong> the most dynamic regions.
7. Recommendations 78<br />
7 RECOMMENDATIONS<br />
Redesign <strong>of</strong> the longshore <strong>transport</strong> modell<strong>in</strong>g methodology is recommended. This would<br />
<strong>in</strong>clude the consideration <strong>of</strong> waves generated outside the study area and would also obta<strong>in</strong><br />
cont<strong>in</strong>uous data for the entire shorel<strong>in</strong>e such that a cont<strong>in</strong>uous longshore sediment <strong>transport</strong> rate<br />
could be calculated for the entire <strong>Sound</strong>. This would require directional <strong>of</strong>fshore wave data and<br />
high resolution bathymetry for the whole <strong>Sound</strong>, which are not currently available. It would also<br />
require that a different wave model be used s<strong>in</strong>ce SWAN does not account for diffraction, the<br />
effects <strong>of</strong> which would be important. This would give a far greater level <strong>of</strong> confidence <strong>in</strong> the<br />
output and allow a greater level <strong>of</strong> analysis. From this sediment budgets could be calculated.<br />
Upon compar<strong>in</strong>g these to coastl<strong>in</strong>e change estimations could be made <strong>of</strong> the cross shore and<br />
aeolian <strong>transport</strong> volumes.<br />
Transport with<strong>in</strong> the <strong>Sound</strong> could be further <strong>in</strong>vestigated by carry<strong>in</strong>g out a field study us<strong>in</strong>g sand<br />
tracers. This could be used to verify the <strong>transport</strong> directions proposed <strong>in</strong> the current study,<br />
particularly the relationship between longshore and aeolian <strong>transport</strong> on <strong>Warnbro</strong> Beach.<br />
<strong>The</strong>refore, confirm<strong>in</strong>g the importance <strong>of</strong> <strong>transport</strong> <strong>in</strong>to the dunes.<br />
Verification should be made <strong>of</strong> the relationship between long term weather patterns and coastl<strong>in</strong>e<br />
change by correlat<strong>in</strong>g long term storm and synoptic records with historical coastl<strong>in</strong>e changes <strong>in</strong><br />
<strong>Warnbro</strong> <strong>Sound</strong>.<br />
Observation <strong>of</strong> the Sepia Depression should be carried out to <strong>in</strong>vestigate the existence and the<br />
size <strong>of</strong> the proposed sand waves. This would allow further <strong>in</strong>vestigation <strong>of</strong> the suggested ‘sand<br />
wave’ mechanism <strong>of</strong> sediment <strong>transport</strong> <strong>in</strong>to the <strong>Sound</strong>. Also, field observations, us<strong>in</strong>g div<strong>in</strong>g or<br />
underwater camera techniques, <strong>of</strong> the open<strong>in</strong>gs with<strong>in</strong> the Garden Island Ridge to further<br />
<strong>in</strong>vestigate the observed deposits <strong>of</strong> sand which appear to extend through the reef.<br />
An <strong>in</strong>vestigation <strong>of</strong> beach process – response mechanisms should be carried out with<strong>in</strong> the<br />
<strong>Sound</strong>. This could be done by regularly monitor<strong>in</strong>g beaches through survey<strong>in</strong>g or measur<strong>in</strong>g<br />
beach width and correlat<strong>in</strong>g the measured data with synoptic records.
8. References 79<br />
8 REFERENCES<br />
Bird, E. C. F. 1972, Coasts: An <strong>in</strong>troduction to systematic geomorphology, Australian National<br />
<strong>University</strong> Press, Canberra.<br />
Booij, N., Ris, R. C. & Holthuijsen, L. H. 1999, 'A third-generation wave model for coastal<br />
regions, Part 1. Model description and validation', Journal <strong>of</strong> Geophysical Research, vol.<br />
104, no. C4, pp. 7649-7666.<br />
Carrigy, M. A. 1956, 'Organic sedimentation <strong>in</strong> <strong>Warnbro</strong> <strong>Sound</strong>, <strong>Western</strong> Australia', Journal <strong>of</strong><br />
<strong>Sediment</strong>ary Petrology, vol. 26, no. 3, pp. 228-239.<br />
Carter, R. W. G. 1988, Coastal environments : an <strong>in</strong>troduction to the physical, ecological, and<br />
cultural systems <strong>of</strong> coastl<strong>in</strong>es, Academic Press, London, New York.<br />
Caston, G. F. 1981, 'Potential ga<strong>in</strong> and loss <strong>of</strong> sand by some sand banks <strong>in</strong> the Southern Bight <strong>of</strong><br />
the Northern Sea', Mar<strong>in</strong>e Geology, vol. 41, pp. 239-250.<br />
CERC 2002, Shore Protection Manual,, Vicksburg, Mississippi.<br />
DELFT 2004, SWAN User manual: SWAN Cycle III version 40.31, Delft <strong>University</strong> <strong>of</strong><br />
Technology.<br />
DOLA. 2004, Skyview WA, [Onl<strong>in</strong>e], Department <strong>of</strong> Land Adm<strong>in</strong>istration, Available from:<br />
[22/10/04].<br />
Gelfenbaum, G. & Brooks, G. R. 2003, '<strong>The</strong> morphology and migration <strong>of</strong> transverse bars on the<br />
west-central Florida coast', Mar<strong>in</strong>e Geology, vol. 200, pp. 273-289.<br />
Gentilli, J. 1971, Climates <strong>of</strong> Australia and New Zealand. (World Survey <strong>of</strong> Climatology, Volume<br />
13), Elsevier, Amsterdam.
8. References 80<br />
Gentilli, J. 1972, Australian Climate Patterns, Nelson's Australasian Paperbacks.<br />
Hegge, B., Eliot, I. & Hsu, J. 1996, 'Sheltered sand beaches <strong>of</strong> south-western Australia', Journal<br />
<strong>of</strong> Coastal Research, vol. 12, no. 3, pp. 748-760.<br />
Hegge, B. J. 1994, Low - energy sandy beaches <strong>of</strong> south-western Australia: Two - dimensional<br />
morphology, sediment dynamics, PhD <strong>The</strong>sis, <strong>The</strong> <strong>University</strong> <strong>of</strong> <strong>Western</strong> Australia.<br />
Howd, P. A. & Birkemeier, W. A. 1987, Nearshore survey data: 1981 - 1984 CERC Field<br />
Research Facility, TR-87-9, CERC.<br />
Jackson, N. L., Nordstrom, K. F., Eliot, I. & Massel<strong>in</strong>k, G. 2002, ''Low energy' sandy beaches <strong>in</strong><br />
mar<strong>in</strong>e and estuar<strong>in</strong>e environments: a review', Geomorphology, vol. 48, pp. 147-162.<br />
Kirby, J. T. & Dalrymple, R. A. 1994, Comb<strong>in</strong>ed Refraction/Diffraction Model - REF/DIF<br />
version 2.5, Documentation and User's Manual, Centre for Applied Coastal Research.<br />
Kle<strong>in</strong>, A. H. d. F., Vargus, A., Raabe, A. L. A. & Hsu, J. R. C. 2003, 'Visual assessment <strong>of</strong> bayed<br />
beach stability with computer s<strong>of</strong>tware', Computers & geosciences, vol. 29, pp. 1249 -<br />
1257.<br />
Komar, P. D. 1998, Beach processes and sedimentation, 2nd edn, Prentice Hall, Upper Saddle<br />
River, N.J.<br />
Lemm, A. J. 1996, Offshore Wave Climate: Perth, <strong>Western</strong> Australia, Honours <strong>The</strong>sis,<br />
<strong>University</strong> <strong>of</strong> <strong>Western</strong> Australia.<br />
Lemm, A. J., Hegge, B. J. & Massel<strong>in</strong>k, G. 1999, 'Offshore wave climate, Perth (<strong>Western</strong><br />
Australia), 1994-96', Mar<strong>in</strong>e and Freshwater Research, vol. 50, pp. 95-102.<br />
Massel<strong>in</strong>k, G. & Hughes, M. G. 2003, Introduction to coastal processes and geomorphology,<br />
Arnold, London.
8. References 81<br />
Massel<strong>in</strong>k, G. & Pattiaratchi, C. B. 2000, 'Characteristics <strong>of</strong> the sea breeze system <strong>in</strong> Perth,<br />
<strong>Western</strong> Australia, and its effect on the nearshore wave climate', Journal <strong>of</strong> Coastal<br />
Research.<br />
Massel<strong>in</strong>k, G. & Pattiaratchi, C. B. 2001, 'Seasonal changes <strong>in</strong> beach morphology along the<br />
sheltered coastl<strong>in</strong>e <strong>of</strong> Perth, <strong>Western</strong> Australia', Mar<strong>in</strong>e Geology, vol. 172, pp. 243-263.<br />
Pattiaratchi, C. B. & Eliot, I. 1993, Formation and ma<strong>in</strong>tenance <strong>of</strong> shorel<strong>in</strong>e attached sand bars<br />
<strong>in</strong> low energy environments and their relationship to shorel<strong>in</strong>e movements, <strong>University</strong> <strong>of</strong><br />
<strong>Western</strong> Australia.<br />
Pattiaratchi, C. B., Hegge, B., Gould, J. & Eliot, I. 1997, 'Impact <strong>of</strong> sea-breeze activity on<br />
nearshore and foreshore processes <strong>in</strong> south-western Australia', Cont<strong>in</strong>ental Shelf<br />
Research, vol. 17, no. 13, pp. 1539-1560.<br />
Pitchen, P. 1993, Sand Bank Dynamics <strong>in</strong> <strong>Warnbro</strong> <strong>Sound</strong>, Honours <strong>The</strong>sis, <strong>University</strong> <strong>of</strong><br />
<strong>Western</strong> Australia.<br />
Sanderson, P. B., Eliot, I., Hegge, B. & Maxwell, S. 2000, 'Regional variation <strong>of</strong> coastal<br />
morphology <strong>in</strong> south-western Australia: a synthesis', Geomorphology, vol. 34, pp. 73-88.<br />
Searle, D. J. & Logan, B. W. 1979, <strong>Sediment</strong>ation at Mandurah: A report to <strong>The</strong> Public Works<br />
Department <strong>of</strong> <strong>Western</strong> Australia, Department <strong>of</strong> Geology, <strong>University</strong> <strong>of</strong> <strong>Western</strong><br />
Australia.<br />
Searle, D. J., Semeniuk, V. & Woods, P. J. 1988, 'Geomorphology, stratigraphy and Holocene<br />
history <strong>of</strong> the Rock<strong>in</strong>gham - Becher Pla<strong>in</strong>, South-western Australia', Journal <strong>of</strong> the Royal<br />
Society <strong>of</strong> <strong>Western</strong> Australia, vol. 70, no. 4, pp. 89-109.<br />
Silvester, R. 1987, Review <strong>of</strong> f<strong>in</strong>d<strong>in</strong>gs, Evaluation <strong>of</strong> the Westport environmental review and<br />
management program, Environmental Protection Authority.
8. References 82<br />
Steedman, R. K. 1982, Record <strong>of</strong> storms, Port <strong>of</strong> Fremantle 1962-1980, R112, Steedman and<br />
Associates, Perth.<br />
Sunamura, T. & Mizuno, O. 1987, A study on depositional shorel<strong>in</strong>e forms beh<strong>in</strong>d an island, No.<br />
13, <strong>University</strong> <strong>of</strong> Tsukuba, Tsukuba.<br />
Tonk, A., Massel<strong>in</strong>k, G. & Pattiaratchi, C. B. 2002, 'Longshore sediment <strong>transport</strong> due to sea<br />
breezes: An impoundment study'.<br />
Travers, A. 2004, 'Low energy beach morphology with respect to physical sett<strong>in</strong>g', (In Press).<br />
Woodr<strong>of</strong>fe, C. D. 2003, Coasts: form, process and evolution, Cambridge <strong>University</strong> Press, New<br />
York.
Appendices 83<br />
APPENDICES<br />
Appendix A1<br />
Mersey Po<strong>in</strong>t Coastl<strong>in</strong>e Movement Plots<br />
This appendix conta<strong>in</strong>s the coastl<strong>in</strong>e movement plots for Mersey Po<strong>in</strong>t
Appendices 84
Appendices 85
Appendices 86<br />
Appendix A2<br />
Safety Bay Coastl<strong>in</strong>e Movement Plots<br />
This appendix conta<strong>in</strong>s the coastl<strong>in</strong>e movement plots for Safety Bay
Appendices 87
Appendices 88<br />
Appendix A3<br />
Becher Po<strong>in</strong>t Coastl<strong>in</strong>e Movement Plot<br />
This appendix conta<strong>in</strong>s the coastl<strong>in</strong>e movement plots for Becher Po<strong>in</strong>t
Appendices 89
Appendices 90<br />
Appendix B<br />
Tern Island Aerial Photographs<br />
This appendix conta<strong>in</strong>s a time series <strong>of</strong> aerial photographs <strong>of</strong> the Tern Island sand bar
Appendices 91<br />
Tern Island sand bar 1942 Tern Island sand bar 1954<br />
Tern Island sand bar 1959 Tern Island sand bar 1967<br />
Tern Island sand bar 1973 Tern Island sand bar 1976
Appendices 92<br />
Tern Island sand bar 1982 Tern Island sand bar 1988<br />
Tern Island sand bar 1989 Tern Island sand bar 1993<br />
Tern Island sand bar 1994 (12/94) Tern Island sand bar 1996A (01/96)
Appendices 93<br />
Tern Island sand bar 1996 (12/96) Tern Island sand bar 1998A (02/98)<br />
Tern Island sand bar 1998 (12/98) Tern Island sand bar 2000 (12/00)
Appendices 94<br />
Appendix C<br />
MATLAB Data Process<strong>in</strong>g Scripts<br />
This appendix conta<strong>in</strong>s the coastl<strong>in</strong>e movement plots for Becher Po<strong>in</strong>t, as well as brief<br />
descriptions <strong>of</strong> the changes
Appendices 95<br />
TPAR_MAKE.M<br />
% This program extracts wave parameters at the start <strong>of</strong> each one dimensional pr<strong>of</strong>ile<br />
% l<strong>in</strong>e from the coarse SWAN run. <strong>The</strong>se are saved as *.tpar files which are used as<br />
% <strong>in</strong>puts <strong>in</strong> to the one dimensional SWAN run<br />
%<br />
%<br />
% w_pr<strong>of</strong>.tbl, w_sound.tbl - coarse SWAN run output files conta<strong>in</strong><strong>in</strong>g wave<br />
% parameters at the start position <strong>of</strong> each<br />
% pr<strong>of</strong>ile.<br />
%<br />
%<br />
% Ben Holl<strong>in</strong>gs, October 2004<br />
clear;<br />
% Def<strong>in</strong>e the number <strong>of</strong> pr<strong>of</strong>iles and sound<strong>in</strong>g l<strong>in</strong>es<br />
num_p = 9;<br />
num_s = 9;<br />
% Load Data<br />
w_pr<strong>of</strong> = load('w_pr<strong>of</strong>.tbl');<br />
w_sound = load('w_sound.tbl');<br />
% F<strong>in</strong>d number <strong>of</strong> timesteps <strong>in</strong> each<br />
[rp,cp] = size(w_pr<strong>of</strong>);<br />
[rs,cs] = size(w_sound);<br />
tstep_p = rp/num_p;<br />
tstep_s = rs/num_s;<br />
% Separate data <strong>in</strong>to <strong>in</strong>dividual pr<strong>of</strong>iles and save to TPAR files<br />
% Pr<strong>of</strong>ile sites<br />
for k = 1:num_p<br />
pname = ['p',num2str(k),'.tpar'];<br />
fid = fopen(pname,'w');<br />
fpr<strong>in</strong>tf(fid,'TPAR\n');<br />
for i = 1:tstep_p<br />
j = i-1;<br />
p(i,:) = w_pr<strong>of</strong>(j * num_p + k,[1,6,9,7,10]);<br />
fpr<strong>in</strong>tf(fid,'%12.4f%8.2f%8.2f%8.2f%8.2f\n',p(i,1),p(i,2),p(i,3),p1i,4),p(i,5));<br />
end<br />
fclose(fid);<br />
end<br />
% <strong>Sound</strong><strong>in</strong>g sites<br />
for k = 1:num_s<br />
sname = ['s',num2str(k),'.tpar'];<br />
fid = fopen(sname,'w');<br />
fpr<strong>in</strong>tf(fid,'TPAR\n');<br />
for i = 1:tstep_p<br />
j = i-1;<br />
s(i,:) = w_sound(j * num_s + k,[1,6,9,7,10]);<br />
fpr<strong>in</strong>tf(fid,'%12.4f%8.2f%8.2f%8.2f%8.2f\n',s(i,1),s(i,2),s(i,3),p1i,4),s(i,5));<br />
end<br />
fclose(fid);<br />
end
Appendices 96<br />
BREAKING.M<br />
% This program f<strong>in</strong>ds the break<strong>in</strong>g position and extracts wave break<strong>in</strong>g data from the<br />
SWAN output.<br />
%<br />
%<br />
% break_par.txt - file conta<strong>in</strong><strong>in</strong>g the lengths <strong>of</strong> pr<strong>of</strong>iles &<br />
% sound<strong>in</strong>g l<strong>in</strong>es<br />
%<br />
% p*.tbl - SWAN Pr<strong>of</strong>ile output files<br />
%<br />
% s*.tbl - SWAN <strong>Sound</strong><strong>in</strong>g l<strong>in</strong>e output files<br />
%<br />
%<br />
% *.tbl File Layout<br />
% ----------------------------------------------------------<br />
% | TIME | XP | YP | HSIG | DIR | DEPTH | TM01 | DISSIP | QB |<br />
% ----------------------------------------------------------<br />
%<br />
%<br />
% Ben Holl<strong>in</strong>gs, October 2004<br />
%Load number <strong>of</strong> po<strong>in</strong>ts per pr<strong>of</strong>ile & default break pos load break_par.txt<br />
load break_par.txt<br />
% For each pr<strong>of</strong>ile<br />
for i = 1:18<br />
end<br />
end<br />
if i=10<br />
pname = ['s',num2str(i-9),'.tbl'];<br />
end<br />
pdata = load(pname);<br />
numpts = break_par(i,1);<br />
defaultBP = break_par(i,2);<br />
[r,c] = size(pdata);<br />
ntsteps = r/numpts;<br />
% For each timestep calculate break po<strong>in</strong>t and write break<strong>in</strong>g data to arrays<br />
for ii = 1:ntsteps<br />
data = pdata(((ii-1)*numpts + 1):(ii*numpts),[4,5,9]);<br />
[val,pos] = max(data(:,3));<br />
if val==0<br />
pos = defaultBP;<br />
end<br />
HB(ii,i) = data(pos,1);<br />
DIR(ii,i) = data(pos,2);
Appendices 97<br />
% Pr<strong>in</strong>t data to files<br />
fid1 = fopen('brk_height.dat','w');<br />
fid2 = fopen('brk_dir.dat','w');<br />
for iii = 1:ntsteps<br />
fpr<strong>in</strong>tf(fid1,'%10.3f%10.3f%10.3f%10.3f%10.3f%10.3f%10.3f%10.3f%10.3f%10.3f%10.3f%10.3f%<br />
10.3f%10.3f%10.3f%10.3f%10.3f%10.3f\n',HB(iii,1),HB(iii,2),HB(iii,3),HB(iii,4),HB(iii,5<br />
),HB(iii,6),HB(iii,7),HB(iii,8),HB(iii,9),HB(iii,10),HB(iii,11),HB(iii,12),HB(iii,13),H<br />
B(iii,14),HB(iii,15),HB(iii,16),HB(iii,17),HB(iii,18));<br />
fpr<strong>in</strong>tf(fid2,'%10.3f%10.3f%10.3f%10.3f%10.3f%10.3f%10.3f%10.3f%10.3f%10.3f%10.3f%10.3f%<br />
10.3f%10.3f%10.3f%10.3f%10.3f%10.3f\n',DIR(iii,1),DIR(iii,2),DIR(iii,3),DIR(iii,4),DIR(<br />
iii,5),DIR(iii,6),DIR(iii,7),DIR(iii,8),DIR(iii,9),DIR(iii,10),DIR(iii,11),DIR(iii,12),<br />
DIR(iii,13),DIR(iii,14),DIR(iii,15),DIR(iii,16),DIR(iii,17),DIR(iii,18));<br />
end<br />
fclose(fid1);<br />
fclose(fid2);
Appendices 98<br />
TRANSPORT.M<br />
This program calculates <strong>transport</strong> rates and volumes us<strong>in</strong>g CERC method and the output<br />
wave break<strong>in</strong>g data from BREAKING.M<br />
%<br />
% p_angle.txt - file conta<strong>in</strong><strong>in</strong>g all pr<strong>of</strong>ile angles<br />
%<br />
% brk_height.dat - file conta<strong>in</strong><strong>in</strong>g break<strong>in</strong>g heights (output<br />
% from BREAKING.M)<br />
%<br />
% brk_dir.dat - file conta<strong>in</strong><strong>in</strong>g break<strong>in</strong>g directions (output<br />
% from BREAKING.M)<br />
%<br />
%<br />
% Ben Holl<strong>in</strong>gs, October 2004<br />
clear;<br />
% Load pr<strong>of</strong>ile orientation angle data<br />
p_angle = load('p_angle.txt');<br />
% Load break<strong>in</strong>g height and direction data (from break<strong>in</strong>g.m)<br />
HB = load('brk_height.dat');<br />
DIR = load('brk_dir.dat');<br />
% Calculate the breaker angle (for each pr<strong>of</strong>ile)<br />
for i = 1:18<br />
ALPHAB(:,i) = DIR(:,i) - p_angle(i);<br />
end<br />
% Def<strong>in</strong>e Constants for CERC equation<br />
rho = 1025; % Density <strong>of</strong> seawater (CERC,2002)<br />
rhos = 2650; % Density <strong>of</strong> sediments (CERC,2002)<br />
g = 9.81; % Acceleration due to gravity<br />
k = 0.78; % Wave break<strong>in</strong>g parameter (CERC,2002)<br />
K = 0.3; % Empiricam proportionality coefficient (Komar,1998)<br />
n = 0.4; % In place porosity (CERC,2002)<br />
% Calculate Longshore component <strong>of</strong> wave power (Pl)<br />
Ql = (0.125 * rho * g * HB.^2) .* ((g*(HB./k)).^0.5) .* s<strong>in</strong>(ALPHAB*pi/180) .*<br />
cos(ALPHAB*pi/180);<br />
% Calculate Longshore sediment <strong>transport</strong> rate (+ve is up the coast) [Ql]=m^3/sec<br />
Ql = (K / ((rhos-rho) * g * (1 - n))) .* Pl;<br />
% Calculate three hour <strong>transport</strong> volume<br />
three_hr_vol = Ql*10800;<br />
% Calculate monthly <strong>transport</strong> volume<br />
for ii = 1:18<br />
month_vol(1,ii) = sum(three_hr_vol(1:248,ii));<br />
month_vol(2,ii) = sum(three_hr_vol(249:472,ii));<br />
month_vol(3,ii) = sum(three_hr_vol(473:720,ii));<br />
month_vol(4,ii) = sum(three_hr_vol(721:960,ii));<br />
month_vol(5,ii) = sum(three_hr_vol(961:1208,ii));<br />
month_vol(6,ii) = sum(three_hr_vol(1209:1448,ii));<br />
month_vol(7,ii) = sum(three_hr_vol(1449:1696,ii));<br />
month_vol(8,ii) = sum(three_hr_vol(1697:1952,ii));<br />
month_vol(9,ii) = sum(three_hr_vol(1953:2184,ii));
Appendices 99<br />
end<br />
month_vol(10,ii) = sum(three_hr_vol(2185:2432,ii));<br />
month_vol(11,ii) = sum(three_hr_vol(2433:2672,ii));<br />
month_vol(12,ii) = sum(three_hr_vol(2673:2920,ii));<br />
% Calculate net annual <strong>transport</strong> volume<br />
netQL(1,ii) = sum(three_hr_vol(:,ii));<br />
% Calculate gross annual <strong>transport</strong> volume<br />
grossQL(1,ii) = sum(abs(three_hr_vol(:,ii)));
Appendices 100<br />
Appendix D<br />
Aerial Photograph Geo-referenc<strong>in</strong>g<br />
This appendix conta<strong>in</strong>s an account <strong>of</strong> the geo-referenc<strong>in</strong>g <strong>of</strong> aerial photograph <strong>in</strong> ArcMap
Appendices 101<br />
Geo-referenc<strong>in</strong>g<br />
1. Open ArcMap<br />
2. Load Photograph (select yes to build pyramids)<br />
3. Load road coverage file<br />
4. Activate geo-referenc<strong>in</strong>g tool bar<br />
5. Us<strong>in</strong>g the shape arc command match equivalent po<strong>in</strong>ts by select<strong>in</strong>g a road <strong>in</strong>tersection on<br />
the photograph then match<strong>in</strong>g it to the correspond<strong>in</strong>g po<strong>in</strong>t on the road coverage<br />
6. Repeat this process until at least 15 po<strong>in</strong>ts have been matched and the photo ‘fits the road<br />
coverage.<br />
7. View residuals, ensure that the RMS residual is less than 0.0005 and there are at least 10<br />
po<strong>in</strong>ts<br />
8. Use the follow<strong>in</strong>g commands <strong>in</strong> the geo-referenc<strong>in</strong>g toolbar:<br />
• Update geo-referenc<strong>in</strong>g<br />
• Rectify ! (select filename to save as<br />
Shorel<strong>in</strong>e plots<br />
1. Open ArcView<br />
2. Load rectified aerial photograph<br />
3. Add new theme (select add l<strong>in</strong>e theme)<br />
4. Draw a l<strong>in</strong>e follow<strong>in</strong>g the water l<strong>in</strong>e<br />
5. Save edits to shape file
Appendices 102