Neurotic disorders
Neurotic disorders
Neurotic disorders

Create successful ePaper yourself
Turn your PDF publications into a flip-book with our unique Google optimized e-Paper software.
Notesontablesandfigures<br />
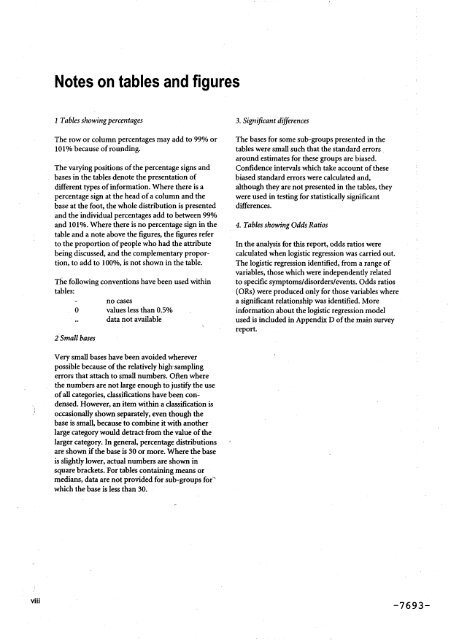
I Tables showingpercentages<br />
3. Significant differences<br />
The row or column percentages may add to 99% or The bases for some sub-groups presented in the<br />
101% because of rounding, tables were small such that the standard errors<br />
around estimates for these groups are biased.<br />
The varying positions of the percentage signs and Confidence intervals which take account of these<br />
bases in the tables denote the presentation of<br />
biased standard errors were calculated and,<br />
different types of information. Where there is a although they are not presented in the tables, they<br />
percentage sign at the head of a column and the were used in testing for statistically significant<br />
base at the foot, the whole distribution is presented differences.<br />
and the individual percentages add to between 99%<br />
and 101%. Where there is no percentage sign in the 4. Tables showing Odds Ratios<br />
table and a note above the figures, the figures refer<br />
to the proportion of people who had the attribute In the analysis for this report, odds ratios were<br />
being discussed, and the complementary propor- calculated when logistic regression was carried out.<br />
tion, to add to 100%0,is not shown in the table. The logistic regression identified, from a range of<br />
variable's, those which were independently related<br />
The following conventions have been used within to specific symptoms/<strong>disorders</strong>/events. Odds ratios<br />
tables:<br />
(ORs) were produced only for those variables where<br />
no cases<br />
a significant relationship was identified. More<br />
0 values lessthan 0.5% information about the logistic regression model<br />
.. data not available used is included in Appendix D of the main survey<br />
report.<br />
2 Small bases<br />
Very small bases have been avoided wherever<br />
possible because of the relatively high-sampling<br />
errors that attach to small numbers. Often where<br />
the numbers are not large enough to justify the use<br />
of all categories, classifications have been condensed.<br />
However, an item within a classification is<br />
occasionally shown separately, even though the<br />
base is small, because to combine it with another<br />
large category would detract-from the value of the<br />
larger category. In general, percentage distributions<br />
are shown if the base is 30 or more. Where the base<br />
is slightly lower, actual numbers are shown in<br />
square brackets. For tables containing means or<br />
medians, data are not provided for sub-groups for"<br />
which the base is less than 30.<br />
...<br />
v,,, -7 6 9 3 -