Wind Review - Met Office
Wind Review - Met Office
Wind Review - Met Office

Create successful ePaper yourself
Turn your PDF publications into a flip-book with our unique Google optimized e-Paper software.
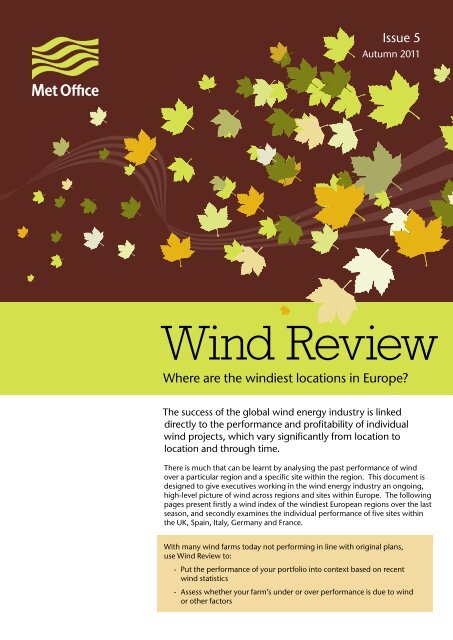
Issue 5<br />
Autumn 2011<br />
<strong>Wind</strong> <strong>Review</strong><br />
Where are the windiest locations in Europe<br />
The success of the global wind energy industry is linked<br />
directly to the performance and profitability of individual<br />
wind projects, which vary significantly from location to<br />
location and through time.<br />
There is much that can be learnt by analysing the past performance of wind<br />
over a particular region and a specific site within the region. This document is<br />
designed to give executives working in the wind energy industry an ongoing,<br />
high-level picture of wind across regions and sites within Europe. The following<br />
pages present firstly a wind index of the windiest European regions over the last<br />
season, and secondly examines the individual performance of five sites within<br />
the UK, Spain, Italy, Germany and France.<br />
With many wind farms today not performing in line with original plans,<br />
use <strong>Wind</strong> <strong>Review</strong> to:<br />
- Put the performance of your portfolio into context based on recent<br />
wind statistics<br />
- Assess whether your farm’s under or over performance is due to wind<br />
or other factors
<strong>Wind</strong> index<br />
We have used data generated from our weather model to create a wind index, ranking fifteen<br />
regions across Europe by comparing the average wind speed for Autumn 2011 against the autumn<br />
season long-term average. The table also compares, as a percentage, the wind speeds in Autumn<br />
2011 to Autumn 2010 and also Autumn 2011 with the previous 12 months.<br />
Rank Region Autumn season<br />
compared to autumn<br />
long-term average<br />
Autumn season<br />
compared to last<br />
year’s season<br />
Autumn season<br />
compared to previous<br />
12 months<br />
1 British Isles +15% +13% +36%<br />
2 Iceland +11% +16% +17%<br />
3 North Sea +6% +3% +23%<br />
4 Scandinavia +5% +6% +19%<br />
5 Baltic +3% -1% +16%<br />
6 Denmark +1% +3% +14%<br />
7 Benelux -3% +1% +12%<br />
7 Turkey -3% -7% +2%<br />
8 Ukraine & Belarus -4% -6% +7%<br />
9 Poland -7% -9% +3%<br />
9 SE Europe -7% -10% +1%<br />
9 Iberia -7% -7% -1%<br />
10 Italy -8% -9% 0%<br />
10 Germany -8% -8% +2%<br />
11 France -12% -10% +2%<br />
The table shows that, for Autumn 2011, parts of If we look at the site-specific graphs, we can see this<br />
northern and western Europe saw wind speeds rather trend with Cambridge in the UK which had a windier<br />
above the seasonal norm, especially around the British autumn than normal while elsewhere it was near<br />
Isles and Iceland. In contrast, central southern and average or slightly below. Lake Constance in Germany<br />
eastern Europe experienced winds near or a little below has seen persistently lighter winds than normal<br />
the long-term average for the time of year. This pattern throughout the year, with this autumn being much<br />
of weather is very typical for an average autumn. If you quieter than the same period last year.<br />
compare the rankings of the long-term average wind<br />
speeds with this particular autumn, you will see that<br />
the rankings are almost identical.<br />
The season experienced a pattern that many would<br />
expect for the time of year, as a series of deepening<br />
areas of low pressure swept across the Atlantic to<br />
affect northwest Europe, while further south and east,<br />
pressure was much slacker, hence the light winds.<br />
This pattern is quite different to the generally blocked<br />
pattern of weather we had this time last year when<br />
wind speeds were lower than expected in many areas.
Site-specific graphs<br />
Site-specific monthly average wind speeds<br />
The graphs below compare the monthly average<br />
wind speeds against the long-term average, over<br />
a one year period for five individual sites across<br />
the United Kingdom, Germany, France, Italy<br />
and Spain. It has been generated by Virtual<br />
<strong>Met</strong> Mast TM , the <strong>Met</strong> <strong>Office</strong>’s site-specific<br />
wind analysis model-based tool.<br />
B<br />
E<br />
D<br />
C<br />
A<br />
7.00<br />
Monthly Average <strong>Wind</strong> Speed - Andalucia, Spain<br />
A<br />
6.00<br />
5.00<br />
<strong>Wind</strong> Speed (m/s)<br />
4.00<br />
3.00<br />
2.00<br />
Percent above the long-term average for last 12 months: +2.7%<br />
1.00<br />
Monthly Average<br />
Long Term Average<br />
0.00<br />
Dec-10 Jan-11 Feb-11 Mar-11 Apr-11 May-11 Jun-11 Jul-11 Aug-11 Sep-11 Oct-11 Nov-11<br />
B<br />
9.00<br />
8.00<br />
Monthly Average <strong>Wind</strong> Speed - Cambridge, UK<br />
8<br />
D<br />
4.00<br />
3.50<br />
Monthly Average <strong>Wind</strong> Speed - Lake Constance, Germany<br />
7.00<br />
3.00<br />
6.00<br />
2.50<br />
<strong>Wind</strong> Speed (m/s)<br />
5.00<br />
4.00<br />
<strong>Wind</strong> Speed (m/s)<br />
2.00<br />
1.50<br />
3.00<br />
2.00<br />
1.00<br />
Percent below the long-term average for last 12 months: -0.6%<br />
1.00<br />
0.50<br />
Percent below the long-term average for last 12 months: -27.8%<br />
Monthly Average<br />
Long Term Average<br />
Monthly Average<br />
Long Term Average<br />
0.00<br />
Dec-10 Jan-11 Feb-11 Mar-11 Apr-11 May-11 Jun-11 Jul-11 Aug-11 Sep-11 Oct-11 Nov-11<br />
0.00<br />
Dec-10 Jan-11 Feb-11 Mar-11 Apr-11 May-11 Jun-11 Jul-11 Aug-11 Sep-11 Oct-11 Nov-11<br />
C<br />
4.00<br />
Monthly Average <strong>Wind</strong> Speed - Po Valley, Italy<br />
E<br />
7.00<br />
Monthly Average <strong>Wind</strong> Speed - Versailles, France<br />
3.50<br />
6.00<br />
3.00<br />
5.00<br />
<strong>Wind</strong> Speed (m/s)<br />
2.50<br />
2.00<br />
1.50<br />
<strong>Wind</strong> Speed (m/s)<br />
4.00<br />
3.00<br />
1.00<br />
Percent below the long-term average for last 12 months: -5.5%<br />
2.00<br />
Percent below the long-term average for last 12 months: -6.6%<br />
0.50<br />
1.00<br />
Monthly Average<br />
Long Term Average<br />
Monthly Average<br />
Long Term Average<br />
0.00<br />
Dec-10 Jan-11 Feb-11 Mar-11 Apr-11 May-11 Jun-11 Jul-11 Aug-11 Sep-11 Oct-11 Nov-11<br />
0.00<br />
Dec-10 Jan-11 Feb-11 Mar-11 Apr-11 May-11 Jun-11 Jul-11 Aug-11 Sep-11 Oct-11 Nov-11
At the <strong>Met</strong> <strong>Office</strong>, we understand<br />
better than anyone the impact<br />
the weather can have on the<br />
wind energy industry. We are<br />
committed to providing quality<br />
services to our customers based on<br />
a firm understanding of their needs.<br />
The <strong>Met</strong> <strong>Office</strong>’s European suite of solutions for the wind energy<br />
industry is designed to support critical decision-making at all<br />
stages of the project life cycle, from site analysis and selection,<br />
to the monitoring and management of operating conditions<br />
once the farm is operational. We will be pleased to advise how<br />
we can generate a wind index for your current and planned<br />
sites and to assist you in managing the performance of your<br />
wind portfolio.<br />
With the <strong>Met</strong> <strong>Office</strong> coverage, level and range of data across<br />
Europe, you can be assured of receiving first-class analysis and<br />
forecast information.<br />
For more information call us on<br />
+44 (0)1392 885680 or email: energy@metoffice.gov.uk<br />
<strong>Met</strong> <strong>Office</strong> Tel: 0870 900 0100 Produced by the <strong>Met</strong> <strong>Office</strong>.<br />
FitzRoy Road, Exeter Email: energy@metoffice.gov.uk © Crown copyright 2011 11/0463<br />
Devon, EX1 3PB www.metoffice.gov.uk/energy/ <strong>Met</strong> <strong>Office</strong> and the <strong>Met</strong> <strong>Office</strong> logo<br />
United Kingdom renewables/wind are registered trademarks