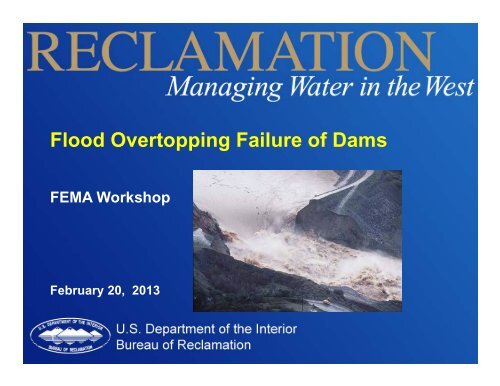
Flood Overtopping Failure of Dams
Flood Overtopping Failure of Dams
Flood Overtopping Failure of Dams
Create successful ePaper yourself
Turn your PDF publications into a flip-book with our unique Google optimized e-Paper software.
<strong>Flood</strong> <strong>Overtopping</strong> <strong>Failure</strong> <strong>of</strong> <strong>Dams</strong><br />
FEMA Workshop<br />
February 20, 2013<br />
1
Auburn C<strong>of</strong>ferdam<br />
2<br />
Breached during event that exceeded design flood.
Taum Sauk Dam<br />
3<br />
No spillway provided; dam was overfilled due to operational issues
Gibson Dam<br />
4<br />
Concrete dam successfully overtopped.
Delhi Dam<br />
Limited spillway capacity, inoperable spillway gate, internal erosion<br />
mechanism.<br />
5
Dam <strong>Overtopping</strong> <strong>Failure</strong> Mode<br />
• <strong>Failure</strong> <strong>of</strong> dams due to overtopping is a common<br />
failure mode, accounting for 30 percent <strong>of</strong> the<br />
failures in the U.S. over the last 75 years<br />
• Many older dams may have been designed for<br />
floods that no longer represent a remote flood<br />
event<br />
• Many dams can not pass the current Probable<br />
Maximum <strong>Flood</strong> without overtopping<br />
6
Dam <strong>Overtopping</strong> <strong>Failure</strong> Mode<br />
• Most embankment dams would likely not<br />
withstand sustained overtopping <strong>of</strong> a foot or<br />
more without a high probability <strong>of</strong> failure<br />
• While most concrete dams can likely withstand a<br />
certain level <strong>of</strong> overtopping due to their rock<br />
foundations, some may be vulnerable due to the<br />
jointing and fracturing in the rock mass<br />
• Reclamation evaluates both embankment and<br />
concrete dams for the overtopping failure mode<br />
7
Embankment Dam <strong>Overtopping</strong> <strong>Failure</strong><br />
8
Embankment Dam <strong>Overtopping</strong><br />
Event Tree<br />
Loading Braches<br />
Response<br />
Dam <strong>Overtopping</strong> <strong>Failure</strong> Mode<br />
> 466<br />
Starting RWS El<br />
0<br />
450 - 456<br />
440 - 450<br />
< 440<br />
Yes<br />
> 100k<br />
1.00E-05<br />
Dam Breach<br />
0 0<br />
No<br />
10.0% <strong>Flood</strong> Load Range<br />
0 0<br />
50k - 100k<br />
1.00E-05<br />
1.00E-06<br />
0 0<br />
10k - 50k<br />
8.00E-05<br />
8.00E-06<br />
0 0<br />
< 10k<br />
0.9999 9.999%<br />
0 0<br />
20.0% 20.0%<br />
0 0<br />
60.0% 60.0%<br />
0 0<br />
10.0% 10.0%<br />
0 0<br />
0.999 9.99E-07<br />
0 0<br />
0.001 1.00E-09<br />
0 0<br />
Annualized <strong>Failure</strong> Probability (AFP) = P loading x P response<br />
Annualized Life Loss = AFP x estimated life loss
Reclamation’s<br />
Public<br />
Protection<br />
Guidelines<br />
10
Embankment Dam <strong>Overtopping</strong><br />
<strong>Failure</strong><br />
• Generally there are few mitigating factors for an<br />
embankment dam with any significant<br />
overtopping (more than 6 inches) that occurs for<br />
an extended duration (more than a few hours)<br />
• <strong>Failure</strong> <strong>of</strong>ten estimated with one conditional<br />
failure probability for a single event (breach<br />
given overtopping conditions)<br />
• More events don’t add to better defined<br />
estimates<br />
11
Probable Maximum <strong>Flood</strong> (PMF)<br />
• Reclamation currently recognizes the PMF as<br />
the upper limit <strong>of</strong> flood potential at a site, for<br />
storm duration and magnitude defined by the<br />
Probable Maximum Precipitation (PMP)<br />
• Reclamation uses the PMF, calculated using<br />
current procedures and policy, as the upper limit<br />
<strong>of</strong> extreme floods for risk analysis, corrective<br />
action decisions, and dam safety modifications<br />
• This is consistent with Federal guidelines for<br />
selecting and accommodating inflow design<br />
floods (FEMA, 1998)<br />
12
Reclamation Process for Evaluating<br />
Dam <strong>Overtopping</strong> <strong>Failure</strong> Mode<br />
• Initial screening with PMF<br />
• If PMF can not be safely passed, additional flood<br />
studies are conducted<br />
• Initial flood study – flood frequency curves based<br />
on peaks and volumes<br />
• Refined flood studies – frequency flood<br />
hydrographs developed and routed<br />
• If risks are unacceptable, Corrective Action<br />
Study (CAS) is initiated<br />
• At onset <strong>of</strong> CAS, an inflow design flood is<br />
selected that will result in acceptable risks<br />
13
Evaluation Process for<br />
Dam <strong>Overtopping</strong><br />
Yes<br />
Yes<br />
Yes<br />
Are risks unacceptable<br />
(based on routings)<br />
Select IDF and Perform CAS<br />
No<br />
(based on acceptable risk)<br />
Yes<br />
Are risks unacceptable<br />
(based on peak inflows)<br />
No<br />
No<br />
Evaluation <strong>of</strong> <strong>Flood</strong> <strong>Overtopping</strong><br />
Does PMF Overtop Dam<br />
No<br />
14
Initial Risk Screening Based on<br />
PMF<br />
• Reclamation typically uses the PMF as a<br />
screening tool for the dam overtopping<br />
failure mode<br />
• If the PMF is current and can be safely<br />
passed without overtopping the dam,<br />
overtopping is typically not considered a<br />
viable failure mode<br />
15
Initial Risk Screening Based on<br />
PMF<br />
• Exceptions to screening out failure mode if no<br />
overtopping<br />
– PMF is not current and is expected to increase<br />
– PMF is for a certain storm event and a more critical<br />
storm event may exist<br />
– The spillway is gated and there are concerns that the<br />
spillway may not be operated as intended<br />
– Reasons to believe assumptions made in flood<br />
routing may not be achieved during an actual flood<br />
16
Risk <strong>of</strong> Dam <strong>Overtopping</strong> Based on<br />
Peak Inflows<br />
• <strong>Flood</strong> frequency curve is generated which relates peak<br />
inflows (or volumes) to a return period<br />
• Reservoir elevation ranges are set up and spillway<br />
discharges are matched to reservoir elevations; spillway<br />
discharges are equated to peak flood inflows<br />
• Based on the conservative assumptions that inflow<br />
equals outflow and that there is no benefit from reservoir<br />
surcharge space<br />
• Risks are generated from the above process and<br />
compared to Reclamation’s Public Protection Guidelines<br />
• If a threshold flood has been estimated as a percentage<br />
<strong>of</strong> the PMF, the flood frequency curves can be used to<br />
estimate the return period <strong>of</strong> the threshold flood<br />
17
Reservoir<br />
Water Surface<br />
El Range<br />
Table 1 - Summary <strong>of</strong> Risk Estimates for Dam <strong>Overtopping</strong> <strong>Failure</strong> Mode<br />
Evaluation Based on Comparison <strong>of</strong> Spillway Discharge Capacity to <strong>Flood</strong> Frequency Peaks<br />
Spillway<br />
Discharge<br />
Capacity, ft 3 /s<br />
Corresponding<br />
Frequency<br />
<strong>Flood</strong>, year<br />
Probability <strong>of</strong><br />
<strong>Flood</strong> Range<br />
Freeboard (+)<br />
<strong>Overtopping</strong><br />
(-) Depth<br />
Estimated<br />
Probability<br />
<strong>of</strong> <strong>Failure</strong><br />
Annual<br />
Probability<br />
<strong>of</strong> <strong>Failure</strong><br />
Annualized<br />
Loss <strong>of</strong> Life 1<br />
740 – 749 0 – 7400 100–10,000 .0099 9 to 2 0 0 0<br />
749 – 750 7400 – 8670 10,000–50,000 .00008 2 to 1 0 to 0.1 4 E-06 4 E-04<br />
750 – 751 8670 – 10,000<br />
751 – 752<br />
> 752<br />
10,000 –<br />
11,390<br />
11,390 –<br />
12,848<br />
50,000–<br />
100,000<br />
100,000-<br />
120,000<br />
.00001 1 to 0 0.1 to 0.3 2 E-06 2 E-04<br />
.00000167 0 to -1 0.3 to 0.999 1 E-06 1 E-04<br />
> 120,000 .00000833 > -1 1 8 E-06 8 E-04<br />
Totals 1.5 E-05 1.5 E-03<br />
18
Attenuation <strong>of</strong> <strong>Flood</strong> Peak<br />
19
Risk <strong>of</strong> Dam <strong>Overtopping</strong> Based on<br />
<strong>Flood</strong> Routings<br />
• If an evaluation <strong>of</strong> risk based on a comparison <strong>of</strong> flood<br />
peaks to spillway discharge capacity indicates<br />
overtopping may still be a viable failure mode, additional<br />
studies are conducted<br />
• <strong>Flood</strong> frequency hydrographs are developed and routed<br />
through the reservoir<br />
• This provides more accurate information on the potential<br />
for dam overtopping<br />
• Routing results are used to determine flood frequencies<br />
for reservoir elevation ranges<br />
• Risk results are compared to Reclamation’s Public<br />
Protection Guidelines<br />
20
Reservoir<br />
Water Surface<br />
El Range<br />
Table 2 - Summary <strong>of</strong> Risk Estimates for Dam <strong>Overtopping</strong> <strong>Failure</strong> Mode<br />
Evaluation Based on <strong>Flood</strong> Routing Results <strong>of</strong> <strong>Flood</strong> Frequency Peaks<br />
Corresponding<br />
Frequency <strong>Flood</strong><br />
from <strong>Flood</strong><br />
Routings<br />
Spillway<br />
Discharge<br />
Capacity, ft 3 /s<br />
Probability<br />
<strong>of</strong> <strong>Flood</strong><br />
Range<br />
Freeboard (+)<br />
<strong>Overtopping</strong><br />
(-) Depth<br />
Estimated<br />
Probability<br />
<strong>of</strong> <strong>Failure</strong><br />
Annual<br />
Probability<br />
<strong>of</strong> <strong>Failure</strong><br />
Annualized<br />
Loss <strong>of</strong> Life 1<br />
740 – 749 200-50,000 0 – 7400 .00498 9 to 2 0 0 0<br />
749 – 750 50,000-300,000 7400 – 8670 .0000167 2 to 1 0 to 0.1 8 E-07 8 E-05<br />
750 – 751 300,000-700,000 8670 – 10,000 .0000019 1 to 0 0.1 to 0.3 4 E-07 4 E-05<br />
751 – 752 700,000-900,000 10,000 – 11,390 .00000032 0 to -1 0.3 to 0.999 2 E-07 2 E-05<br />
752 – 753 > 900,000 11,390 – 12,848 .0000011 > -1 1 1 E-06 1 E-04<br />
Totals 2.4 E-06 2.4 E-04<br />
21
Uncertainties in <strong>Flood</strong> Routings<br />
• <strong>Flood</strong> Events<br />
• Starting Reservoir Water Surface<br />
Elevation<br />
• Reservoir Operations/Misoperations<br />
• Spillway Discharge<br />
22
Uncertainties with <strong>Flood</strong> Events<br />
• The size and shape <strong>of</strong> a given frequency<br />
flood may vary, depending on the peak<br />
and volume considerations and variations<br />
and the type <strong>of</strong> flood (thunderstorm or<br />
rain-on-snow flood)<br />
• The PMF for a given dam may change in<br />
the future if the hydrometeorological report<br />
for the site changes<br />
23
Uncertainties with Starting<br />
Reservoir Water Surface Elevation<br />
• The starting reservoir water surface elevation can be a<br />
critical input for flood routings<br />
• The default elevation may be the top <strong>of</strong> active<br />
conservation storage, but historical reservoir level data<br />
may indicate the reservoir is at this level a small<br />
percentage <strong>of</strong> the time<br />
• If starting reservoir water surface elevation is significant,<br />
flood routings should consider this variable and results<br />
incorporated into the event trees<br />
• Consideration for starting reservoir water surface<br />
elevations should also include the time <strong>of</strong> the year the<br />
flood is likely to occur<br />
24
Uncertainties with Reservoir<br />
Operations/Misoperations<br />
• The assumptions regarding reservoir operations<br />
for flood routings should be evaluated for<br />
reasonableness<br />
• If gated spillway operations will exceed<br />
downstream safe channel capacity, operators<br />
may be reluctant to follow SOP<br />
• Gated spillways may be vulnerable to one or<br />
more gates failing during a flood, due to<br />
mechanical failures, loss <strong>of</strong> power or gate<br />
binding<br />
• Sensitivity routings can evaluate variable<br />
assumptions<br />
25
Uncertainties with Spillway<br />
Discharge<br />
• Spillway discharge curves used in flood routings<br />
are <strong>of</strong>ten based on idealized discharge curves<br />
• Approach conditions that are less than ideal may<br />
reduce the discharge from what was assumed<br />
• Debris may block spillway openings and<br />
significantly lower the discharge<br />
• For gated spillways, flow will vary at a given<br />
water surface elevation depending on whether<br />
free flow or orifice conditions exists<br />
26
Key Concepts<br />
• Operational failure can include:<br />
– Debris plugs spillway (perhaps with log boom failure),<br />
dam overtops<br />
– Gates fail to open (hoists, chains, binding, electrical,<br />
remote communications), dam overtops<br />
– Gates open inadvertently – life-threatening flows<br />
– Loss <strong>of</strong> access to operate gates, dam overtops<br />
– Loss <strong>of</strong> release capacity (e.g. turbine), dam overtops<br />
– Overfilling <strong>of</strong>f-stream reservoir, dam overtops<br />
– Reluctance to open gates and flood people out<br />
– Operational changes adversely affect equipment<br />
needed to pass floods<br />
27
Data on Spillway (Lack <strong>of</strong>) Release<br />
Incidents<br />
• National Performance <strong>of</strong> <strong>Dams</strong> Database<br />
– 24 incidents related to debris plugging<br />
– 19 incidents related to structural failure<br />
– 25 incidents related to mis-operation<br />
• FERC Incident database<br />
– 6 incidents related to debris plugging<br />
28
Picture <strong>of</strong> Palagendra with Debris<br />
29
Picture <strong>of</strong> Kerckh<strong>of</strong>f w/ Debris<br />
30
Fragility Curves – Embankment<br />
Dam <strong>Overtopping</strong><br />
• Often initially assume that any overtopping leads<br />
to dam breach<br />
• Fragility curves can be developed<br />
– Team should consider carefully and document<br />
reasoning behind curves<br />
– For a given depth <strong>of</strong> overtopping, a range <strong>of</strong> values<br />
and a best estimate should be developed<br />
– Many factors to consider:<br />
31
Embankment Dam <strong>Overtopping</strong> –<br />
<strong>Failure</strong> Probability Factors<br />
• Depth and duration <strong>of</strong> overtopping<br />
• Camber or low spots on dam crest may<br />
concentrate overtopping flows<br />
• Flow may concentrate along groins or at toe<br />
• Downstream zoning/slope protection<br />
• Dam crest materials, paving<br />
• Wave set-up and run-up<br />
• Potential for failure <strong>of</strong> parapet walls<br />
• Discontinuities on crest or downstream face that<br />
could initiate erosion / headcutting<br />
32
Concrete Dam <strong>Overtopping</strong><br />
• <strong>Failure</strong> mode is generally more<br />
complicated<br />
• Erosion typically initiates in downstream<br />
portion <strong>of</strong> rock foundation; scour and<br />
headcutting undermine dam or allow<br />
foundation blocks to daylight; concrete<br />
structure is overstressed due to loss <strong>of</strong><br />
foundation support; dam breaches due to<br />
sliding or overturning <strong>of</strong> dam sections<br />
33
Concrete Dam <strong>Overtopping</strong> –<br />
<strong>Failure</strong> Probability Factors<br />
• Depth and duration <strong>of</strong> overtopping<br />
• Foundation conditions<br />
• Tailwater elevations<br />
34
Analysis Tools<br />
• WINDAM – Embankment <strong>Dams</strong><br />
• Streampower Approach – Concrete <strong>Dams</strong><br />
35
Consequences<br />
• Inundated area will generally increase over sunny day<br />
failure<br />
• Warning time may be substantial due to monitoring<br />
during a large flood<br />
• Population at risk may be reduced due to spillway<br />
releases prior to dam failure, but need to consider if<br />
evacuated populations remain in dam breach flood plain<br />
• Loss <strong>of</strong> life may be less than for sunny day failure<br />
• Thunderstorm events may reduce reaction and warning<br />
time as compared to rain on snow flood events<br />
36
Conclusions<br />
• Reclamation uses a staged approach to<br />
evaluate the overtopping failure mode<br />
• If the PMF overtops the dam, risks for dam<br />
overtopping may still be acceptable<br />
• If modifications are justified to reduce risk,<br />
IDF is selected to achieve acceptable risk<br />
37


