Using the Excel Solver to Solve linear Programming ... - PageOut
Using the Excel Solver to Solve linear Programming ... - PageOut
Using the Excel Solver to Solve linear Programming ... - PageOut

You also want an ePaper? Increase the reach of your titles
YUMPU automatically turns print PDFs into web optimized ePapers that Google loves.
<strong>Using</strong> <strong>the</strong> <strong>Excel</strong> <strong><strong>Solve</strong>r</strong> <strong>to</strong> <strong>Solve</strong> <strong>linear</strong> <strong>Programming</strong> Problems<br />
The next eight pages give a step-by-step guide for using <strong>the</strong> <strong><strong>Solve</strong>r</strong>' <strong>to</strong> solve <strong>linear</strong><br />
programming problems. It can be used <strong>to</strong> make overheads, or can serve as a handout for students.<br />
It is based upon solving <strong>the</strong> following example problem. PowerPoint slides containing this<br />
example problem and <strong>the</strong> notes for using <strong>the</strong> <strong><strong>Solve</strong>r</strong> (with <strong>the</strong> Lego example) are included on <strong>the</strong><br />
CD- ROM packaged with <strong>the</strong> text.<br />
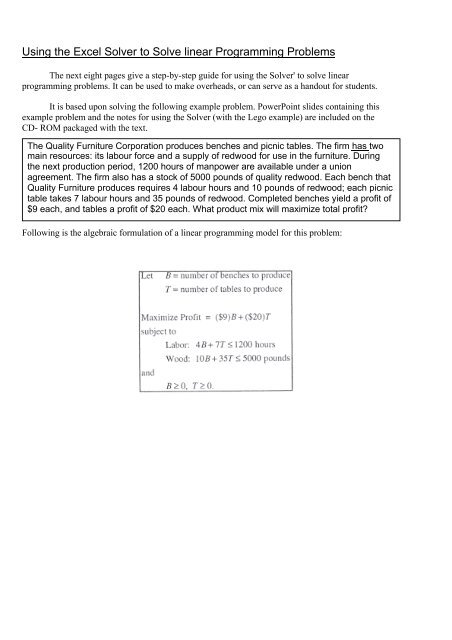
The Quality Furniture Corporation produces benches and picnic tables. The firm has two<br />
main resources: its labour force and a supply of redwood for use in <strong>the</strong> furniture. During<br />
<strong>the</strong> next production period, 1200 hours of manpower are available under a union<br />
agreement. The firm also has a s<strong>to</strong>ck of 5000 pounds of quality redwood. Each bench that<br />
Quality Furniture produces requires 4 labour hours and 10 pounds of redwood; each picnic<br />
table takes 7 labour hours and 35 pounds of redwood. Completed benches yield a profit of<br />
$9 each, and tables a profit of $20 each. What product mix will maximize <strong>to</strong>tal profit<br />
Following is <strong>the</strong> algebraic formulation of a <strong>linear</strong> programming model for this problem:
Formulating and Solving Linear <strong>Programming</strong> Models with <strong>Excel</strong><br />
Enter <strong>the</strong> input data and construct relationships among data elements in a readable, easy<br />
<strong>to</strong> understand way. When building this foundation for your model, think ahead about <strong>the</strong><br />
optimization model you will be developing. Make sure <strong>the</strong>re is a cell in your spreadsheet<br />
for each of <strong>the</strong> following:<br />
• Every relevant piece of data (see cells B5:C5, BS:C9, and F8:F9). These cells are<br />
<strong>the</strong> "data cells."<br />
• Every decision variable (for now, just label <strong>the</strong> cells, and enter an initial value for<br />
each decision variable - see cells B3 and C3). These cells are <strong>the</strong> "changing cells."<br />
• The quantity (objective function) you wish <strong>to</strong> maximize or minimize (this must be an<br />
equation that calculates <strong>the</strong> profit or cost, based on <strong>the</strong> value of <strong>the</strong> decision<br />
variables). The cell containing this quantity (see cell D5) is <strong>the</strong> "target cell."<br />
Every quantity that you might want <strong>to</strong> constrain (include both sides of <strong>the</strong><br />
constraint-an equation for <strong>the</strong> left-hand-side representing <strong>the</strong> amount of <strong>the</strong><br />
resource used, and a number for <strong>the</strong> right-hand-side representing <strong>the</strong> amount of<br />
<strong>the</strong> resource available). The left-hand-side <strong>to</strong>tals being constrained (see cells<br />
D8:D9) are <strong>the</strong> "output cells."<br />
If you don't have any particular initial values you want <strong>to</strong> enter for your decision variables,<br />
you can start by just entering a value of 0 in each changing cell. (Note that <strong>the</strong> following<br />
spreadsheet places <strong>the</strong> changing cells and profits at <strong>the</strong> <strong>to</strong>p, whereas <strong>the</strong> textbook places<br />
<strong>the</strong>m at <strong>the</strong> bot<strong>to</strong>m. Ei<strong>the</strong>r location is fine.)
The Formulas in <strong>the</strong> Spreadsheet<br />
The formulas in <strong>the</strong> spreadsheet are shown next. Note <strong>the</strong> use of <strong>the</strong> SUMPRODUCT<br />
function. SUMPRODUCT sums <strong>the</strong> products of individual cells in two ranges. For example,<br />
SUMPRODUCT(B5:CS, B3:C3) sums <strong>the</strong> products BS*B3 plus C5*C3. The two specified<br />
ranges must be <strong>the</strong> same shape (same number of rows and columns). For <strong>linear</strong><br />
programming, you should try <strong>to</strong> always use <strong>the</strong> SUMPRODUCT function (or SUM) for <strong>the</strong><br />
objective function and constraints, as this guarantees that <strong>the</strong> equations will be <strong>linear</strong>.
Defining <strong>the</strong> Target Cell (Objective Function)<br />
Once you are satisfied that <strong>the</strong> spreadsheet model is complete, and so includes all four of <strong>the</strong><br />
elements of <strong>the</strong> <strong>linear</strong> programming model (data, decision variables, objective function, constraints),<br />
<strong>the</strong>n<br />
• Choose <strong><strong>Solve</strong>r</strong> under <strong>the</strong> Tools menu.<br />
To select <strong>the</strong> cell you wish <strong>to</strong> optimize, select <strong>the</strong> "Set Target Cell" window within <strong>the</strong> <strong><strong>Solve</strong>r</strong><br />
dialogue box, and <strong>the</strong>n ei<strong>the</strong>r<br />
• Click on <strong>the</strong> cell you wish <strong>to</strong> optimize, or<br />
• Type <strong>the</strong> address of <strong>the</strong> cell you wish <strong>to</strong> optimize.<br />
• Choose ei<strong>the</strong>r "Max" or "Min" depending on whe<strong>the</strong>r <strong>the</strong> objective is <strong>to</strong> maximize or<br />
minimize <strong>the</strong> target cell.<br />
Note:<br />
• The target cell must be a single cell (<strong>the</strong>re can only be one objective).<br />
• The target cell should contain an equation that defines <strong>the</strong> objective and depends on <strong>the</strong><br />
decision variables.<br />
Identifying <strong>the</strong> Changing Cells (Decision Variables)
You next tell <strong><strong>Solve</strong>r</strong> which cells are decision variables-i.e., which cells <strong>Excel</strong> is allowed <strong>to</strong> change<br />
when trying <strong>to</strong> optimize. Move <strong>the</strong> cursor <strong>to</strong> <strong>the</strong> "By Changing Cells" window, and ei<strong>the</strong>r<br />
• Drag <strong>the</strong> cursor across all cells you wish <strong>to</strong> treat as decision variables, or<br />
• Type <strong>the</strong> addresses of every cell you wish <strong>to</strong> treat as a decision variable, separating <strong>the</strong>m by<br />
commas.<br />
If you wish <strong>to</strong> use <strong>the</strong> "dragging" method, but <strong>the</strong> decision variables do not all lie in a connected<br />
rectangle in <strong>the</strong> spreadsheet, you can "drag" <strong>the</strong>m in one group at a time:<br />
• Drag <strong>the</strong> cursor across one group of decision variables,<br />
• Put a comma after that group in <strong>the</strong> "By Changing Cells" window,<br />
• Drag <strong>the</strong> cursor across <strong>the</strong> next group of decision variables,<br />
• etc ....
Adding Constraints<br />
To begin entering constraints, click on <strong>the</strong> “Add” but<strong>to</strong>n <strong>to</strong> <strong>the</strong> right of <strong>the</strong> constraints windows. A<br />
new dialogue box will appear. The cursor will be in <strong>the</strong> “Cell Reference” windows with this<br />
dialogue box.<br />
• Click on <strong>the</strong> cell that contains <strong>the</strong> quantity you want <strong>to</strong> constrain, or<br />
• Type <strong>the</strong> cell address that contains <strong>the</strong> quantity you want <strong>to</strong> constrain.<br />
The default inequality that first appears for a constraint is "
Some Important Options<br />
The <strong><strong>Solve</strong>r</strong> dialogue box now contains <strong>the</strong> optimization model, including <strong>the</strong> target cell (objective<br />
function), changing cells (decision variables), and constraints.<br />
Once you are satisfied with this optimization model, <strong>the</strong>re is one more very important step. Click on<br />
<strong>the</strong> "Options" but<strong>to</strong>n in <strong>the</strong> <strong><strong>Solve</strong>r</strong> dialogue box, and click in both <strong>the</strong> "Assume Linear Model" and<br />
<strong>the</strong> "Assume Non-Negative" box.<br />
The "Assume Linear Model" option tells <strong>the</strong> <strong>Excel</strong> <strong><strong>Solve</strong>r</strong> that it is a <strong>linear</strong> programming model that<br />
is being solved. This speeds <strong>the</strong> solution process, makes it more accurate, and enables a more<br />
informative sensitivity report.<br />
The "Assume Non-Negative" box adds non-negativity constraints <strong>to</strong> all <strong>the</strong> decision variables.
The Solution<br />
After setting up <strong>the</strong> model and selecting <strong>the</strong> appropriate options, it is time <strong>to</strong> click "<strong>Solve</strong>". You <strong>the</strong>n<br />
will receive one of four messages:<br />
• "<strong><strong>Solve</strong>r</strong> found a solution. All constraints and optimality conditions are satisfied". This<br />
means that <strong><strong>Solve</strong>r</strong> has found an optimal solution.<br />
• "Cell values did not converge". This means that <strong>the</strong> objective function can be improved<br />
<strong>to</strong> infinity. You may have forgotten a constraint (perhaps <strong>the</strong> non-negativity constraints)<br />
or made a mistake in a formula.<br />
• "<strong><strong>Solve</strong>r</strong> could not find a feasible solution". This means that <strong><strong>Solve</strong>r</strong> could not find a<br />
feasible solution <strong>to</strong> <strong>the</strong> constraints you entered. You may have made a mistake in typing<br />
<strong>the</strong> constraints or in entering a formula in your spreadsheet.<br />
• "Conditions for Assume Linear Model not satisfied". You may have included a formula<br />
in your model that is non<strong>linear</strong>. There is also a slim chance that <strong><strong>Solve</strong>r</strong> has made an error.<br />
(This bug shows up occasionally.)<br />
If <strong><strong>Solve</strong>r</strong> finds an optimal solution, you have some options. First, you must choose whe<strong>the</strong>r you want<br />
<strong><strong>Solve</strong>r</strong> <strong>to</strong> keep <strong>the</strong> optimal values in <strong>the</strong> spreadsheet (you usually want t 'his one) or go back <strong>to</strong> <strong>the</strong><br />
original numbers you typed in. Click <strong>the</strong> appropriate box <strong>to</strong> make your selection. You also get <strong>to</strong><br />
choose what kind of reports you want. You will often want <strong>to</strong> select "Sensitivity Report". Once you<br />
have made your selections, click on "OK'. To view <strong>the</strong> sensitivity report, click on <strong>the</strong> "Sensitivity<br />
Report" tab in <strong>the</strong> lower-left-hand corner of <strong>the</strong> window.