Post merger profitability analysis of shareholders. Evidence from ...
Post merger profitability analysis of shareholders. Evidence from ...
Post merger profitability analysis of shareholders. Evidence from ...

Create successful ePaper yourself
Turn your PDF publications into a flip-book with our unique Google optimized e-Paper software.
changes in beta implies the coefficient b is zero. A significant<br />
negative t-statistic indicates a decrease in beta and a significant<br />
positive t-statistic an increase in beta after the <strong>of</strong>fer.<br />
The null hypothesis is rejected if the test statistic exceeds a<br />
significant value, here in the 5% tail region. In order to avoid Type<br />
1 (the null hypothesis is falsely rejected) and Type 2 errors (the null<br />
hypothesis is falsely accepted), a test statistic must be correctly<br />
specified. A correctly-specified test statistic yields a Type 1 error<br />
probability equal to the assumed size <strong>of</strong> the test. The second<br />
concern is power, i.e. a test’s ability to detect abnormal<br />
performance when it is present. Power can be measured as one<br />
minus the probability <strong>of</strong> a Type 2 error. The standard t-test <strong>of</strong> mean<br />
abnormal performance assumes that the mean abnormal<br />
performance for the cross-section <strong>of</strong> securities is normally<br />
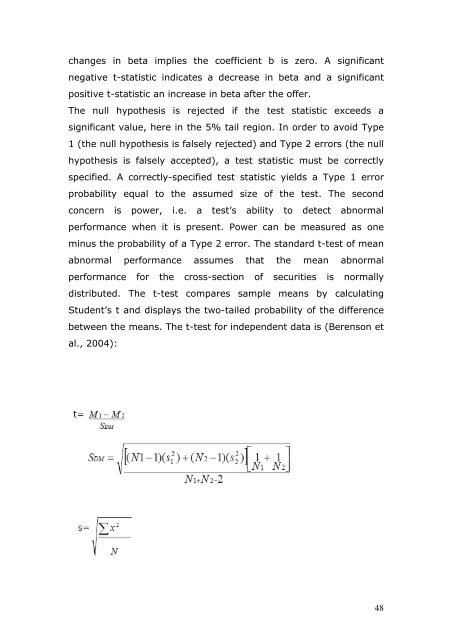
distributed. The t-test compares sample means by calculating<br />
Student’s t and displays the two-tailed probability <strong>of</strong> the difference<br />
between the means. The t-test for independent data is (Berenson et<br />
al., 2004):<br />
48