Annual Report 2001 - Alabama Department of Education
Annual Report 2001 - Alabama Department of Education
Annual Report 2001 - Alabama Department of Education

You also want an ePaper? Increase the reach of your titles
YUMPU automatically turns print PDFs into web optimized ePapers that Google loves.
<strong>Alabama</strong> <strong>Department</strong> <strong>of</strong> <strong>Education</strong><br />
ANNUAL REPORT<br />
2<br />
0<br />
0<br />
1
Superintendent’s Comments<br />
State <strong>of</strong> <strong>Alabama</strong><br />
<strong>Department</strong> <strong>of</strong> <strong>Education</strong><br />
Ed Richardson<br />
State Superintendent <strong>of</strong> <strong>Education</strong><br />
The Honorable Don Siegelman<br />
Governor <strong>of</strong> the State <strong>of</strong> <strong>Alabama</strong><br />
State Capitol<br />
Montgomery, <strong>Alabama</strong> 36130<br />
Dear Governor Siegelman:<br />
In accordance with section 16-3-21, Code <strong>of</strong> <strong>Alabama</strong>, 1975 and<br />
by direction <strong>of</strong> the State Board <strong>of</strong> <strong>Education</strong>, I am pleased to<br />
submit this statistical and financial report <strong>of</strong> operations for the<br />
State <strong>Department</strong> <strong>of</strong> <strong>Education</strong>. This report summarizes the<br />
activities and operations <strong>of</strong> the State <strong>Department</strong> <strong>of</strong> <strong>Education</strong><br />
for the scholastic year ending June 30, <strong>2001</strong> and the fiscal year<br />
ending September 30, <strong>2001</strong>.<br />
Respectfully submitted,<br />
Ed Richardson<br />
State Superintendent<br />
<strong>of</strong> <strong>Education</strong>
Table <strong>of</strong> Contents<br />
PUBLIC EDUCATION IN ALABAMA<br />
State Board <strong>of</strong> <strong>Education</strong>...................................................................................2<br />
Organization <strong>of</strong> K-12 in <strong>Alabama</strong> ....................................................................4<br />
School Systems..................................................................................................5<br />
School Data 2000-<strong>2001</strong> .....................................................................................6<br />
Accountability....................................................................................................7<br />
Standard Achievement Tests..............................................................................8<br />
<strong>Report</strong> Card 2000-<strong>2001</strong> ...................................................................................10<br />
Alert Schools and Systems ..............................................................................12<br />
PUPIL DATA<br />
Average Daily Membership (ADM)................................................................14<br />
Per Pupil Expenditures ....................................................................................18<br />
County/City Enrollment by Race & Gender ...................................................24<br />
Dropouts...........................................................................................................27<br />
Graduates – <strong>2001</strong> .............................................................................................28<br />
LOCAL EDUCATION AGENCIES<br />
Public <strong>Education</strong> ..............................................................................................30<br />
Foundation Program .........................................................................................32<br />
State Allocations ..............................................................................................34<br />
Combined Statement <strong>of</strong> Revenues...................................................................35<br />
System Revenues – FY <strong>2001</strong>...........................................................................36<br />
System Expenditures by Function – FY <strong>2001</strong>.................................................41<br />
Vocational <strong>Education</strong> Funds ............................................................................46<br />
STATE DEPARTMENT OF EDUCATION<br />
Organization Chart and Divisions ...................................................................48<br />
State <strong>Department</strong> Expenditures and Appropriations – 2000-<strong>2001</strong>..................55<br />
It is the <strong>of</strong>ficial policy <strong>of</strong> the <strong>Alabama</strong> State <strong>Department</strong> <strong>of</strong> <strong>Education</strong> that no person in <strong>Alabama</strong> shall, on the grounds <strong>of</strong> race, color, disability, sex, religion, national<br />
origin, or age be excluded from participation in, be denied the benefits <strong>of</strong>, or be subjected to discrimination under a ny program, activity, or employment.<br />
1
State Board <strong>of</strong> <strong>Education</strong><br />
Bradley Byrne<br />
District I<br />
P.O. Box 1348<br />
Mobile, AL 36633<br />
Work (251) 433-3234<br />
Fax (251) 438-7733<br />
G.J. “Dutch” Higginbotham<br />
District II<br />
166 North Gay Street<br />
Auburn, AL 36830<br />
Work (334) 821-7712<br />
Fax (334) 826-1295<br />
Gov. Don Siegelman<br />
President<br />
Governor’s Office<br />
State Capitol<br />
Montgomery, AL<br />
(334) 242-7100<br />
Dr. Ed Richardson<br />
Secretary and Executive Officer<br />
5114 Gordon Persons Building<br />
Montgomery, AL 36130-2101<br />
(334) 242-9700<br />
MISSION STATEMENT<br />
“To provide a state system <strong>of</strong> education<br />
which is committed to<br />
academic excellence<br />
and which provides education<br />
<strong>of</strong> the highest quality<br />
to all <strong>Alabama</strong> students,<br />
preparing them for the 21st century.”<br />
Dr. Mary Jane Caylor<br />
District VIII<br />
2345 County Road 67<br />
Scottsboro, AL 35769<br />
Work (256) 228-6822<br />
Fax (256) 228-3413<br />
Sandra Ray<br />
District VII<br />
2008 University Boulevard<br />
Tuscaloosa, AL 35401<br />
Work (205) 758-7777<br />
Fax (205) 758-7789<br />
Stephanie W. Bell<br />
District III<br />
3218 Lancaster Lane<br />
Montgomery, AL 36106<br />
Work (334) 272-2777<br />
Fax (334) 260-0100<br />
Dr. Ethel H. Hall, Vice President<br />
District IV<br />
7125 Westmoreland Drive<br />
Fairfield, AL 35064<br />
Work (205) 923-6093<br />
Fax (205) 923-5700<br />
Ella B. Bell<br />
District V<br />
2634 Airwood Drive<br />
Montgomery, AL 36108<br />
Work (334) 242-3278<br />
Fax (334) 242-0747<br />
David F. Byers Jr.<br />
District VI<br />
Two Metroplex Drive, Suite 111<br />
Birmingham, AL 35209<br />
Work (205) 263-2400<br />
Fax (205) 263-2300<br />
2
3<br />
8<br />
4<br />
3<br />
5<br />
2<br />
1<br />
DALLAS<br />
MORGAN<br />
MARSHALL<br />
TALLAPOOSA<br />
COVINGTON<br />
GENEVA<br />
HOUSTON<br />
LEE<br />
CHAMBERS<br />
COFFEE<br />
DALE<br />
HENRY<br />
RUSSELL<br />
CRENSHAW<br />
BARBOUR<br />
ESCAMBIA<br />
MOBILE<br />
BALDWIN<br />
GREENE<br />
SUMTER<br />
WASHINGTON<br />
PICKENS<br />
HALE<br />
PERRY<br />
MARENGO<br />
CHOCTAW<br />
CLARKE<br />
MONROE<br />
WILCOX<br />
CONECUH<br />
MONTGOMERY<br />
BULLOCK<br />
PIKE<br />
LOWNDES<br />
BUTLER<br />
MACON<br />
AUTAUGA<br />
TUSCALOOSA<br />
BIBB<br />
WALKER<br />
LAMAR<br />
FAYETTE<br />
CULLMAN<br />
BLOUNT<br />
SHELBY<br />
JEFFERSON<br />
LAUDERDALE<br />
FRANKLIN<br />
COLBERT<br />
LAWRENCE<br />
MARION<br />
WINSTON<br />
LIMESTONE<br />
CHEROKEE<br />
MADISON<br />
JACKSON<br />
DE KALB<br />
ETOWAH<br />
TALLADEGA<br />
CLEBURNE<br />
COOSA<br />
CLAY<br />
ST. CLAIR<br />
RANDOLPH<br />
CHILTON<br />
CALHOUN<br />
ELMORE<br />
6<br />
7<br />
SHELBY<br />
DISTRICT MAP
Organization <strong>of</strong> K-12 in <strong>Alabama</strong><br />
◗ ALABAMA LEGISLATURE<br />
Formulation <strong>of</strong> <strong>Education</strong> Laws<br />
◗ STATE BOARD OF EDUCATION<br />
Formulation <strong>of</strong> Regulations for Implementing Laws<br />
◗ STATE SUPERINTENDENT OF EDUCATION<br />
Administration <strong>of</strong> the State <strong>Department</strong> <strong>of</strong> <strong>Education</strong> and Interpretation <strong>of</strong> Intent <strong>of</strong> Laws<br />
◗ STATE DEPARTMENT OF EDUCATION<br />
Enforcement <strong>of</strong> Laws and Regulations <strong>of</strong> <strong>Alabama</strong> Legislature and State Board <strong>of</strong> <strong>Education</strong><br />
◗ LOCAL BOARDS OF EDUCATION<br />
Administration <strong>of</strong> Programs within the Laws and Regulations Set Forth by <strong>Alabama</strong> Legislature and<br />
State Board <strong>of</strong> <strong>Education</strong><br />
◗ LOCAL SCHOOLS<br />
Implementation <strong>of</strong> School-Based <strong>Education</strong>al Programs As Set Forth by the <strong>Alabama</strong> Legislature and<br />
the State Board <strong>of</strong> <strong>Education</strong><br />
The <strong>Alabama</strong> constitution <strong>of</strong> 1901 states “The Legislature shall establish, organize, and<br />
maintain a liberal system <strong>of</strong> public schools throughout the state for the benefit <strong>of</strong> the children there<strong>of</strong><br />
between the ages <strong>of</strong> seven and twenty-one years.” Additionally, it states that “General supervision <strong>of</strong><br />
the public schools in <strong>Alabama</strong> shall be vested in a state board <strong>of</strong> education, which shall be elected in<br />
such a manner as the legislature may provide.”<br />
The state superintendent <strong>of</strong> education, who is appointed by the state board and serves at the<br />
board’s pleasure, is the chief state school <strong>of</strong>ficer. The state superintendent’s authority and duties are<br />
determined by the state board <strong>of</strong> education subject to regulations prescribed by the Legislature.<br />
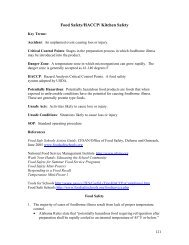
For delivery <strong>of</strong> educational services, <strong>Alabama</strong> is divided into 128 local school systems, or local<br />
boards <strong>of</strong> education. There are 67 county boards <strong>of</strong> education and 61 city boards <strong>of</strong> education.<br />
Mobile County is the largest system with approximately 65,000 pupils and Linden City is the smallest<br />
system with 650 pupils.<br />
Board members <strong>of</strong> all 67 county boards <strong>of</strong> education are elected. Eleven city boards <strong>of</strong><br />
education have legislation providing for elected board members and the remaining 50 city boards<br />
have their members appointed.<br />
Local superintendents <strong>of</strong> education for all city boards <strong>of</strong> education are appointed. Twentyseven<br />
county boards <strong>of</strong> education appoint the local superintendent <strong>of</strong> education. In the remaining<br />
40 county boards <strong>of</strong> education, the local superintendent is elected.<br />
4
Public <strong>Education</strong> in <strong>Alabama</strong><br />
SCHOOL SYSTEMS<br />
NUMBER OF<br />
SCHOOL SYSTEMS<br />
County 67<br />
City 61<br />
Total 128<br />
LAUDERDALE<br />
Lauderdale County<br />
Florence City<br />
COLBERT<br />
Colbert County<br />
Muscle Shoals City<br />
Sheffield City<br />
Tuscumbia City<br />
FRANKLIN<br />
Franklin County<br />
Russellville City<br />
LAWRENCE<br />
Lawrence County<br />
LIMESTONE<br />
Limestone County<br />
Athens City<br />
MORGAN<br />
Morgan County<br />
Decatur City<br />
Hartselle City<br />
MADISON<br />
Madison County<br />
Madison City<br />
Huntsville City<br />
MARSHALL<br />
Marshall County<br />
Arab City<br />
Guntersville City<br />
Albertville City<br />
JACKSON<br />
Jackson County<br />
Scottsboro City<br />
DEKALB<br />
Dekalb County<br />
Fort Payne City<br />
LAMAR<br />
Lamar<br />
County<br />
MARION<br />
Marion County<br />
Winfield City<br />
PICKENS<br />
Pickens County<br />
FAYETTE<br />
Fayette County<br />
WINSTON<br />
Winston County<br />
Haleyville City<br />
TUSCALOOSA<br />
Tuscaloosa County<br />
Tuscaloosa City<br />
WALKER<br />
Walker County<br />
Jasper City<br />
CULLMAN<br />
Cullman County<br />
Cullman City<br />
BLOUNT<br />
Blount County<br />
Oneonta City<br />
JEFFERSON<br />
Jefferson County<br />
Bessemer City<br />
Birmingham City<br />
Fairfield City<br />
Homewood City<br />
Hoover City<br />
Midfield City<br />
Mountain Brook City<br />
Tarrant City<br />
Vestavia Hills City<br />
SHELBY<br />
Shelby County<br />
ST. CLAIR<br />
St. Clair County<br />
Pell City City<br />
CHEROKEE<br />
ETOWAH Cherokee County<br />
Etowah County<br />
Attalla City<br />
Gadsden City<br />
CALHOUN<br />
Calhoun County<br />
Anniston City<br />
Jacksonville City<br />
Oxford City<br />
Piedmont City CLEBURNE<br />
Cleburne Couny<br />
TALLADEGA<br />
Talladega County<br />
Sylacauga City<br />
Talladega City<br />
CLAY<br />
Clay County<br />
RANDOLPH<br />
Randolph County<br />
Roanoke City<br />
SUMTER<br />
Sumter County<br />
GREENE<br />
Greene County<br />
HALE<br />
Hale County<br />
BIBB<br />
Bibb County<br />
PERRY<br />
Perry County<br />
CHILTON<br />
Chilton County<br />
AUTAUGA<br />
Autauga County<br />
COOSA<br />
Coosa County<br />
ELMORE<br />
Elmore County<br />
Tallassee City<br />
TALLAPOOSA CHAMBERS<br />
Tallapoosa County Chambers County<br />
Alexander City City Lanett City<br />
Tallassee City*<br />
LEE<br />
Lee County<br />
Auburn City<br />
Opelika City<br />
MARENGO<br />
Marengo County<br />
Demopolis City<br />
Linden City<br />
DALLAS<br />
Dallas County<br />
Selma City<br />
LOWNDES<br />
Lowndes County<br />
MONTGOMERY<br />
Montgomery County<br />
MACON<br />
Macon County<br />
BULLOCK<br />
Bullock County<br />
RUSSELL<br />
Russell County<br />
Phenix City City<br />
CHOCTAW<br />
Choctaw County<br />
WILCOX<br />
Wilcox County<br />
WASHINGTON<br />
Washington County<br />
CLARKE<br />
Clarke County<br />
Thomasville City<br />
MONROE<br />
Monroe County<br />
CONECUH<br />
Conecuh County<br />
ESCAMBIA<br />
Escambia County<br />
Brewton City<br />
BUTLER<br />
Butler County<br />
CRENSHAW<br />
Crenshaw County<br />
COVINGTON<br />
Covington County<br />
Andalusia City<br />
Opp City<br />
PIKE<br />
Pike County<br />
Troy City<br />
COFFEE<br />
C<strong>of</strong>fee County<br />
Elba City<br />
Enterprise City<br />
GENEVA<br />
Geneva County<br />
Geneva City<br />
DALE<br />
Dale County<br />
Daleville City<br />
Ozark City<br />
BARBOUR<br />
Barbour County<br />
Eufaula City<br />
HENRY<br />
Henry County<br />
HOUSTON<br />
Houston County<br />
Dothan City<br />
MOBILE<br />
Mobile County<br />
BALDWIN<br />
Baldwin County<br />
5
Public <strong>Education</strong> in <strong>Alabama</strong><br />
SCHOOL DATA 2000-<strong>2001</strong><br />
COUNTIES CITIES TOTAL<br />
STUDENT ENROLLMENT<br />
K 36,522 18,590 55,112<br />
Grade 1 39,940 19,725 59,665<br />
Grade 2 39,310 19,576 58,886<br />
Grade 3 39,467 19,795 59,262<br />
Grade 4 39,848 19,899 59,747<br />
Grade 5 40,428 19,692 60,120<br />
Grade 6 39,508 19,316 58,824<br />
Grade 7 39,701 19,438 59,139<br />
Grade 8 38,283 18,504 56,787<br />
Grade 9 39,770 20,481 60,251<br />
Grade 10 34,077 17,792 51,869<br />
Grade 11 30,330 16,021 46,351<br />
Grade 12 27,771 14,727 42,498<br />
TOTAL (K-12) 484,955 243,556 728,511<br />
HIGH SCHOOL GRADUATES<br />
• Male 11,762 6,303 18,065<br />
• Female 12,778 7,099 19,877<br />
• White 16,657 7,907 24,564<br />
• Non-White 7,883 5,495 13,378<br />
TOTAL 24,540 13,402 37,942<br />
NUMBER OF DROPOUTS GRADES 7-12<br />
• Male 3,882 1,361 5,243<br />
• Female 2,460 889 3,349<br />
• White 4,318 1,147 5,465<br />
• Non-White 2,024 1,103 3,127<br />
TOTAL 6,342 2,250 8,592<br />
COUNTIES CITIES TOTAL<br />
NON-CERTIFIED PERSONNEL<br />
Accounting 1,326.99 866.07 2,193.06<br />
Aides 5,079.75 2,586.58 7,666.33<br />
Clerical 369.35 304.03 673.38<br />
Custodial 3,199.82 1,959.06 5,158.88<br />
Data Processing 595.34 162.02 757.37<br />
Lunchroom 3,240.45 1,422.15 4,662.59<br />
Secretary 1,218.45 951.97 2,170.42<br />
Maintenance 2,052.74 1,328.55 3,381.29<br />
Bus Drivers 5,928.04 1,200.85 7,128.89<br />
Other Transportation 35.31 17.25 52.56<br />
Employees<br />
Support Services 225.50 97.24 322.74<br />
Other 330.73 164.94 495.67<br />
TOTAL 23,602.46 11,060.71 34,663.17<br />
CERTIFIED PERSONNEL<br />
Supervisor 319.07 155.89 474.96<br />
Assistant Principal 596.41 326.75 923.16<br />
Psychometrist 125.07 50.74 175.81<br />
Librarian 837.44 473.87 1,311.31<br />
Other 64.16 28.52 92.68<br />
OTHER CERTIFIED PERSONNEL<br />
Superintendent 66.00 58.40 124.40<br />
Assistant Superintendent 45.39 31.82 77.21<br />
Administrative Assistant 34.18 20.67 54.85<br />
Test Evaluator 11.12 1.00 12.12<br />
Counselor 1,090.05 589.41 1,679.46<br />
Coordinator 210.99 124.06 335.05<br />
TOTAL 3,399.88 1,861.13 5,261.01<br />
PRINCIPALS FTE 901.02 483.64 1,384.66<br />
SSN 930 502 1,432<br />
ASST. PRINCIPALS FTE 596.41 326.75 923.16<br />
SSN 670 364 1,034<br />
TEACHERS FTE 31,446.74 16,487.09 47,933.83<br />
SSN 34,194 17,574 51,768<br />
FTE AND AVERAGE SALARY BY CERTIFICATE OF CERTIFIED PRINCIPALS<br />
FULL TIME EQUIVALENTS<br />
AVERAGE SALARY<br />
SYSTEM DR 6 YR MS BS ND TOTAL DR 6 YR MS BS ND<br />
County Total 47.50 370.46 481.06 2.00 - 901.02 67,523.45 63,388.57 58,514.52 51.369.52 -<br />
City Total 56.88 208.90 214.86 3.00 - 483.64 72,902.03 66,351.55 62,927.09 58,453.55 -<br />
State Total 104.38 579.36 695.92 5.00 - 1,384.66 70,454.41 64,456.93 59,876.87 55,620.05 -<br />
FTE AND AVERAGE SALARY BY CERTIFICATE OF CERTIFIED TEACHERS<br />
FULL TIME EQUIVALENTS<br />
AVERAGE SALARY<br />
SYSTEM DR 6 YR MS BS ND TOTAL DR 6 YR MS BS ND<br />
County Total 110.00 1,379.14 15,586.21 14,418.14 95.50 31,588.99 46,944.74 44,704.14 39,484.56 32,447.46 36,329.82<br />
City Total 76.97 768.17 8,344.59 7,297.54 75.00 16,562.26 48,710.50 46,209.61 41,117.97 33,907.93 37,517.72<br />
State Total 186.97 2,147.31 23,930.80 21,715.68 170.50 48,151.26 47,671.65 45,242.70 40,054.12 32,938.25 36,852.35<br />
6
Public <strong>Education</strong> in <strong>Alabama</strong><br />
ACCOUNTABILITY<br />
As cited in Section 16-16B-5, Code <strong>of</strong> <strong>Alabama</strong><br />
“In addition to providing quality instruction in classrooms<br />
and fiscal soundness, all local boards <strong>of</strong> education shall be<br />
accountable for compliance with statutes and regulations<br />
regarding school safety and discipline.”<br />
The <strong>Alabama</strong> legislature found that the people <strong>of</strong> <strong>Alabama</strong> desired two basic things from their<br />
public schools…(1) high achievement for students and (2) a safe and orderly environment in which to<br />
learn. With the passage <strong>of</strong> the <strong>Education</strong> Accountability Plan, (codified in sections 16-6B-1 through<br />
16-6B-12) and beginning with the 1995-96 school year, all schools in <strong>Alabama</strong> have been required to<br />
be accountable for student achievement, fiscal responsibility, school safety and discipline.<br />
With the encouragement <strong>of</strong> the State Legislature, the State Board <strong>of</strong> <strong>Education</strong> has assisted<br />
local boards <strong>of</strong> education in the development <strong>of</strong> a strong disciplinary policy which directs the State<br />
Board <strong>of</strong> <strong>Education</strong> to closely monitor student achievement. Using nationally normed tests to assist<br />
with student assessment and evaluation, a determination is made each school year as to which<br />
schools and/or systems are listed as “alert” status and need assistance for the State <strong>Department</strong> <strong>of</strong><br />
<strong>Education</strong>. Designated teams visit those schools listed in Alert status and conduct studies and consultations<br />
with parents and students to determine the causes <strong>of</strong> poor student achievement. Specific<br />
recommendations are then made as a part <strong>of</strong> the improvement plan for the succeeding school year.<br />
As a final step, when insufficient improvement is made after assistance is given, the State<br />
Superintendent <strong>of</strong> <strong>Education</strong> is required to intervene and appoint a person or team <strong>of</strong> persons to run<br />
the day-to-day operations <strong>of</strong> that school.<br />
Relative to the fiscal accountability, local boards <strong>of</strong> education are now required to provide<br />
annual financial documents, including but not limited to annual budgets and financial statements.<br />
The State Board <strong>of</strong> <strong>Education</strong> is directed to approve and audit budgets to assess the financial stability<br />
<strong>of</strong> each local board <strong>of</strong> education. Assistance is provided by person(s) appointed by the State<br />
<strong>Department</strong> <strong>of</strong> <strong>Education</strong> to advise such agencies on a day-by-day basis if an unsound fiscal position<br />
is determined.<br />
Each local board <strong>of</strong> education is required to comply with certain statutes enacted by the<br />
<strong>Alabama</strong> Legislature pertaining to school safety and discipline. If it is determined that any local<br />
agency has failed to comply with any <strong>of</strong> these acts or regulations, the State <strong>Department</strong> <strong>of</strong> <strong>Education</strong><br />
will provide assistance to obtain compliance. If after one year, the local agency has not come into<br />
compliance the direct management and day-to-day operation <strong>of</strong> that board <strong>of</strong> education will be<br />
assumed by the State <strong>Department</strong> <strong>of</strong> <strong>Education</strong> until compliance is reached.<br />
7
Public <strong>Education</strong> in <strong>Alabama</strong><br />
STANDARD ACHIEVEMENT TESTS<br />
• <strong>2001</strong> STANFORD NINE SCORES SHOW INTERVENTION WORKS •<br />
• ALL 2000 ALERT 3 SCHOOL MAKE SUBSTANTIAL IMPROVEMENTS •<br />
• Students Score At Or Above The National Average For Second Year •<br />
Months <strong>of</strong> hard work by students, teachers, and administrators has paid <strong>of</strong>f for all six <strong>Alabama</strong><br />
public schools under Academic Intervention status last year. Based on results from the <strong>2001</strong> Stanford<br />
Achievement Test, Ninth <strong>Education</strong> (Stanford 9) released today by the state Board <strong>of</strong> <strong>Education</strong>, the<br />
six schools have earned a rating <strong>of</strong> either Academic Clear or Caution.<br />
Four <strong>of</strong> the schools, Cobb Elementary (Anniston City); Litchfield High School (Gadsden City);<br />
Lowndes County Middle School<br />
“<strong>Alabama</strong> has been recognized for<br />
having one <strong>of</strong> the toughest<br />
accountability systems in the country.”<br />
Governor Don Siegleman<br />
(Lowndes County); and Russell<br />
County High School (Russell<br />
County) moved from Academic<br />
Alert 3 to Academic Clear. Two<br />
schools rose to Academic Caution<br />
from Alert 3. They are Jess Lanier High School (Bessemer City), and Cloverdale Junior High School<br />
(Montgomery County). All schools, with the exception <strong>of</strong> Litchfield High, are being removed from<br />
state intervention after only one year.<br />
In <strong>2001</strong>, the percentage <strong>of</strong> Academic Clear schools and school systems increased while the percentage<br />
<strong>of</strong> Academic Alert and Caution schools and school systems decreased.<br />
The Stanford 9 was administered to 473,142 <strong>Alabama</strong> public school students in Grades 3-11. For<br />
the second year in a row, total scores for all nine grades tested, including special education students,<br />
were at or above the national average <strong>of</strong> 50. In addition, average percentiles across Grades 3-11,<br />
including special education<br />
students, are above the<br />
How Are Our Schools Doing<br />
national average in all subjects<br />
YEAR ALERT<br />
Schools Systems<br />
CAUTION<br />
Schools System<br />
CLEAR<br />
Schools Systems except reading, which is<br />
at the 49th percentile. The<br />
1996*<br />
1997<br />
1998<br />
1999<br />
24<br />
97<br />
111<br />
91<br />
0<br />
3<br />
7<br />
5<br />
280<br />
135<br />
110<br />
88<br />
23<br />
9<br />
6<br />
3<br />
945<br />
1032<br />
1047<br />
1095<br />
74<br />
115<br />
114<br />
120<br />
state’s average percentile<br />
scores are three to four points<br />
higher in subjects when special<br />
education students’<br />
scores are excluded.<br />
2000 68 4 82 5 1122 119<br />
<strong>2001</strong> 58 3 68 1 1156 123<br />
• Only systems meeting the 1996 definition <strong>of</strong> Alert, Caution, or Clear received a 1996 status.<br />
June 28, <strong>2001</strong><br />
State <strong>Department</strong> <strong>of</strong> <strong>Education</strong> Press Release<br />
8
P<br />
e<br />
r<br />
c<br />
e<br />
n<br />
t<br />
i<br />
l<br />
e<br />
s<br />
99<br />
90<br />
80<br />
70<br />
60<br />
50<br />
40<br />
30<br />
20<br />
10<br />
1<br />
55<br />
58 56<br />
<strong>Alabama</strong> State Summary<br />
Total Battery Scores<br />
Spring <strong>2001</strong><br />
59<br />
56 56<br />
3 4 5 6 7 8 9 10 11<br />
Grades<br />
52 50 53<br />
Includes all students (regular and special education) tested.<br />
National<br />
Average<br />
50<br />
“We are all very pleased<br />
with the results <strong>of</strong> those<br />
schools that worked so<br />
hard to move out <strong>of</strong><br />
Alert 3. I am very<br />
proud <strong>of</strong> the students,<br />
teachers, parents, and<br />
the specialists brought<br />
in by the state<br />
<strong>Department</strong> <strong>of</strong><br />
<strong>Education</strong> who made<br />
this work.”<br />
Ed Richardson<br />
Superintendent <strong>of</strong><br />
<strong>Education</strong><br />
“We are all very proud <strong>of</strong> the effort <strong>of</strong> our students, teachers, and administrators and everyone<br />
knows we still have much work to do, especially in the area <strong>of</strong> reading. I am confident programs<br />
like the <strong>Alabama</strong> Reading Initiative, will begin to show a positive impact in the years to come.”<br />
Ethel Hall, Vice President, State Board <strong>of</strong> <strong>Education</strong><br />
P<br />
e<br />
r<br />
c<br />
e<br />
n<br />
t<br />
i<br />
l<br />
e<br />
s<br />
99<br />
90<br />
80<br />
70<br />
60<br />
50<br />
40<br />
30<br />
20<br />
10<br />
1<br />
49<br />
<strong>Alabama</strong> State Summary<br />
Average Percentile Across Grades 3-11<br />
Spring <strong>2001</strong><br />
56 58 56 54 55<br />
Reading Mathematics Language Science Social<br />
Science<br />
Subject and Battery Scores<br />
Total<br />
Battery<br />
National<br />
Average<br />
50<br />
Includes all students (regular and special education) tested.<br />
9
Public <strong>Education</strong> in <strong>Alabama</strong><br />
REPORT CARD 2000-<strong>2001</strong><br />
<strong>Alabama</strong> students in grades 3-11 are given the Stanford Achievement Test each year to measure their academic performance. The charts below show student<br />
academic performance throughout the state over the past five years. The national average for the Stanford Achievement Test, 9th Edition, is 50.<br />
1996-1997 1997-1998 1998-1999 1999-2000 2000-<strong>2001</strong><br />
Group Score Grade Score Grade Score Grade Score Grade Score Grade<br />
Grade 3 55 B- 54 B– 55 B– 55 B– 55 B–<br />
Grade 4 58 B 58 B 58 B 59 B 58 B<br />
Grade 5 57 B– 57 B– 57 B– 57 B– 56 B-<br />
Grade 6 61 B 59 B 60 B 61 B 59 B<br />
Grade 7 57 B– 56 B– 56 B– 57 B– 56 B-<br />
Grade 8 58 B 56 B– 56 B– 57 B– 56 B-<br />
Grade 9 56 B– 50 C+ 51 C+ 53 C+ 52 C+<br />
Grade 10 51 C+ 49 C+ 49 C+ 50 C+ 50 C+<br />
Grade 11 52 C+ 52 C+ 53 C+ 53 C+ 53 C+<br />
Student Avg. 56 B– 55 B– 55 B– 56 B– 55 B-<br />
The achievement/ability comparison shows the relationship between students’ scores on the Stanford Achievement Test and the scores <strong>of</strong> other students <strong>of</strong> similar<br />
ability. The number in the chart below is the state’s numeric average. The letter grade indicates the achievement/ability comparison score.<br />
1996-1997 1997-1998 1998-1999 1999-2000 2000-<strong>2001</strong><br />
Score Grade Score Grade Score Grade Score Grade Score Grade<br />
Achievement<br />
/Ability 5.3 B 5.2 B– 5.2 B– 5.2 B– 5.2 B-<br />
Writing Performance<br />
Students in the fifth and seventh grades are given tests to measure their<br />
writing skills. This chart shows the combined performance <strong>of</strong> students<br />
throughout the state.<br />
*Does not include special education<br />
1999-2000* 2000-<strong>2001</strong><br />
Level Level Score Level Score<br />
Grade 5 5.02 B 4.54 C+<br />
Grade 7 5.04 B 4.94 B-<br />
ACT Testing<br />
Most students planning to attend college take at least one <strong>of</strong> several college entrance exams. One <strong>of</strong> the best known<br />
is the ACT. This chart shows the highest average ACT score for the senior class and how it compares to the national<br />
average.<br />
1996-1997 1997-1998 1998-1999 1999-2000 2000-<strong>2001</strong><br />
Group Score Grade Score Grade Score Grade Score Grade Score Grade<br />
State 20.1 C 20.2 C 20.2 C 20.2 C 20.3 C<br />
Nation 20.8 N/A 21.0 N/A 21.0 N/A 21.0 N/A 21.0 N/A<br />
Dropout Rate<br />
This number represents the percent <strong>of</strong> students in 9th grade in 2000 who are<br />
projected to leave school prior to graduation in 2003. The grade compares the<br />
state to the national average.<br />
Rate<br />
Nation<br />
Dropout Rate 16.48 C+<br />
10
Academic Status<br />
Based on Stanford Achievement Test results, each school and school system is given an academic status:<br />
• Clear status indicates the school or system is meeting state academic requirements.<br />
• Caution means the school or system needs academic improvement.<br />
• Alert 1 or 2 requires that the state <strong>Department</strong> <strong>of</strong> <strong>Education</strong> work with the system personnel to bring test scores up to standards.<br />
• Alert 3 indicates the state <strong>Department</strong> <strong>of</strong> <strong>Education</strong> is intervening in the daily operation <strong>of</strong> the school or system in an attempt to improve academic status.<br />
Schools<br />
School Systems<br />
Alert 3: 0.5%<br />
Alert 2: 1.3%<br />
Alert 1: 2.7%<br />
Caution: 5.3%<br />
Alert 3: 0.0%<br />
Alert 2: 1.5%<br />
Alert 1: 0.8%<br />
Caution: 0.8%<br />
Clear: 90.2% Clear: 96.9%<br />
Graduation Exam<br />
<strong>Alabama</strong> has the toughest graduation<br />
requirements in the United States.<br />
High school students must earn at least<br />
24 credits, including four years <strong>of</strong> math,<br />
science, English, and social studies.<br />
Students must also pass an exam to earn<br />
a regular diploma. This chart shows the<br />
percentage <strong>of</strong> 12th graders passing the<br />
exam.<br />
2000-<strong>2001</strong><br />
Subtest Score Grade<br />
Reading 97% A<br />
Language 96% A<br />
Remediation<br />
Indicates the percentage <strong>of</strong> incoming<br />
freshmen from <strong>Alabama</strong>’s public<br />
schools enrolled in remediation courses<br />
at <strong>Alabama</strong>’s public colleges and<br />
universities.<br />
2000-<strong>2001</strong><br />
Course<br />
Grade<br />
Math 12.5%<br />
English 7%<br />
Math & English 10.8%<br />
Safety & Discipline<br />
The following chart shows the types <strong>of</strong><br />
discipline problems that have occurred<br />
statewide and what actions were taken<br />
in 2000-<strong>2001</strong>.<br />
Number <strong>of</strong><br />
Action Taken<br />
Type <strong>of</strong> Incidents Sent to<br />
Incident <strong>Report</strong>ed Suspension Expulsion Alternative School<br />
Assault 3040 2433 39 220<br />
Bomb Threat 68 45 10 24<br />
Drug Related 1308 1080 178 473<br />
Weapons Related 1530 1267 103 266<br />
Portables in the State <strong>of</strong> <strong>Alabama</strong><br />
Number <strong>of</strong> Portables Used as Classrooms as <strong>of</strong> March 1999 3,328<br />
Number <strong>of</strong> Portables Used as Classrooms as <strong>of</strong> September 2000 2,527<br />
Projected Number <strong>of</strong> Portables Used as Classrooms as <strong>of</strong> September <strong>2001</strong> 1,542<br />
11
Public <strong>Education</strong> in <strong>Alabama</strong><br />
SCHOOLS ON ALERT<br />
ALERT 1<br />
CHAMBERS COUNTY<br />
Lafayette Eastside Elementary<br />
SUMTER COUNTY<br />
Livingston High<br />
CLARKE COUNTY<br />
C<strong>of</strong>feeville High<br />
DALLAS COUNTY<br />
Southside Elementary<br />
ESCAMBIA COUNTY<br />
Escambia County High<br />
HALE COUNTY<br />
Greensboro Public East<br />
MOBILE COUNTY<br />
Mattie T. Blount High<br />
Calloway Smith Middle<br />
Citronelle High<br />
Howard Elementary<br />
Mobile County Training Middle<br />
CF Vigor High<br />
Woodcock Elementary<br />
MONTGOMERY COUNTY<br />
Bellingrath Junior High<br />
Floyd Elementary<br />
Jefferson Davis High<br />
McIntyre Middle<br />
Montgomery County High<br />
Paterson Elementary<br />
PERRY COUNTY<br />
Marion High<br />
TALLADEGA COUNTY<br />
Talladega County Central High<br />
Stemley Road Elementary<br />
TUSCALOOSA COUNTY<br />
Holt Elementary<br />
WILCOX COUNTY<br />
Camden School <strong>of</strong> Arts & Technology<br />
ANNISTON CITY<br />
Anniston High<br />
BIRMINGHAM CITY<br />
Barrett Elementary<br />
Hayes Middle<br />
Huffman High-Magnet<br />
Woodlawn High-Magnet<br />
FAIRFIELD CITY<br />
Donald Elementary<br />
HUNTSVILLE CITY<br />
JO Johnson High<br />
West Mastin Lake Elementary<br />
TUSCALOOSA CITY<br />
Stillman Heights Elementary<br />
Westlawn Middle<br />
12
Public <strong>Education</strong> in <strong>Alabama</strong><br />
Schools on Alert 2<br />
ALERT 2<br />
BARBOUR COUNTY<br />
Barbour County High<br />
CHAMBERS COUNTY<br />
Lafayette High<br />
CHOCTAW COUNTY<br />
Choctaw County High<br />
JEFFERSON COUNTY<br />
Brighton Middle<br />
LEE COUNTY<br />
Loachapoka High<br />
MOBILE COUNTY<br />
Lillie B. Williamson High<br />
SCHOOLS ON ALERT<br />
ALERT 3<br />
BARBOUR COUNTY<br />
Clayton Elementary<br />
MOBILE COUNTY<br />
Booker T. Washington Middle<br />
Grant Elementary<br />
Mae Eanes Middle<br />
MONTGOMERY COUNTY<br />
Dunbar Elementary<br />
RUSSELL COUNTY<br />
Russell Elementary<br />
SUMTER COUNTY<br />
Livingston Junior<br />
MONTGOMERY COUNTY<br />
Carver Senior High<br />
Chisholm Elementary<br />
Fews Elementary<br />
Martin Luther King Elementary<br />
Lanier Senior High<br />
Southlawn Middle<br />
PICKENS COUNTY<br />
Carrollton High<br />
BIRMINGHAM CITY<br />
Jackson-Olin High<br />
HUNTSVILLE CITY<br />
Rolling Hills Elementary<br />
SELMA CITY<br />
Selma High<br />
SYSTEMS ON ALERT<br />
SYSTEM STATUS <strong>2001</strong> STATUS 2000 COMMENT<br />
SUMTER COUNTY ALERT I CAUTION Failed in Caution Improvement<br />
BARBOUR COUNTY ALERT 2 ALERT 1 Insufficient Improvement<br />
BULLOCK COUNTY ALERT 2 ALERT 1 Insufficient Improvement<br />
13
Pupil Data<br />
AVERAGE DAILY MEMBERSHIP (ADM)<br />
Sys System Name GRK GR1 GR2 GR3 GR4 GR5<br />
001 Autauga County 592.08 723.20 718.55 694.05 729.15 690.20<br />
002 Baldwin County 1,593.63 1,788.05 1,757.20 1,803.75 1,848.08 1,881.03<br />
003 Barbour County 148.83 119.10 149.13 133.28 128.03 135.43<br />
004 Bibb County 299.25 418.63 306.28 276.43 303.05 275.38<br />
005 Blount County 608.28 675.83 600.63 602.63 587.35 596.83<br />
006 Bullock County 137.63 171.50 152.15 172.60 162.55 163.05<br />
007 Butler County 253.30 250.23 254.38 278.58 306.15 293.63<br />
008 Calhoun County 711.58 833.25 751.65 775.83 815.35 799.25<br />
009 Chambers County 409.75 385.08 332.48 363.05 349.23 339.05<br />
010 Cherokee County 342.35 304.35 327.80 326.23 298.90 310.78<br />
011 Chilton County 542.73 574.50 583.83 523.50 562.80 594.00<br />
012 Choctaw County 156.03 175.78 207.73 170.48 195.20 158.38<br />
013 Clarke County 280.84 337.75 293.82 318.43 288.05 280.93<br />
014 Clay County 155.90 207.40 207.13 173.33 178.70 169.33<br />
015 Cleburne County 193.15 220.60 203.78 206.85 232.98 208.40<br />
016 C<strong>of</strong>fee County 126.70 225.18 134.10 165.98 137.80 170.75<br />
017 Colbert County 266.65 274.60 264.40 283.20 295.88 304.45<br />
018 Conecuh County 182.00 198.98 160.58 190.65 185.18 173.93<br />
019 Coosa County 133.23 127.93 125.15 154.98 138.83 165.33<br />
020 Covington County 221.38 239.20 275.98 242.93 258.78 275.40<br />
021 Crenshaw County 189.48 187.63 177.23 211.25 180.23 212.38<br />
022 Cullman County 777.23 759.55 805.55 786.23 742.98 768.15<br />
023 Dale County 190.20 213.38 198.70 186.85 229.93 206.23<br />
024 Dallas County 348.38 373.65 367.55 381.98 372.03 396.58<br />
025 DeKalb County 741.98 644.25 659.28 669.40 677.35 651.93<br />
026 Elmore County 786.93 1,226.28 836.28 808.33 841.25 839.15<br />
027 Escambia County 384.48 418.50 416.80 407.58 424.38 396.53<br />
028 Etowah County 721.58 690.50 687.60 673.60 681.05 692.63<br />
029 Fayette County 219.88 221.45 214.40 231.85 208.43 226.35<br />
030 Franklin County 261.08 273.63 264.45 261.08 258.30 246.65<br />
031 Geneva County 181.98 251.95 237.53 240.35 232.08 231.50<br />
032 Greene County 111.98 150.80 145.18 149.00 153.20 164.73<br />
033 Hale County 242.23 300.53 279.45 243.60 289.35 240.85<br />
034 Henry County 182.68 243.85 246.30 232.80 207.23 214.13<br />
035 Houston County 429.93 459.58 489.58 480.00 476.38 537.65<br />
036 Jackson County 493.10 531.68 509.93 502.18 548.38 475.18<br />
037 Jefferson County 2,581.98 2,988.63 3,073.75 3,082.73 3,169.10 3,368.08<br />
038 Lamar County 197.80 208.83 200.18 203.78 205.25 233.73<br />
039 Lauderdale County 745.43 669.33 688.35 670.53 722.35 708.65<br />
040 Lawrence County 434.25 525.85 475.28 485.73 488.83 559.40<br />
041 Lee County 690.28 729.60 763.18 731.15 748.15 845.20<br />
042 Limestone County 609.73 691.30 626.65 629.40 671.65 701.65<br />
043 Lowndes County 178.13 242.63 183.20 194.98 221.00 233.83<br />
044 Macon County 274.95 381.93 330.73 355.80 313.65 350.83<br />
045 Madison County 1,137.23 1,370.73 1,242.55 1,227.18 1,299.15 1,349.90<br />
046 Marengo County 131.40 159.15 150.08 157.43 162.60 124.40<br />
047 Marion County 298.20 312.58 297.95 330.18 296.08 342.75<br />
048 Marshall County 586.30 636.83 587.00 617.95 635.93 589.18<br />
049 Mobile County 4,660.25 6,344.23 5,470.40 5,470.73 5,242.00 5,254.43<br />
050 Monroe County 339.53 386.75 341.33 356.33 388.95 344.25<br />
051 Montgomery County 2,478.30 2,943.35 2,804.25 2,787.18 2,847.03 2,894.08<br />
052 Morgan County 546.38 616.98 550.83 611.30 593.40 602.78<br />
053 Perry County 172.40 217.25 180.43 168.43 167.03 189.95<br />
054 Pickens County 270.23 294.18 273.98 292.28 315.83 284.55<br />
055 Pike County 153.28 190.55 177.80 160.35 164.00 212.95<br />
056 Randolph County 154.30 180.25 171.83 177.30 186.25 183.78<br />
057 Russell County 280.68 317.95 323.25 348.30 330.95 331.45<br />
058 St Clair County 521.38 565.13 523.08 573.83 588.85 647.48<br />
059 Shelby County 1,605.60 1,781.93 1,603.15 1,627.98 1,670.60 1,666.30<br />
060 Sumter County 201.00 217.33 246.50 241.05 220.10 244.48<br />
061 Talladega County 565.50 597.20 646.63 615.53 641.73 682.33<br />
062 Tallapoosa County 245.75 286.53 290.70 275.33 305.90 306.55<br />
063 Tuscaloosa County 1,215.43 1,386.58 1,273.03 1,292.78 1,261.55 1,274.48<br />
064 Walker County 761.13 717.45 675.15 688.48 733.50 680.70<br />
065 Washington County 272.80 307.45 292.78 286.03 297.08 274.50<br />
066 Wilcox County 173.75 193.35 204.03 218.93 192.98 211.45<br />
14
GR6 GR7 GR8 GR9 GR10 GR11 GR12 TOTAL<br />
729.60 720.70 708.50 716.58 593.63 511.50 475.55 8,603.30<br />
1,800.00 1,865.43 1,829.28 2,054.25 1,713.58 1,480.40 1,183.75 22,598.51<br />
136.33 108.55 115.88 144.10 122.85 83.03 78.75 1,603.26<br />
277.98 328.18 270.88 314.25 191.63 181.28 173.00 3,616.19<br />
587.80 618.35 585.10 559.25 468.15 428.80 364.03 7,283.02<br />
166.40 184.98 137.08 198.03 119.20 116.85 94.33 1,976.33<br />
313.75 291.08 278.18 322.75 270.13 248.70 260.70 3,621.54<br />
785.18 769.28 789.10 788.63 631.85 595.08 549.65 9,595.69<br />
370.18 327.38 322.28 364.88 272.40 247.53 229.10 4,312.37<br />
327.60 329.85 299.38 324.80 261.63 226.80 241.43 3,921.88<br />
534.85 563.53 544.25 560.38 429.80 423.80 366.98 6,804.95<br />
197.10 176.75 175.03 192.30 163.63 149.73 146.08 2,264.19<br />
257.23 279.43 267.18 310.73 242.33 211.98 217.00 3,585.67<br />
191.90 199.00 198.53 208.68 195.43 170.70 163.20 2,419.22<br />
220.35 188.00 193.75 209.80 185.13 144.58 145.10 2,552.48<br />
147.08 195.83 151.20 155.55 139.63 124.75 102.18 1,976.71<br />
265.23 276.83 277.70 260.03 207.65 178.80 181.28 3,336.70<br />
174.70 163.88 158.55 163.38 153.88 87.05 114.20 2,106.95<br />
150.35 155.78 118.98 156.28 111.70 96.40 95.15 1,730.07<br />
305.45 269.75 276.58 266.33 268.38 198.00 178.60 3,276.75<br />
191.10 183.30 196.13 200.23 166.15 165.40 140.35 2,400.84<br />
739.45 772.38 725.68 800.70 715.45 588.60 547.48 9,529.47<br />
221.93 235.55 211.78 234.95 210.58 188.90 168.13 2,697.09<br />
378.85 421.95 378.80 422.40 350.58 340.35 264.28 4,797.38<br />
619.50 603.23 570.70 552.65 485.73 495.35 412.53 7,783.89<br />
811.13 796.98 777.95 894.75 711.98 620.63 521.18 10,472.81<br />
362.63 382.75 365.63 395.05 313.93 292.35 261.70 4,822.30<br />
710.53 660.95 640.98 589.98 619.48 544.65 552.83 8,466.38<br />
211.53 237.28 215.88 211.80 201.75 188.18 182.50 2,771.27<br />
258.38 249.35 259.98 231.20 213.35 188.28 188.83 3,154.55<br />
213.98 223.43 224.88 230.33 188.55 166.98 163.98 2,787.49<br />
123.53 174.08 141.35 127.85 96.55 122.38 89.48 1,750.08<br />
253.15 257.88 270.35 289.63 258.25 233.80 187.28 3,346.34<br />
218.80 210.40 211.53 267.78 221.30 175.65 163.83 2,796.26<br />
522.15 554.23 539.25 540.73 428.85 376.53 320.25 6,155.09<br />
509.53 479.93 487.20 530.38 413.28 404.53 347.30 6,232.61<br />
3,318.30 3,439.18 3,319.45 3,436.65 3,346.20 2,871.38 2,867.90 40,863.47<br />
210.33 253.83 182.10 216.65 215.00 184.70 180.00 2,692.16<br />
730.88 727.53 671.15 665.98 614.40 594.73 506.65 8,715.96<br />
501.70 475.80 522.55 514.68 428.80 369.03 388.88 6,170.79<br />
691.30 707.85 720.30 812.50 625.40 535.30 464.08 9,064.31<br />
664.20 649.18 652.70 567.15 527.45 501.10 424.60 7,916.78<br />
209.13 226.15 225.28 245.95 200.60 184.70 110.48 2,656.05<br />
336.65 269.33 330.45 349.18 271.80 168.63 201.15 3,935.07<br />
1,335.30 1,255.38 1,196.93 1,359.03 1,096.75 947.83 902.75 15,720.73<br />
138.55 149.73 135.93 125.75 92.10 121.13 110.60 1,758.83<br />
293.88 308.20 314.43 330.85 257.38 234.10 222.05 3,838.63<br />
567.63 569.98 574.73 501.75 398.25 354.15 346.45 6,966.14<br />
5,133.13 5,132.90 5,088.90 5,617.68 4,504.20 3,947.73 3,841.38 65,708.17<br />
306.13 350.33 349.10 374.70 329.40 270.98 313.03 4,450.81<br />
2,818.43 2,835.65 2,593.00 2,244.68 2,127.65 2,167.63 1,749.08 33,290.43<br />
654.25 626.75 603.55 597.85 510.20 496.98 411.13 7,422.39<br />
188.03 218.98 171.55 183.78 161.05 150.00 124.93 2,293.79<br />
289.83 321.30 285.05 245.65 298.00 302.43 231.18 3,704.46<br />
197.33 207.38 155.35 189.30 171.68 130.95 115.35 2,226.26<br />
179.70 217.28 207.98 167.18 160.83 137.50 125.68 2,249.84<br />
350.25 319.20 296.98 383.33 247.40 181.05 157.10 3,867.91<br />
591.83 550.08 604.18 655.38 481.18 404.43 354.93 7,061.74<br />
1,661.35 1,578.65 1,580.80 1,568.83 1,460.65 1,309.68 1,127.68 20,243.25<br />
218.15 212.33 182.98 230.50 218.55 172.23 180.20 2,785.39<br />
676.25 657.25 620.20 646.55 568.93 458.60 491.10 7,867.83<br />
259.08 280.13 261.08 235.78 237.00 218.83 169.48 3,372.11<br />
1,265.80 1,320.35 1,168.50 1,285.45 1,176.23 970.20 891.25 15,781.67<br />
660.48 691.53 647.65 638.28 499.60 463.83 444.95 8,302.73<br />
278.98 267.55 275.15 301.90 252.45 256.78 233.45 3,596.90<br />
210.75 175.03 192.73 207.93 197.63 172.90 162.48 2,513.92<br />
15
Pupil Data<br />
AVERAGE DAILY MEMBERSHIP (ADM)<br />
Sys System Name GRK GR1 GR2 GR3 GR4 GR5<br />
067 Winston County 236.88 226.10 197.15 225.43 232.08 211.60<br />
101 Albertville City 399.98 362.05 295.00 295.85 296.38 257.58<br />
102 Alexander City 299.35 288.13 274.70 300.25 279.68 288.40<br />
104 Andalusia City 138.18 133.43 127.00 144.53 144.78 140.90<br />
105 Anniston City 261.73 322.25 278.38 247.95 254.48 246.38<br />
106 Arab City 188.15 188.13 173.33 172.58 179.93 183.60<br />
107 Athens City 225.83 197.58 224.30 239.13 243.58 239.80<br />
109 Attalla City 117.45 238.15 108.25 103.45 108.30 126.98<br />
110 Auburn City 317.55 367.65 367.25 340.55 343.85 379.45<br />
113 Bessemer City 334.33 403.23 434.75 405.48 409.43 403.28<br />
114 Birmingham City 2,737.40 3,486.00 3,270.83 3,362.38 3,207.05 2,989.23<br />
116 Brewton City 99.70 103.70 124.55 101.85 103.10 124.13<br />
125 Cullman City 212.40 207.53 206.60 196.15 157.23 207.35<br />
126 Daleville City 90.85 114.18 102.45 113.95 99.98 108.68<br />
127 Decatur City 687.55 734.25 717.93 740.68 762.13 718.95<br />
128 Demopolis City 179.08 226.23 205.15 204.93 197.33 206.73<br />
130 Dothan City 628.38 797.00 688.50 649.03 717.83 639.75<br />
131 Elba City 65.85 82.18 87.70 79.90 89.55 85.80<br />
132 Enterprise City 307.98 329.95 367.15 393.43 388.15 370.53<br />
133 Eufaula City 194.00 246.90 232.48 256.30 238.48 250.78<br />
137 Fairfield City 153.83 183.98 174.60 203.70 187.55 196.58<br />
141 Florence City 313.55 354.23 318.13 305.40 320.45 327.70<br />
143 Fort Payne City 240.00 234.33 209.85 180.48 225.45 207.95<br />
144 Gadsden City 483.68 549.83 467.70 457.93 479.30 450.78<br />
146 Geneva City 86.75 104.65 93.23 102.58 106.15 111.78<br />
154 Guntersville City 148.58 140.30 150.28 150.15 143.33 146.55<br />
155 Haleyville City 135.65 144.18 127.53 136.85 133.48 129.80<br />
156 Hartselle City 247.35 218.80 227.70 241.35 224.60 248.63<br />
157 Homewood City 238.10 240.80 242.58 249.70 234.43 253.33<br />
158 Hoover City 787.15 715.38 754.18 772.78 730.78 842.80<br />
159 Huntsville City 1,636.73 1,746.38 1,805.70 1,897.68 1,941.93 1,912.38<br />
162 Jacksonville City 109.03 128.18 156.33 136.18 145.13 123.53<br />
163 Jasper City 221.03 199.85 178.00 182.65 209.25 192.93<br />
165 Lanett City 103.03 99.28 99.03 86.58 114.33 103.18<br />
168 Linden City 37.00 49.00 59.00 46.85 72.78 46.93<br />
169 Madison City 389.63 539.45 442.88 462.43 508.83 478.55<br />
171 Midfield City 60.78 81.93 82.10 77.90 104.20 106.45<br />
175 Mountain Brook City 302.60 295.35 326.00 278.70 343.03 323.90<br />
176 Muscle Shoals City 210.13 233.28 133.65 176.93 195.43 216.73<br />
178 Oneonta City 113.38 100.35 78.20 95.60 105.30 81.95<br />
179 Opelika City 337.45 461.25 373.90 342.50 340.53 370.13<br />
180 Opp City 125.58 94.95 101.63 101.78 104.38 120.88<br />
181 Oxford City 195.78 239.00 261.00 227.00 246.00 233.00<br />
182 Ozark City 216.33 237.05 214.10 207.73 230.05 226.70<br />
183 Pell City 291.95 343.60 306.30 305.33 310.75 361.45<br />
184 Phenix City 368.43 431.05 405.63 441.45 387.83 403.43<br />
185 Piedmont City 90.18 92.05 82.13 88.63 75.50 77.83<br />
188 Roanoke City 143.80 126.48 115.75 114.13 124.08 124.75<br />
189 Russellville City 203.98 185.73 191.35 206.95 195.43 178.10<br />
190 Scottsboro City 221.05 228.73 223.23 226.00 248.85 245.43<br />
191 Selma City 344.65 400.98 354.78 367.18 358.38 323.93<br />
192 Sheffield City 104.15 138.65 109.23 128.10 111.48 103.38<br />
193 Sylacauga City 171.15 176.08 164.63 172.73 172.43 171.50<br />
194 Talladega City 234.05 304.68 237.38 264.03 274.23 265.90<br />
195 Tallassee City 140.70 121.95 158.70 159.55 152.83 148.45<br />
197 Tarrant City 94.73 83.03 117.78 99.75 88.98 101.80<br />
198 Thomasville City 123.75 154.43 151.55 134.43 139.73 118.15<br />
199 Troy City 187.23 203.05 155.05 197.18 181.38 208.35<br />
200 Tuscaloosa City 830.90 921.08 862.23 827.60 811.03 793.40<br />
201 Tuscumbia City 99.55 122.58 106.90 93.13 94.80 114.98<br />
202 Vestavia Hills City 308.95 307.05 307.63 322.43 331.50 356.13<br />
204 Winfield City 92.25 99.23 95.05 101.25 92.83 105.45<br />
Totals 54,768.64 62,546.70 58,716.37 59,146.55 59,657.78 60,015.38<br />
Note: Due to rounding, grade and system totals may not calculate to exact amount shown.<br />
16
GR6 GR7 GR8 GR9 GR10 GR11 GR12 TOTAL<br />
228.45 236.73 229.40 213.75 221.98 204.20 175.73 2,839.46<br />
271.75 258.95 230.55 260.08 238.28 183.25 146.53 3,496.21<br />
298.18 289.28 262.50 313.35 239.48 221.43 220.68 3,575.40<br />
146.65 128.33 143.98 148.35 138.03 127.95 109.08 1,771.15<br />
198.65 199.98 159.88 169.70 173.55 125.80 143.60 2,782.32<br />
171.38 187.83 163.80 351.75 242.58 241.63 209.43 2,654.08<br />
207.03 221.03 234.03 233.48 238.88 171.20 156.83 2,832.67<br />
128.65 202.25 155.75 221.75 155.60 173.35 143.55 1,983.48<br />
356.08 361.73 314.03 335.25 335.93 300.63 299.70 4,419.64<br />
406.93 339.63 326.98 455.83 286.43 218.20 187.83 4,612.29<br />
2,985.20 2,985.20 2,766.48 3,234.20 2,552.55 2,417.20 2,109.18 38,103.09<br />
118.98 94.55 107.93 126.05 82.70 94.28 89.00 1,370.51<br />
167.43 225.50 220.23 240.53 200.70 223.63 217.68 2,682.94<br />
118.83 165.33 170.43 175.50 158.88 130.15 104.35 1,653.53<br />
688.53 721.28 648.65 749.50 675.63 590.80 511.58 8,947.46<br />
194.98 155.35 155.78 172.20 162.33 119.80 137.05 2,316.91<br />
682.55 717.95 680.40 704.65 671.90 641.15 561.10 8,780.22<br />
80.73 87.58 95.13 62.48 73.78 81.40 61.03 1,033.08<br />
388.45 466.50 419.48 409.33 403.60 418.83 356.65 5,020.03<br />
252.08 274.43 253.35 229.10 241.63 237.10 160.25 3,066.86<br />
206.38 209.58 197.08 268.55 186.45 141.85 106.30 2,416.41<br />
330.18 350.80 368.08 399.75 357.08 359.63 312.20 4,417.19<br />
182.13 213.13 202.05 227.40 191.70 147.80 162.00 2,624.25<br />
441.28 391.78 369.15 393.35 395.80 355.15 294.75 5,530.49<br />
119.03 109.50 99.35 128.53 114.95 112.23 75.30 1,364.01<br />
138.98 133.78 152.63 151.03 146.40 115.40 108.18 1,825.56<br />
138.90 136.28 124.45 140.28 117.03 120.70 105.53 1,690.63<br />
265.08 239.75 235.48 256.83 225.23 202.13 195.05 3,027.96<br />
231.78 248.83 237.83 258.43 261.90 265.90 211.68 3,175.27<br />
795.88 770.70 797.58 762.30 693.18 714.83 656.45 9,793.98<br />
1,829.08 1,760.18 1,721.85 2,098.58 1,608.28 1,347.60 1,401.03 22,707.45<br />
137.85 144.43 143.18 135.83 127.10 120.13 94.40 1,701.25<br />
202.03 201.78 165.30 232.30 197.20 201.33 184.98 2,568.61<br />
109.15 95.73 85.43 98.20 76.35 82.58 84.88 1,237.70<br />
54.88 53.50 57.20 48.83 38.63 42.30 43.58 650.46<br />
494.03 474.45 436.63 476.15 499.10 438.30 383.35 6,023.77<br />
101.15 100.88 97.05 118.40 88.20 79.40 86.13 1,184.56<br />
331.05 337.00 299.63 282.00 285.53 270.40 263.78 3,938.96<br />
184.35 196.28 186.93 189.00 175.00 166.00 143.00 2,406.69<br />
108.03 104.30 77.15 98.48 102.15 80.73 70.40 1,216.00<br />
363.43 371.68 364.18 343.65 335.33 335.78 276.10 4,615.89<br />
104.48 114.98 105.43 151.23 111.78 91.45 100.73 1,429.23<br />
270.00 236.73 258.00 281.65 240.00 216.00 221.00 3,125.16<br />
226.95 263.10 231.45 289.98 243.38 201.85 205.03 2,993.69<br />
354.08 303.63 278.83 291.78 321.30 243.25 202.53 3,914.77<br />
347.58 404.03 368.50 438.30 339.93 315.90 277.20 4,929.25<br />
95.23 69.95 90.95 93.63 89.23 58.08 75.50 1,078.86<br />
117.08 104.33 111.50 119.43 107.33 97.58 105.13 1,511.33<br />
180.40 159.40 187.33 205.55 184.63 151.80 151.00 2,381.64<br />
216.25 215.10 250.68 210.13 192.43 173.83 150.88 2,802.57<br />
317.63 363.45 260.25 280.98 388.05 206.23 229.38 4,195.86<br />
97.93 127.45 104.45 120.83 84.85 102.90 69.68 1,403.06<br />
173.53 189.88 188.88 190.20 183.80 155.05 151.08 2,260.92<br />
249.30 213.50 240.38 262.78 213.65 187.40 170.50 3,117.77<br />
168.15 163.88 154.35 139.63 118.13 113.98 98.00 1,838.29<br />
107.35 114.08 107.50 140.85 108.43 86.35 70.23 1,320.83<br />
142.10 126.58 132.35 144.13 123.08 105.03 84.55 1,679.84<br />
177.05 185.63 181.80 175.70 175.30 121.75 145.63 2,295.09<br />
767.98 720.10 700.45 732.25 592.70 516.23 523.33 9,599.29<br />
96.95 122.00 100.28 127.93 128.35 93.03 117.10 1,417.56<br />
371.23 370.45 377.45 342.85 382.13 352.60 318.05 4,448.45<br />
96.00 104.00 103.78 106.75 87.83 96.65 83.25 1,264.31<br />
58,755.90 59,086.68 56,737.45 60,453.23 52,148.18 46,586.65 42,631.33 731,254.34<br />
Pupil Data<br />
17
Pupil Data<br />
PER PUPIL EXPENDITURES<br />
System System Name ADM State** Local Federal<br />
001 AUTAUGA COUNTY 8,603.30 34,009,884.76 3,993,392.81 5,534,799.30<br />
002 BALDWIN COUNTY 22,598.51 84,627,877.01 34,585,886.34 14,134,961.10<br />
003 BARBOUR COUNTY 1,603.26 7,058,529.31 874,812.02 2,081,715.49<br />
004 BIBB COUNTY 3,616.19 14,697,506.10 1,554,517.99 3,687,349.72<br />
005 BLOUNT COUNTY 7,283.02 28,365,527.03 4,042,786.15 4,979,070.03<br />
006 BULLOCK COUNTY 1,976.33 7,792,299.80 1,487,789.91 2,431,746.91<br />
007 BUTLER COUNTY 3,621.54 14,635,373.36 2,537,768.27 4,278,877.25<br />
008 CALHOUN COUNTY 9,595.69 38,849,933.85 7,210,357.01 7,307,675.28<br />
009 CHAMBERS COUNTY 4,312.37 16,524,634.03 3,181,452.42 3,785,897.12<br />
010 CHEROKEE COUNTY 3,921.88 15,984,334.67 3,921,280.66 3,231,427.27<br />
011 CHILTON COUNTY 6,804.95 26,754,769.35 5,903,006.28 4,970,450.38<br />
012 CHOCTAW COUNTY 2,264.19 10,042,364.06 1,343,265.88 2,883,612.57<br />
013 CLARKE COUNTY 3,585.67 15,207,996.46 2,485,162.91 3,800,969.78<br />
014 CLAY COUNTY 2,419.22 10,192,266.87 1,469,517.31 1,804,862.17<br />
015 CLEBURNE COUNTY 2,552.48 10,309,023.90 1,843,416.96 2,041,055.96<br />
016 COFFEE COUNTY 1,976.71 8,319,969.71 1,416,123.75 1,797,519.27<br />
017 COLBERT COUNTY 3,336.70 13,859,648.78 4,340,385.12 2,746,274.63<br />
018 CONECUH COUNTY 2,106.95 8,612,857.66 1,712,465.30 2,219,391.45<br />
019 COOSA COUNTY 1,730.07 7,111,157.82 995,958.43 1,508,358.99<br />
020 COVINGTON COUNTY 3,276.75 13,351,764.65 2,322,321.15 2,879,073.56<br />
021 CRENSHAW COUNTY 2,400.84 9,521,889.21 1,614,460.35 1,999,981.38<br />
022 CULLMAN COUNTY 9,529.47 37,487,960.13 7,909,711.80 7,296,040.60<br />
023 DALE COUNTY 2,697.09 11,106,649.65 2,219,960.92 1,953,454.10<br />
024 DALLAS COUNTY 4,797.38 20,093,013.17 2,505,216.54 5,008,968.91<br />
025 DEKALB COUNTY 7,783.89 30,706,341.39 9,029,485.17 6,454,083.67<br />
026 ELMORE COUNTY 10,472.81 40,346,706.48 8,236,453.76 5,905,686.34<br />
027 ESCAMBIA COUNTY 4,822.30 20,201,797.33 5,459,548.11 4,773,101.55<br />
028 ETOWAH COUNTY 8,466.38 35,721,425.72 4,077,736.67 5,649,464.39<br />
029 FAYETTE COUNTY 2,771.27 10,815,787.93 2,622,283.45 2,247,718.81<br />
030 FRANKLIN COUNTY 3,154.55 13,631,538.84 2,445,683.67 2,431,950.40<br />
031 GENEVA COUNTY 2,787.49 10,936,269.46 1,845,898.33 2,288,451.31<br />
032 GREENE COUNTY 1,750.08 7,765,098.04 1,636,844.40 3,136,658.22<br />
033 HALE COUNTY 3,346.34 13,247,439.93 2,264,492.64 3,762,423.39<br />
034 HENRY COUNTY 2,796.26 11,192,996.92 2,550,165.45 2,426,495.58<br />
035 HOUSTON COUNTY 6,155.09 24,359,918.44 5,007,518.58 4,665,146.31<br />
036 JACKSON COUNTY 6,232.61 26,685,305.68 5,625,996.99 5,402,749.86<br />
037 JEFFERSON COUNTY 40,863.47 155,845,782.35 45,764,952.13 27,999,554.48<br />
038 LAMAR COUNTY 2,692.16 11,460,040.68 1,588,260.03 2,455,745.73<br />
039 LAUDERDALE COUNTY 8,715.96 33,916,532.32 10,178,203.19 5,547,028.78<br />
040 LAWRENCE COUNTY 6,170.79 24,542,898.31 7,354,046.13 5,503,701.79<br />
041 LEE COUNTY 9,064.31 34,133,700.23 10,783,555.93 5,700,041.17<br />
042 LIMESTONE COUNTY 7,916.78 30,536,443.48 10,859,217.58 6,667,427.54<br />
043 LOWNDES COUNTY 2,656.05 11,301,438.40 1,837,619.13 4,076,199.64<br />
044 MACON COUNTY 3,935.07 16,236,931.06 2,746,323.81 3,791,349.11<br />
045 MADISON COUNTY 15,720.73 59,495,709.21 19,160,231.95 8,694,533.12<br />
046 MARENGO COUNTY 1,758.83 7,667,045.64 896,912.49 2,220,518.69<br />
18
State Rank Local Rank State and Rank State Federal Rank All Funds Rank<br />
Funds PPE State Funds PPE Local Local PPE and Local Funds PPE Federal PPE All Funds<br />
3,953.12 67 464.17 125 4,417.29 126 643.33 109 5,060.63 127<br />
3,744.84 117 1,530.45 22 5,275.29 33 625.48 114 5,900.78 58<br />
4,402.61 5 545.65 119 4,948.26 63 1,298.43 9 6,246.68 35<br />
4,064.36 49 429.88 126 4,494.24 123 1,019.68 20 5,513.92 106<br />
3,894.75 89 555.10 117 4,449.85 125 683.65 102 5,133.50 125<br />
3,942.81 71 752.80 91 4,695.62 108 1,230.44 12 5,926.05 56<br />
4,041.20 52 700.74 102 4,741.94 98 1,181.51 13 5,923.45 57<br />
4,048.69 50 751.42 93 4,800.10 89 761.56 84 5,561.66 98<br />
3,831.91 106 737.75 95 4,569.67 119 877.92 45 5,447.58 112<br />
4,075.68 46 999.85 59 5,075.53 49 823.95 60 5,899.48 59<br />
3,931.66 75 867.46 77 4,799.12 90 730.42 89 5,529.54 104<br />
4,435.30 2 593.27 114 5,028.57 56 1,273.57 10 6,302.14 28<br />
4,241.33 14 693.08 104 4,934.41 66 1,060.04 17 5,994.45 51<br />
4,213.04 18 607.43 113 4,820.47 88 746.05 86 5,566.52 96<br />
4,038.83 54 722.21 98 4,761.03 97 799.64 71 5,560.67 99<br />
4,209.00 19 716.40 99 4,925.40 70 909.35 35 5,834.75 63<br />
4,153.70 29 1,300.80 30 5,454.50 25 823.05 62 6,277.55 30<br />
4,087.83 41 812.77 83 4,900.60 75 1,053.37 18 5,953.97 54<br />
4,110.33 38 575.68 116 4,686.00 109 871.85 48 5,557.85 100<br />
4,074.70 47 708.73 100 4,783.42 93 878.64 44 5,662.06 85<br />
3,966.07 63 672.46 108 4,638.52 113 833.03 56 5,471.56 110<br />
3,933.90 73 830.03 80 4,763.92 96 765.63 80 5,529.55 103<br />
4,118.01 36 823.09 81 4,941.11 65 724.28 94 5,665.39 84<br />
4,188.33 22 522.21 120 4,710.54 105 1,044.11 19 5,754.64 71<br />
3,944.86 69 1,160.02 42 5,104.88 47 829.16 58 5,934.04 55<br />
3,852.52 99 786.46 86 4,638.98 112 563.91 119 5,202.89 124<br />
4,189.25 21 1,132.15 44 5,321.39 31 989.80 24 6,311.19 27<br />
4,219.21 16 481.64 123 4,700.85 107 667.28 106 5,368.13 119<br />
3,902.83 84 946.24 67 4,849.07 81 811.08 65 5,660.15 86<br />
4,321.23 7 775.29 88 5,096.52 48 770.93 78 5,867.45 60<br />
3,923.34 76 662.21 109 4,585.55 116 820.97 63 5,406.52 116<br />
4,437.00 1 935.30 69 5,372.29 30 1,792.29 1 7,164.59 5<br />
3,958.78 64 676.71 107 4,635.49 114 1,124.34 16 5,759.83 69<br />
4,002.85 59 911.99 71 4,914.84 71 867.76 49 5,782.60 66<br />
3,957.69 65 813.56 82 4,771.24 94 757.93 85 5,529.18 105<br />
4,281.56 0 902.67 73 5,184.23 40 866.85 50 6,051.08 47<br />
3,813.82 107 1,119.95 46 4,933.76 67 685.20 101 5,618.96 89<br />
4,256.82 12 589.96 115 4,846.78 83 912.18 34 5,758.96 70<br />
3,891.31 90 1,167.77 40 5,059.08 52 636.42 110 5,695.50 82<br />
3,977.27 61 1,191.75 37 5,169.02 42 891.90 39 6,060.92 45<br />
3,765.73 113 1,189.67 38 4,955.40 62 628.84 113 5,584.24 95<br />
3,857.18 98 1,371.67 28 5,228.85 36 842.19 53 6,071.04 42<br />
4,254.98 13 691.86 105 4,946.84 64 1,534.68 4 6,481.53 19<br />
4,126.21 35 697.91 103 4,824.12 87 963.48 28 5,787.60 65<br />
3,784.54 111 1,218.79 33 5,003.33 59 553.06 120 5,556.39 101<br />
4,359.17 6 509.95 121 4,869.12 79 1,262.50 11 6,131.62 40<br />
19
Pupil Data<br />
PER PUPIL EXPENDITURES<br />
System System Name ADM State** Local Federal<br />
047 MARION COUNTY 3,838.63 16,114,125.62 2,704,116.97 2,677,651.64<br />
048 MARSHALL COUNTY 6,966.14 28,840,791.75 7,021,679.85 5,649,387.66<br />
049 MOBILE COUNTY 65,708.17 258,374,420.55 35,940,112.34 56,634,004.71<br />
050 MONROE COUNTY 4,450.81 18,126,799.88 3,346,912.57 3,939,704.41<br />
051 MONTGOMERY COUNTY 33,290.43 130,107,247.75 29,245,505.14 31,043,723.07<br />
052 MORGAN COUNTY 7,422.39 28,909,682.68 14,160,487.61 5,964,925.98<br />
053 PERRY COUNTY 2,293.79 9,186,736.68 1,126,863.74 3,106,580.01<br />
054 PICKENS COUNTY 3,704.46 15,177,792.55 3,495,098.38 3,720,101.92<br />
055 PIKE COUNTY 2,226.26 9,253,279.40 2,367,679.49 3,429,446.69<br />
056 RANDOLPH COUNTY 2,249.84 9,930,529.66 716,113.88 1,639,267.02<br />
057 RUSSELL COUNTY 3,867.91 15,085,742.78 3,766,498.61 3,465,872.09<br />
058 ST CLAIR COUNTY 7,061.74 26,830,536.85 3,367,555.65 4,388,311.94<br />
059 SHELBY COUNTY 20,243.25 75,609,239.12 38,732,030.28 14,509,317.39<br />
060 SUMTER COUNTY 2,785.39 11,905,954.74 1,814,593.83 4,560,777.15<br />
061 TALLADEGA COUNTY 7,867.83 32,391,332.00 5,752,909.60 6,915,502.76<br />
062 TALLAPOOSA COUNTY 3,372.11 13,750,404.33 3,793,349.20 2,615,923.84<br />
063 TUSCALOOSA COUNTY 15,781.67 61,073,897.93 17,426,102.44 11,648,973.08<br />
064 WALKER COUNTY 8,302.73 34,592,722.21 7,931,554.20 7,729,649.87<br />
065 WASHINGTON COUNTY 3,596.90 14,960,912.81 2,698,443.97 3,075,767.42<br />
066 WILCOX COUNTY 2,513.92 10,316,339.39 2,613,833.49 3,714,654.03<br />
067 WINSTON COUNTY 2,839.46 11,849,100.38 3,575,302.55 2,317,607.34<br />
101 ALBERTVILLE CITY 3,496.21 14,079,583.37 3,459,253.34 2,462,564.69<br />
102 ALEXANDER CITY CITY 3,575.40 14,351,862.54 4,067,316.04 2,139,324.58<br />
104 ANDALUSIA CITY 1,771.15 6,982,376.84 1,708,432.85 1,480,718.58<br />
105 ANNISTON CITY 2,782.32 11,959,263.39 2,426,709.54 3,637,953.38<br />
106 ARAB CITY 2,654.08 10,220,029.75 3,200,669.90 1,341,491.87<br />
107 ATHENS CITY 2,832.67 10,662,539.05 8,336,740.26 1,243,778.63<br />
109 ATTALLA CITY 1,983.48 7,825,413.45 1,524,263.85 1,645,915.06<br />
110 AUBURN CITY 4,419.64 17,145,147.69 8,902,464.81 2,790,327.55<br />
113 BESSEMER CITY 4,612.29 17,698,645.10 3,564,637.35 5,263,386.19<br />
114 BIRMINGHAM CITY 38,103.09 147,213,486.22 64,090,736.39 36,457,535.88<br />
116 BREWTON CITY 1,370.51 5,543,961.10 2,131,049.75 736,907.18<br />
125 CULLMAN CITY 2,682.94 10,095,758.09 2,136,701.62 1,831,711.24<br />
126 DALEVILLE CITY 1,653.53 6,634,090.50 1,443,423.62 1,277,534.40<br />
127 DECATUR CITY 8,947.46 32,967,350.76 21,256,355.55 6,321,687.72<br />
128 DEMOPOLIS CITY 2,316.91 8,612,146.95 2,307,387.67 1,680,041.24<br />
130 DOTHAN CITY 8,780.22 34,903,429.76 12,576,001.86 6,799,034.18<br />
131 ELBA CITY 1,033.08 4,311,200.84 1,138,577.02 1,012,892.37<br />
132 ENTERPRISE CITY 5,020.03 19,683,129.16 7,615,623.40 3,176,420.07<br />
133 EUFAULA CITY 3,066.86 11,565,401.47 3,323,577.09 2,368,339.48<br />
137 FAIRFIELD CITY 2,416.41 8,746,595.28 2,674,214.54 2,116,119.66<br />
141 FLORENCE CITY 4,417.19 18,614,277.35 10,375,500.67 3,534,141.44<br />
143 FORT PAYNE CITY 2,624.25 10,063,782.19 2,441,599.85 2,160,720.84<br />
144 GADSDEN CITY 5,530.49 22,922,500.79 5,768,780.95 5,585,520.27<br />
146 GENEVA CITY 1,364.01 5,575,801.00 1,332,045.87 922,373.94<br />
154 GUNTERSVILLE CITY 1,825.56 7,138,173.39 3,143,239.67 1,211,556.77<br />
20
State Rank Local Rank State and Rank State Federal Rank All Funds Rank<br />
Funds PPE State Funds PPE Local Local PPE and Local Funds PPE Federal PPE All Funds<br />
4,197.88 20 704.45 101 4,902.33 74 697.55 100 5,599.89 91<br />
4,140.14 33 1,007.97 57 5,148.11 44 810.98 66 5,959.09 53<br />
3,932.15 74 546.97 118 4,479.12 124 861.90 51 5,341.02 121<br />
4,072.70 48 751.98 92 4,824.68 86 885.17 42 5,709.84 81<br />
3,908.25 82 878.50 74 4,786.74 92 932.51 31 5,719.26 79<br />
3,894.93 88 1,907.81 12 5,802.74 11 803.64 68 6,606.38 13<br />
4,005.05 58 491.27 122 4,496.31 122 1,354.34 7 5,850.66 61<br />
4,097.17 40 943.48 68 5,040.65 54 1,004.22 23 6,044.87 49<br />
4,156.42 28 1,063.52 51 5,219.95 37 1,540.45 3 6,760.40 10<br />
4,413.88 3 318.30 128 4,732.18 100 728.61 90 5,460.79 111<br />
3,900.23 86 973.78 63 4,874.01 78 896.06 38 5,770.07 67<br />
3,799.42 109 476.87 124 4,276.30 128 621.42 116 4,897.72 128<br />
3,735.03 118 1,913.33 11 5,648.37 15 716.75 95 6,365.11 24<br />
4,274.43 11 651.47 112 4,925.90 69 1,637.39 2 6,563.29 15<br />
4,116.93 37 731.19 96 4,848.13 82 878.96 43 5,727.09 76<br />
4,077.69 44 1,124.92 45 5,202.60 38 775.75 74 5,978.36 52<br />
3,869.93 94 1,104.20 48 4,974.13 60 738.13 87 5,712.26 80<br />
4,166.43 25 955.29 65 5,121.72 46 930.98 32 6,052.70 46<br />
4,159.39 26 750.21 94 4,909.60 72 855.12 52 5,764.72 68<br />
4,103.69 39 1,039.74 54 5,143.43 45 1,477.63 5 6,621.06 12<br />
4,173.01 24 1,259.15 32 5,432.16 27 816.21 64 6,248.37 34<br />
4,027.10 55 989.43 61 5,016.53 57 704.35 98 5,720.88 78<br />
4,014.06 56 1,137.58 43 5,151.64 43 598.35 117 5,749.99 73<br />
3,942.28 72 964.59 64 4,906.87 73 836.02 55 5,742.89 74<br />
4,298.31 8 872.19 76 5,170.50 41 1,307.53 8 6,478.02 20<br />
3,850.69 100 1,205.94 34 5,056.63 53 505.45 124 5,562.07 97<br />
3,764.13 114 2,943.07 3 6,707.20 3 439.08 125 7,146.28 6<br />
3,945.29 68 768.48 90 4,713.77 103 829.81 57 5,543.59 102<br />
3,879.31 91 2,014.30 9 5,893.61 10 631.35 112 6,524.95 16<br />
3,837.28 103 772.86 89 4,610.14 115 1,141.17 15 5,751.30 72<br />
3,863.56 97 1,682.04 18 5,545.59 19 956.81 30 6,502.41 17<br />
4,045.18 51 1,554.93 21 5,600.11 17 537.69 122 6,137.80 39<br />
3,762.95 116 796.40 85 4,559.35 121 682.73 103 5,242.07 123<br />
4,012.08 57 872.93 75 4,885.01 77 772.61 76 5,657.62 87<br />
3,684.55 124 2,375.69 5 6,060.23 7 706.53 97 6,766.77 9<br />
3,717.08 121 995.89 60 4,712.97 104 725.12 93 5,438.09 115<br />
3,975.23 62 1,432.31 27 5,407.54 28 774.36 75 6,181.90 38<br />
4,173.15 23 1,102.12 49 5,275.27 34 980.46 26 6,255.73 32<br />
3,920.92 78 1,517.05 23 5,437.97 26 632.75 111 6,070.72 43<br />
3,771.09 112 1,083.71 50 4,854.80 80 772.24 77 5,627.03 88<br />
3,619.67 127 1,106.69 47 4,726.35 102 875.73 46 5,602.08 90<br />
4,214.05 17 2,348.89 6 6,562.95 5 800.09 69 7,363.03 3<br />
3,834.92 104 930.40 70 4,765.32 95 823.37 61 5,588.68 94<br />
4,144.75 31 1,043.09 53 5,187.84 39 1,009.95 21 6,197.79 37<br />
4,087.80 42 976.57 62 5,064.37 51 676.22 104 5,740.59 75<br />
3,910.13 81 1,721.79 15 5,631.92 16 663.66 107 6,295.59 29<br />
21
Pupil Data<br />
PER PUPIL EXPENDITURES<br />
System System Name ADM State** Local Federal<br />
155 HALEYVILLE CITY 1,690.63 6,163,418.12 1,695,255.36 1,242,983.68<br />
156 HARTSELLE CITY 3,027.96 11,521,320.92 5,119,052.96 1,663,276.16<br />
157 HOMEWOOD CITY 3,175.27 13,626,904.98 11,393,911.53 875,725.18<br />
158 HOOVER CITY 9,793.98 41,485,323.32 23,959,755.27 5,729,140.98<br />
159 HUNTSVILLE CITY 22,707.45 88,674,145.52 50,412,399.37 16,490,376.42<br />
162 JACKSONVILLE CITY 1,701.25 6,304,200.27 1,619,104.08 1,339,935.96<br />
163 JASPER CITY 2,568.61 9,576,636.05 4,672,582.25 1,827,694.53<br />
165 LANETT CITY 1,237.70 4,839,912.23 1,305,127.33 1,433,606.93<br />
168 LINDEN CITY 650.46 2,869,920.90 839,884.00 882,173.83<br />
169 MADISON CITY 6,023.77 22,426,152.20 7,255,538.14 3,112,935.08<br />
171 MIDFIELD CITY 1,184.56 4,578,604.00 1,791,311.88 1,033,525.45<br />
175 MOUNTAIN BROOK CITY 3,938.96 14,621,218.89 16,851,165.09 403,288.63<br />
176 MUSCLE SHOALS CITY 2,406.69 9,426,538.42 4,825,677.34 1,612,165.04<br />
178 ONEONTA CITY 1,216.00 4,702,654.73 1,050,678.80 758,073.80<br />
179 OPELIKA CITY 4,615.89 18,204,139.05 6,275,956.72 3,528,739.06<br />
180 OPP CITY 1,429.23 5,605,809.05 1,298,046.86 1,090,754.34<br />
181 OXFORD CITY 3,125.16 12,107,488.72 3,185,322.35 2,187,307.41<br />
182 OZARK CITY 2,993.69 11,971,500.50 3,029,268.35 2,513,520.64<br />
183 PELL CITY CITY 3,914.77 15,052,559.83 3,378,857.47 3,109,447.16<br />
184 PHENIX CITY CITY 4,929.25 18,897,139.19 5,900,124.18 4,970,073.69<br />
185 PIEDMONT CITY 1,078.86 4,464,090.42 703,947.22 969,432.05<br />
188 ROANOKE CITY 1,511.33 5,688,021.81 1,220,282.13 1,209,162.12<br />
189 RUSSELLVILLE CITY 2,381.64 9,281,012.49 2,786,878.91 1,827,115.85<br />
190 SCOTTSBORO CITY 2,802.57 11,626,315.94 4,226,216.55 2,318,536.29<br />
191 SELMA CITY 4,195.86 17,101,993.27 2,773,899.47 4,138,484.42<br />
192 SHEFFIELD CITY 1,403.06 5,549,766.19 2,544,938.37 1,346,159.19<br />
193 SYLACAUGA CITY 2,260.92 9,132,531.49 3,346,961.24 2,007,615.19<br />
194 TALLADEGA CITY 3,117.77 12,724,179.21 3,630,587.37 3,024,139.71<br />
195 TALLASSEE CITY 1,838.29 6,745,343.52 1,339,914.17 1,333,920.04<br />
197 TARRANT CITY 1,320.83 5,112,449.80 2,114,574.55 1,224,674.87<br />
198 THOMASVILLE CITY 1,679.84 6,960,828.91 1,144,485.37 1,104,773.89<br />
199 TROY CITY 2,295.09 8,701,964.84 1,798,466.02 2,081,157.88<br />
200 TUSCALOOSA CITY 9,599.29 37,450,147.35 15,561,945.58 8,545,302.98<br />
201 TUSCUMBIA CITY 1,417.56 5,450,441.96 2,392,901.53 1,141,101.84<br />
202 VESTAVIA HILLS CITY 4,448.45 15,920,320.73 10,394,640.01 1,884,230.51<br />
204 WINFIELD CITY 1,264.31 5,255,807.52 514,212.72 967,501.33<br />
COUNTIES TOTAL/AVERAGE 487,027.61 1,927,651,968.24 455,039,189.66 398,910,713.12<br />
CITIES TOTAL/AVERAGE 244,226.73 955,336,748.37 393,299,174.00 190,126,049.34<br />
STATE TOTAL/AVERAGE 731,254.34 2,882,988,716.61 848,338,363.66 589,036,762.46<br />
** State Fund Sources include the local match required for the Foundation Program.<br />
22
State Rank Local Rank State and Rank State Federal Rank All Funds Rank<br />
Funds PPE State Funds PPE Local Local PPE and Local Funds PPE Federal PPE All Funds<br />
3,645.63 126 1,002.74 58 4,648.37 111 735.22 88 5,383.59 117<br />
3,804.98 108 1,690.59 16 5,495.57 23 549.31 121 6,044.88 48<br />
4,291.57 9 3,588.33 2 7,879.90 2 275.80 127 8,155.70 1<br />
4,235.80 15 2,446.38 4 6,682.17 4 584.97 118 7,267.14 4<br />
3,905.07 83 2,220.08 8 6,125.15 6 726.21 91 6,851.36 8<br />
3,705.63 123 951.71 66 4,657.34 110 787.62 73 5,444.96 113<br />
3,728.33 119 1,819.11 13 5,547.44 18 711.55 96 6,258.99 31<br />
3,910.41 80 1,054.48 52 4,964.89 61 1,158.28 14 6,123.17 41<br />
4,412.14 4 1,291.22 31 5,703.36 13 1,356.23 6 7,059.59 7<br />
3,722.94 20 1,204.48 35 4,927.43 68 516.78 123 5,444.20 114<br />
3,865.24 96 1,512.22 24 5,377.45 29 872.50 47 6,249.95 33<br />
3,711.95 122 4,278.07 1 7,990.02 1 102.38 128 8,092.41 2<br />
3,916.81 79 2,005.11 10 5,921.92 8 669.87 105 6,591.78 14<br />
3,867.31 95 864.05 78 4,731.36 101 623.42 115 5,354.78 120<br />
3,943.80 70 1,359.64 29 5,303.44 32 764.48 82 6,067.92 44<br />
3,922.26 77 908.21 72 4,830.47 84 763.18 83 5,593.65 92<br />
3,874.20 92 1,019.25 55 4,893.45 76 699.90 99 5,593.35 93<br />
3,998.91 60 1,011.88 56 5,010.80 58 839.61 54 5,850.40 62<br />
3,845.07 101 863.10 79 4,708.17 106 794.29 72 5,502.46 107<br />
3,833.67 105 1,196.96 36 5,030.64 55 1,008.28 22 6,038.92 50<br />
4,137.78 34 652.49 111 4,790.28 91 898.57 37 5,688.85 83<br />
3,763.59 115 807.42 84 4,571.01 118 800.06 70 5,371.07 118<br />
3,896.90 87 1,170.15 39 5,067.05 50 767.17 79 5,834.22 64<br />
4,148.45 30 1,507.98 25 5,656.43 14 827.29 59 6,483.72 18<br />
4,075.92 45 661.10 110 4,737.02 99 986.33 25 5,723.35 77<br />
3,955.47 66 1,813.85 14 5,769.32 12 959.45 29 6,728.77 11<br />
4,039.30 53 1,480.35 26 5,519.65 22 887.96 41 6,407.62 22<br />
4,081.18 43 1,164.48 41 5,245.66 35 969.97 27 6,215.63 36<br />
3,669.36 125 728.89 97 4,398.25 127 725.63 92 5,123.88 126<br />
3,870.63 93 1,600.94 20 5,471.58 24 927.20 33 6,398.78 23<br />
4,143.75 32 681.31 106 4,825.05 85 657.67 108 5,482.72 108<br />
3,791.56 110 783.61 87 4,575.17 117 906.79 36 5,481.96 109<br />
3,901.35 85 1,621.16 19 5,522.50 21 890.20 40 6,412.70 21<br />
3,844.95 102 1,688.04 17 5,532.99 20 804.98 67 6,337.96 26<br />
3,578.85 128 2,336.69 7 5,915.53 9 423.57 126 6,339.10 25<br />
4,157.06 27 406.71 127 4,563.77 120 765.24 81 5,329.01 122<br />
3,957.99 934.32 4,892.31 819.07 5,711.38<br />
3,911.68 1,610.39 5,522.07 778.48 6,300.55<br />
3,942.53 1,160.11 5,102.64 805.52 5,908.15<br />
23
Pupil Data<br />
COUNTY SYSTEM ENROLLMENT BY RACE & GENDER<br />
System Name Male Percent Female Percent White Percent Non-White Percent<br />
Male Female White Non-White<br />
Autauga County 4,475 51.88 4,150 48.12 6,442 74.69 2,183 25.31<br />
Baldwin County 11,792 52.05 10,864 47.95 18,298 80.76 4,358 19.24<br />
Barbour County 846 52.45 767 47.55 181 11.22 1,432 88.78<br />
Bibb County 1,878 52.81 1,678 47.19 2,496 70.19 1,060 29.81<br />
Blount County 3,762 51.60 3,528 48.40 6,815 93.48 475 6.52<br />
Bullock County 1,008 50.88 973 49.12 9 0.45 1,972 99.55<br />
Butler County 1,860 51.21 1,772 48.79 1,370 37.72 2,262 62.28<br />
Calhoun County 4,935 51.75 4,601 48.25 8,224 86.24 1,312 13.76<br />
Chambers County 2,209 51.28 2,099 48.72 2,074 48.14 2,234 51.86<br />
Cherokee County 2,092 53.38 1,827 46.62 3,604 91.96 315 8.04<br />
Chilton County 3,533 52.07 3,252 47.93 5,558 81.92 1,227 18.08<br />
Choctaw County 1,188 52.52 1,074 47.48 609 26.92 1,653 73.08<br />
Clarke County 1,848 51.40 1,747 48.60 1,206 33.55 2,389 66.45<br />
Clay County 1,280 52.76 1,146 47.24 1,846 76.09 580 23.91<br />
Cleburne County 1,278 49.96 1,280 50.04 2,391 93.47 167 6.53<br />
C<strong>of</strong>fee County 1,003 52.00 926 48.00 1,719 89.11 210 10.89<br />
Colbert County 1,812 54.20 1,531 45.80 2,694 80.59 649 19.41<br />
Conecuh County 1,106 52.42 1,004 47.58 492 23.32 1,618 76.68<br />
Coosa County 898 51.76 837 48.24 849 48.93 886 51.07<br />
Covington County 1,706 52.04 1,572 47.96 2,944 89.81 334 10.19<br />
Crenshaw County 1,332 55.80 1,055 44.20 1,577 66.07 810 33.93<br />
Cullman County 4,876 51.18 4,652 48.82 9,264 97.23 264 2.77<br />
Dale County 1,424 53.41 1,242 46.59 2,135 80.08 531 19.92<br />
Dallas County 2,430 50.60 2,372 49.40 1,191 24.80 3,611 75.20<br />
Dekalb County 4,047 51.83 3,761 48.17 6,291 80.57 1,517 19.43<br />
Elmore County 5,242 52.09 4,822 47.91 7,150 71.05 2,914 28.95<br />
Escambia County 2,480 51.51 2,335 48.49 2,706 56.20 2,109 43.80<br />
Etowah County 4,368 51.58 4,100 48.42 8,282 97.80 186 2.20<br />
Fayette County 1,434 51.56 1,347 48.44 2,263 81.37 518 18.63<br />
Franklin County 1,628 51.60 1,527 48.40 3,009 95.37 146 4.63<br />
Geneva County 1,487 53.39 1,298 46.61 2,222 79.78 563 20.22<br />
Greene County 906 51.86 841 48.14 9 0.52 1,738 99.48<br />
Hale County 1,702 51.54 1,600 48.46 813 24.62 2,489 75.38<br />
Henry County 1,392 49.82 1,402 50.18 1,424 50.97 1,370 49.03<br />
Houston County 3,168 51.31 3,006 48.69 4,940 80.01 1,234 19.99<br />
Jackson County 3,164 51.37 2,995 48.63 5,180 84.10 979 15.90<br />
Jefferson County 21,086 51.78 19,640 48.22 30,804 75.64 9,922 24.36<br />
Lamar County 1,359 50.63 1,325 49.37 2,204 82.12 480 17.88<br />
Lauderdale County 4,544 52.17 4,166 47.83 8,372 96.12 338 3.88<br />
Lawrence County 3,245 53.04 2,873 46.96 3,994 65.28 2,124 34.72<br />
Lee County 4,580 50.95 4,410 49.05 6,743 75.01 2,247 24.99<br />
Limestone County 4,098 51.68 3,832 48.32 6,898 86.99 1,032 13.01<br />
Lowndes County 1,342 51.22 1,278 48.78 14 0.53 2,606 99.47<br />
Macon County 2,001 51.51 1,884 48.49 123 3.17 3,762 96.83<br />
Madison County 8,162 52.07 7,513 47.93 12,576 80.23 3,099 19.77<br />
Marengo County 938 53.57 813 46.43 291 16.62 1,460 83.38<br />
Marion County 1,987 51.81 1,848 48.19 3,681 95.98 154 4.02<br />
Marshall County 3,623 52.23 3,313 47.77 6,690 96.45 246 3.55<br />
Mobile County 33,446 51.47 31,530 48.53 30,608 47.11 34,368 52.89<br />
Monroe County 2,304 51.92 2,134 48.08 1,817 40.94 2,621 59.06<br />
Montgomery County 17,066 51.30 16,201 48.70 8,227 24.73 25,040 75.27<br />
Morgan County 3,896 52.63 3,506 47.37 7,087 95.74 315 4.26<br />
Perry County 1,178 51.17 1,124 48.83 22 0.96 2,280 99.04<br />
Pickens County 1,864 50.27 1,844 49.73 1,336 36.03 2,372 63.97<br />
Pike County 1,206 54.37 1,012 45.63 978 44.09 1,240 55.91<br />
Randolph County 1,169 52.05 1,077 47.95 1,718 76.49 528 23.51<br />
Russell County 1,975 51.14 1,887 48.86 2,136 55.31 1,726 44.69<br />
Shelby County 10,563 52.48 9,566 47.52 17,208 85.49 2,921 14.51<br />
St Clair County 3,790 53.59 3,282 46.41 6,422 90.81 650 9.19<br />
Sumter County 1,422 51.13 1,359 48.87 5 0.18 2,776 99.82<br />
Talladega County 4,035 51.46 3,806 48.54 4,539 57.89 3,302 42.11<br />
Tallapoosa County 1,748 51.75 1,630 48.25 2,052 60.75 1,326 39.25<br />
Tuscaloosa County 8,058 51.44 7,608 48.56 11,636 74.28 4,030 25.72<br />
Walker County 4,322 52.31 3,940 47.69 7,675 92.90 587 7.10<br />
Washington County 1,910 53.22 1,679 46.78 2,052 57.17 1,537 42.83<br />
Wilcox County 1,277 50.39 1,257 49.61 10 0.39 2,524 99.61<br />
Winston County 1,470 51.54 1,382 48.46 2,844 99.72 8 0.28<br />
County Totals 251,253 233,702 319,039 165,916<br />
24
City System Enrollment by Race & Gender<br />
Pupil Data<br />
CITY SYSTEM ENROLLMENT BY RACE & GENDER<br />
System Name Male Percent Female Percent White Percent Non-White Percent<br />
Male Female White Non-White<br />
Albertville 1,761 50.73 1,710 49.27 2,855 82.25 616 17.75<br />
Alexander City 1,829 51.19 1,744 48.81 2,189 61.27 1,384 38.73<br />
Andalusia 915 51.75 853 48.25 1,245 70.42 523 29.58<br />
Anniston 1,381 50.40 1,359 49.60 184 6.72 2,556 93.28<br />
Arab 1,346 50.91 1,298 49.09 2,614 98.87 30 1.13<br />
Athens 1,451 51.18 1,384 48.82 1,930 68.08 905 31.92<br />
Attalla 994 53.93 849 46.07 1,532 83.13 311 16.87<br />
Auburn 2,169 49.06 2,252 50.94 2,720 61.52 1,701 38.48<br />
Bessemer 2,433 52.57 2,195 47.43 194 4.19 4,434 95.81<br />
Birmingham 19,117 50.52 18,726 49.48 1,078 2.85 36,765 97.15<br />
Brewton 693 50.58 677 49.42 741 54.09 629 45.91<br />
Cullman 1,399 52.03 1,290 47.97 2,567 95.46 122 4.54<br />
Daleville 887 53.53 770 46.47 971 58.60 686 41.40<br />
Decatur 4,502 50.23 4,461 49.77 5,478 61.12 3,485 38.88<br />
Demopolis 1,149 49.93 1,152 50.07 1,103 47.94 1,198 52.06<br />
Dothan 4,438 51.08 4,250 48.92 4,178 48.09 4,510 51.91<br />
Elba 543 52.87 484 47.13 638 62.12 389 37.88<br />
Enterprise 2,593 51.33 2,459 48.67 3,309 65.50 1,743 34.50<br />
Eufaula 1,556 50.92 1,500 49.08 1,422 46.53 1,634 53.47<br />
Fairfield 1,204 49.81 1,213 50.19 1 0.04 2,416 99.96<br />
Florence 2,226 50.33 2,197 49.67 2,712 61.32 1,711 38.68<br />
Fort Payne 1,378 52.30 1,257 47.70 2,087 79.20 548 20.80<br />
Gadsden 2,834 51.46 2,673 48.54 2,240 40.68 3,267 59.32<br />
Geneva 696 51.33 660 48.67 1,114 82.15 242 17.85<br />
Guntersville 965 52.91 859 47.09 1,563 85.69 261 14.31<br />
Haleyville 874 51.75 815 48.25 1,631 96.57 58 3.43<br />
Hartselle 1,546 51.40 1,462 48.60 2,781 92.45 227 7.55<br />
Homewood 1,636 51.61 1,534 48.39 2,210 69.72 960 30.28<br />
Hoover 5,034 51.16 4,805 48.84 8,173 83.07 1,666 16.93<br />
Huntsville 11,653 51.04 11,179 48.96 12,141 53.18 10,691 46.82<br />
Jacksonville 897 53.01 795 46.99 1,291 76.30 401 23.70<br />
Jasper 1,286 50.59 1,256 49.41 1,988 78.21 554 21.79<br />
Lanett 654 52.36 595 47.64 316 25.30 933 74.70<br />
Linden 335 51.54 315 48.46 19 2.92 631 97.08<br />
Madison 3,092 51.63 2,897 48.37 4,392 73.33 1,597 26.67<br />
Midfield 623 52.44 565 47.56 167 14.06 1,021 85.94<br />
Mountain Brook 1,977 50.16 1,964 49.84 3,896 98.86 45 1.14<br />
Muscle Shoals 1,226 51.10 1,173 48.90 1,980 82.53 419 17.47<br />
Oneonta 643 52.40 584 47.60 994 81.01 233 18.99<br />
Opelika 2,285 50.58 2,233 49.42 1,686 37.32 2,832 62.68<br />
Opp City 729 50.77 707 49.23 1,122 78.13 314 21.87<br />
Oxford 1,628 52.10 1,497 47.90 2,401 76.83 724 23.17<br />
Ozark 1,554 51.82 1,445 48.18 1,728 57.62 1,271 42.38<br />
Pell City 1,984 51.24 1,888 48.76 3,320 85.74 552 14.26<br />
Phenix City 2,519 50.99 2,421 49.01 1,893 38.32 3,047 61.68<br />
Piedmont 535 49.45 547 50.55 921 85.12 161 14.88<br />
Roanoke 779 51.45 735 48.55 823 54.36 691 45.64<br />
Russellville 1,236 51.98 1,142 48.02 1,816 76.37 562 23.63<br />
Scottsboro 1,429 51.07 1,369 48.93 2,552 91.21 246 8.79<br />
Selma 2,097 49.70 2,122 50.30 216 5.12 4,003 94.88<br />
Sheffield 714 50.85 690 49.15 770 54.84 634 45.16<br />
Sylacauga 1,159 51.28 1,101 48.72 1,385 61.28 875 38.72<br />
Talladega 1,535 49.81 1,547 50.19 1,409 45.72 1,673 54.28<br />
Tallassee 945 51.22 900 48.78 1,321 71.60 524 28.40<br />
Tarrant 682 51.16 651 48.84 785 58.89 548 41.11<br />
Thomasville 865 51.34 820 48.66 935 55.49 750 44.51<br />
Troy 1,189 52.17 1,090 47.83 957 41.99 1,322 58.01<br />
Tuscaloosa 4,844 50.75 4,701 49.25 2,501 26.20 7,044 73.80<br />
Tuscumbia 713 51.44 673 48.56 955 68.90 431 31.10<br />
Vestavia Hills 2,305 51.81 2,144 48.19 4,000 89.91 449 10.09<br />
Winfield 662 52.50 599 47.50 1,192 94.53 69 5.47<br />
City Totals 124,323 119,233 123,332 120,224<br />
State Totals 375,576 352,935 442,371 286,140<br />
25
Pupil Data<br />
ENROLLMENT<br />
G<br />
E<br />
N<br />
D<br />
E<br />
R<br />
Male<br />
52%<br />
(375,576) Female<br />
48%<br />
(352,935)<br />
R<br />
A<br />
C<br />
E<br />
White<br />
61%<br />
(442,371)<br />
Non-White<br />
39%<br />
(284,140)<br />
26
Pupil Data<br />
DROPOUTS<br />
G<br />
E<br />
N<br />
D<br />
E<br />
R<br />
7000<br />
6000<br />
5000<br />
4000<br />
3000<br />
2000<br />
1000<br />
0<br />
MALES<br />
6,126<br />
FEMALES<br />
4,192<br />
MALES<br />
5,584<br />
FEMALES<br />
3,677<br />
MALES<br />
5,507<br />
FEMALES<br />
3,724<br />
MALES<br />
5,243<br />
FEMALES<br />
3,349<br />
1998 1999 2000 <strong>2001</strong><br />
R<br />
A<br />
C<br />
E<br />
7000<br />
6000<br />
5000<br />
4000<br />
3000<br />
2000<br />
1000<br />
WHITE<br />
6,261<br />
NON-<br />
WHITE<br />
4,057<br />
WHITE<br />
5,783<br />
NON-<br />
WHITE<br />
3,478<br />
WHITE<br />
5,802<br />
NON-<br />
WHITE<br />
3,429<br />
WHITE<br />
5,465<br />
NON-<br />
WHITE<br />
3,127<br />
0<br />
1998 1999 2000 <strong>2001</strong><br />
27
Pupil Data<br />
GRADUATES – <strong>2001</strong><br />
G<br />
E<br />
N<br />
D<br />
E<br />
R<br />
Female<br />
52%<br />
(19,877)<br />
Male<br />
48%<br />
(18,065)<br />
R<br />
A<br />
C<br />
E<br />
Non-White<br />
Students<br />
35%<br />
(13,378)<br />
White<br />
Students<br />
65%<br />
(24,564)<br />
28
Pupil Data<br />
T<br />
O<br />
T<br />
A<br />
L<br />
S<br />
40,000<br />
35,000<br />
30,000<br />
25,000<br />
37,942<br />
24,564<br />
G<br />
R<br />
A<br />
D<br />
U<br />
A<br />
T<br />
E<br />
S<br />
20,000<br />
15,000<br />
10,000<br />
5,000<br />
0<br />
TOTAL<br />
STUDENTS<br />
WHITE<br />
STUDENTS<br />
13,378<br />
NON-WHITE<br />
STUDENTS<br />
18,065<br />
MALES<br />
19,877<br />
FEMALES<br />
29
Local <strong>Education</strong> Agencies<br />
PUBLIC EDUCATION<br />
Public education in the State <strong>of</strong> <strong>Alabama</strong> is funded from three basic sources. One source <strong>of</strong> revenue is the state<br />
<strong>Education</strong> Trust Fund (ETF), which is funded from tax revenues raised primarily from sales and income taxes. The<br />
second source <strong>of</strong> public education funding is derived from local tax receipts which, as <strong>of</strong> FY 1998, must be equivalent to<br />
10 mills <strong>of</strong> school tax based upon the most current assessed valuation <strong>of</strong> property. Under the current law, these two<br />
sources <strong>of</strong> revenue create the Foundation Program Fund to cover the cost <strong>of</strong> the Foundation Program calculations. A<br />
third revenue source, the Public School Fund is funded from 3 mills <strong>of</strong> the 6 1/2 mills <strong>of</strong> ad valorem tax. The Public<br />
School Fund is used to fund the Hold Harmless program as well as Capital Projects.<br />
PUBLIC EDUCATION IN ALABAMA<br />
• Foundation Program<br />
(1) <strong>Education</strong> Trust Fund (Sales and Income Tax)<br />
(2) Local Tax Receipts (Equivalent to 10 mills)<br />
• Hold Harmless and Capital Projects<br />
(3) Public School Fund (3 mills Ad Valorem Tax)<br />
The Foundation Program, enacted by the <strong>Alabama</strong> Legislature in 1995, is a funding mechanism to calculate the cost for<br />
K-12 education. It is designed to give local school systems maximum control <strong>of</strong> expenditures by apportioning funds in a<br />
“block grant” manner based on cost calculations using prior year data, such as average daily membership (ADM). The<br />
Foundation Program, as codified in Code <strong>of</strong> <strong>Alabama</strong> 16-13-231(b), provides the following for the Foundation Program<br />
Fund:<br />
• Requirements for Participating in the Foundation Program Fund<br />
• Determining Cost <strong>of</strong> Foundation Program<br />
• Determining Funds Available to Provide Foundation Program<br />
30
Participation Requirements<br />
The local school system has requirements for participating in the Foundation Program Fund. Each school system must<br />
receive local tax receipts equivalent to 10 mills <strong>of</strong> school tax as computed from the most current assessed valuation <strong>of</strong><br />
property. The required contribution to the local board’s Foundation Program was phased in over three years. For 1995-<br />
96 it was 5 mills, for 1996-97 it was 7.5 mills, and in 1997-98 and thereafter it increased to 10 mills.<br />
Other participation requirements include the following:<br />
• A minimum <strong>of</strong> 175 day school year,<br />
• A local salary schedule that is at least 100% <strong>of</strong> salary amounts specified in the state salary matrix,<br />
• Equitable allocation <strong>of</strong> state and local Foundation Program funds to each school based on the current<br />
year’s actual student populations, and<br />
• Submission to the State Superintendent <strong>of</strong> <strong>Education</strong> 7 program plans.<br />
(1) Building<br />
(2) Transportation<br />
(3) Pr<strong>of</strong>essional development<br />
(4) Technology<br />
(5) Special <strong>Education</strong><br />
(6) Vocational education services<br />
(7) <strong>Education</strong>al services for at risk students<br />
Determining Cost <strong>of</strong> Foundation Program<br />
The four cost areas within the Foundation Program:<br />
(1) Salary<br />
(2) Fringe Benefits<br />
(3) Other Current Expense (OCE)<br />
(4) Classroom Instructional Support<br />
• Textbooks<br />
• Library Enhancement<br />
• Technology<br />
• Pr<strong>of</strong>essional Development<br />
• Classroom Materials and Supplies<br />
Determining Funds Available to Pay Foundation Program<br />
Once the cost <strong>of</strong> the Foundation Program is determined for a local school system, the ETF funds are calculated. The<br />
total Foundation Program cost minus the required local 10 mills equals the amount <strong>of</strong> ETF fund the system will receive.<br />
The ETF funds received by a local school system is dependent upon and varies based on the local property values within<br />
the school tax districts.<br />
Local <strong>Education</strong> Agencies<br />
31
Local <strong>Education</strong> Agencies<br />
FOUNDATION PROGRAM<br />
PURPOSE/DESCRIPTION<br />
◗ Priority on K-12 Funding<br />
◗ Address equity<br />
◗ Maximize local control – block grants<br />
◗ Identify total state cost <strong>of</strong> K-12<br />
◗ <strong>Annual</strong> funding stream for capital projects<br />
◗ <strong>Report</strong> to the local communities<br />
FUNDING PLAN COMPONENTS<br />
◗ Foundation Program (Funds K-12)<br />
◗ Public School Fund (Funds capital projects)<br />
• Hold Harmless<br />
• Capital Purchase<br />
◗ Transportation<br />
◗ Accountability<br />
PARTICIPATION REQUIREMENTS FOR LEAS<br />
◗ Provide local tax receipts equivalent to 10 mills <strong>of</strong><br />
district ad valorem tax<br />
◗ Provide school term <strong>of</strong> at least 175 days<br />
◗ Submit seven required program plans<br />
1. At-Risk<br />
2. Capital Outlay<br />
3. Pr<strong>of</strong>essional Development<br />
4. Special <strong>Education</strong><br />
5. Technology<br />
6. Transportation<br />
7. Vocational <strong>Education</strong><br />
◗ Allocate state and local foundation program funds to<br />
each school in an equitable manner, based on needs <strong>of</strong><br />
the students and schools, as reflected in the current<br />
year’s actual student population.<br />
◗ <strong>Report</strong> annually to the State Board <strong>of</strong> <strong>Education</strong> on<br />
how all state/local funds for public education have<br />
been allocated. (Budgets and financial statements that<br />
are Funding, Program, and Cost Center Based).<br />
TOTAL UNITS EARNED<br />
Total Units = Teacher Units Earned + Instructional<br />
Support Units Earned<br />
◗ Principals<br />
◗ Assistant Principals<br />
◗ Counselors<br />
◗ Librarians<br />
Teacher Units<br />
◗ ADM – first 40 days (by school and grade)<br />
◗ Grade Divisors<br />
• K-3 = 14<br />
• 4-6 = 22<br />
• 7-8 = 21<br />
• 9-12 = 18<br />
Instructional Support Units<br />
◗ Average Daily Membership – first 40 days (by<br />
school and grade)<br />
◗ Accreditation standards used in determining instructional<br />
support units earned<br />
• Principals<br />
• Assistant Principals<br />
• Counselors<br />
• Librarians<br />
◗ Area Vocational Centers<br />
• Vocational <strong>Education</strong> Directors<br />
• Vocational <strong>Education</strong> Counselors<br />
DETERMINING THE COST<br />
◗ Salaries/Total Units<br />
• Convert units to dollars using the minimum salary<br />
schedule (180 day contracts)<br />
• Salary funds earned must be used for instructional<br />
salaries<br />
◗ Fringe/Total Units<br />
• PEEHIP (Health Insurance)<br />
• Retirement<br />
• Medicare<br />
• FICA<br />
• Unemployment Compensation<br />
• Leave (personal, sick)<br />
◗ Other Current Expense (OCE)<br />
• Amount per unit ($12,054 for FY 01)<br />
• Purpose:<br />
- School non-instructional staff salaries and<br />
fringes<br />
- Excludes bus drivers<br />
- School operating costs<br />
- Central <strong>of</strong>fice costs other than transportation<br />
- Fringe benefits and pay increases for Child<br />
Nutrition personnel<br />
32
◗<br />
Classroom Instructional Support<br />
• Teacher materials and supplies<br />
• Technology<br />
• Library Enhancement<br />
• Pr<strong>of</strong>essional Development<br />
• Textbooks<br />
$525/unit<br />
$181/unit<br />
$135/unit<br />
$60/unit<br />
$57.50/ADM<br />
ALLOCATION OF FUNDS<br />
◗ Local effort required contribution = 10 mills<br />
◗ State funds = total Foundation Program cost – local<br />
effort (10 mills)<br />
CURRENT UNITS – ($$$ for growth)<br />
◗ Projections are calculated for budgeting purposes in the<br />
appropriation bill using the previous 2 years’ average<br />
daily membership and average Foundation Program<br />
cost per unit.<br />
◗ Actual allocations are made in December based on the<br />
increase in the current year over the prior year average<br />
daily membership using the average Foundation<br />
Program unit cost.<br />
BUDGET CONSTRAINTS<br />
◗ Classroom teachers must be paid at least 100% <strong>of</strong> the<br />
salary matrix<br />
◗ Salaries expended from foundation program funds<br />
must be as large as salaries calculated in cost <strong>of</strong><br />
foundation program.<br />
◗ Expenditures for vocational/technical education must<br />
be at least = FY 1995<br />
◗ Expenditures for classroom materials and supplies<br />
must be budgeted for all teachers at same amount per<br />
unit as foundation program.<br />
◗ Expenditures for textbooks must be budgeted for all<br />
current year students at the amount per ADM as foundation<br />
program.<br />
◗ Expenditures for technology, library enhancement, and<br />
pr<strong>of</strong>essional development must be budgeted based on<br />
the number <strong>of</strong> current year teachers at the amount<br />
calculated in the Foundation Program.<br />
PUBLIC SCHOOL FUND<br />
◗ Hold Harmless<br />
• No system shall receive less state Foundation<br />
Program dollars per student than in FY 1995.<br />
CAPITAL PROJECTS<br />
◗ Remaining Public School Fund (PSF) funds until<br />
hold harmless phases out<br />
◗ May be used on:<br />
1. Facilities<br />
2. <strong>Education</strong>al technology and equipment<br />
◗ Long range capital plan required<br />
◗ Requires local fund match based on yield per mill<br />
per ADM <strong>of</strong> district ad valorem property tax<br />
TRANSPORTATION<br />
◗ Allocates funds equitably based on statewide<br />
averages for cost per student and cost per mile<br />
◗ Designates specific funds set aside for fleet renewal<br />
ACCOUNTABILITY<br />
◗ Must be fiscally accountable<br />
◗ <strong>Annual</strong> financial documents<br />
• <strong>Annual</strong> budgets<br />
• Financial statements<br />
• Cost center based<br />
• Program based<br />
• Funding source based<br />
◗ State BOE directed to require, approve, and audit<br />
budgets, financial statements and other necessary<br />
reports to assess financial stability<br />
◗ State BOE will provide assistance if fiscally unsound<br />
◗ <strong>Annual</strong> Accountability <strong>Report</strong>s to the public<br />
including, but not limited to<br />
• Funding and expenditure report<br />
• Student achievement report<br />
• School safety and discipline report<br />
◗ Principals and teachers must be given opportunity to<br />
participate in decisions during budget development<br />
concerning the expenditure <strong>of</strong> classroom instructional<br />
support funds<br />
Local <strong>Education</strong> Agencies<br />
33
Local <strong>Education</strong> Agencies<br />
STATE ALLOCATIONS FY <strong>2001</strong><br />
FOUNDATION PROGRAM UNITS<br />
Teachers 42,054.91<br />
Principals 1,252.50<br />
Assistant Principals 574.00<br />
Counselors 1,241.50<br />
Librarians 1,538.00<br />
Voc Ed Directors 73.00<br />
Voc Ed Counselors 54.29<br />
TOTAL UNITS 46,788.20<br />
FOUNDATION PROGRAM (STATE AND LOCAL FUNDS)<br />
Salaries 1,720,003,352<br />
Fringe Benefits 448,632,724<br />
Other Current Expense ($12,054/unit) 564,007,356<br />
Classroom Instructional Support<br />
Teacher Materials and Supplies ($525/unit) 24,563,822<br />
Technology ($181/unit) 8,468,669<br />
Library Enhancement ($135/unit) 6,316,425<br />
Pr<strong>of</strong>essional Development ($60/unit) 2,807,264<br />
Textbooks ($52.50/adm) 42,128,023<br />
TOTAL FOUNDATION PROGRAM 2,816,927,635<br />
STATE FUNDS<br />
Foundation Program - ETF 2,552,652,605<br />
School Nurses Program 6,030,560<br />
High Hopes 5,975,000<br />
Salaries - 1% per Act 97-238 17,200,024<br />
Transportation<br />
Operating Allocation 167,070,617<br />
Fleet Renewal ($4,600/bus) 25,787,600<br />
Hold Harmless * 8,993,593<br />
Current Units (ACTUAL) ($59,306/unit) * 17,224,837<br />
Capital Purchase * 83,006,410<br />
At Risk 31,746,700<br />
Preschool Program 2,242,864<br />
TOTAL STATE FUNDS 2,917,930,810<br />
LOCAL FUNDS<br />
Foundation Program (10 Mills) 264,275,030<br />
Capital Purchase (.768588 Mills) 20,311,849<br />
TOTAL LOCAL FUNDS 284,586,879<br />
34
Local <strong>Education</strong> AGencies<br />
COMBINED STATEMENT OF REVENUES<br />
STATEWIDE<br />
COMBINED STATEMENT OF REVENUES, EXPENDITURES, AND CHANGES IN FUND<br />
BALANCES ALL GOVERNMENTAL FUND TYPES AND EXPENDABLE TRUST FUNDS<br />
FOR FISCAL YEAR ENDED SEPTEMBER 30, <strong>2001</strong><br />
GOVERNMENTAL FIDUCIARY<br />
SPECIAL DEBT CAPITAL EXPENDABLE TOTAL<br />
DESCRIPTION GENERAL REVENUE SERVICE PROJECTS TRUST (MEMO ONLY)<br />
REVENUES:<br />
STATE SOURCES 2,711,577,820.31 1,425,962.49 6,744,147.38 159,440,328.99 568,638.64 2,879,756,897.81<br />
FEDERAL SOURCES 7,367,911.49 457,896,582.21 250,000.00 2,543.67 465,517,037.37<br />
LOCAL SOURCES 9 48,643,856.64 352,287,178.89 20,474,040.15 80,691,875.98 59,909,881.32 1,462,006,832.98<br />
OTHER SOURCES 11,636,153.25 9,395,360.46 4,044,879.30 2,905,510.44 2,570.00 27,984,473.45<br />
TOTAL REVENUES: 3,679,225,741.69 821,005,084.05 31,263,066.83 243,287,715.41 60,483,633.63 4,835,265,241.61<br />
EXPENDITURES:<br />
INSTRUCTIONAL SERVICES 2,350,868,212.63 283,560,661.35 0.00 27,081,903.02 20,853,754.09 2,682,364,531.09<br />
INSTRUCTIONAL SUPPORT SERVICES 522,298,119.45 91,405,173.12 0.00 1,608,064.68 10,928,721.34 626,240,078.59<br />
OPERATION & MAINTENANCE SERVICES 331,213,652.93 35,576,461.92 0.00 13,696,238.38 688,770.72 381,175,123.95<br />
AUXILIARY SERVICES 200,371,763.90 312,722,629.24 0.00 15,315,323.37 1,351,252.06 529,760,968.57<br />
GENERAL ADMINISTRATIVE SERVICES 147,015,122.79 29,866,462.92 6,976.30 4,205,475.96 47,324.55 181,141,362.52<br />
CAPITAL OUTLAY - REAL PROPERTY 20,947,509.86 6,637,934.24 124,508.47 435,209,834.32 479,766.92 463,399,553.81<br />
DEBT SERVICE 22,981,776.10 11,337,468.80 119,004,240.47 32,646,911.31 118,610.13 186,089,006.81<br />
OTHER EXPENDITURES 31,000,401.48 78,025,672.09 0.00 1,097,726.63 22,184,579.28 132,308,379.48<br />
TOTAL EXPENDITURES: 3,626,696,559.14 849,132,463.68 119,135,725.24 530,861,477.67 56,652,779.09 5,182,479,004.82<br />
OTHER FINANCING SOURCES (USES):<br />
Transfers In 86,656,886.45 128,792,094.01 105,721,698.70 38,941,778.38 4,390,098.63 364,502,556.17<br />
Other Financing Sources 60,420,586.81 10,037,897.15 140.62 288,876,484.44 76,592.17 359,411,701.19<br />
Transfer Out 208,658,489.67 100,383,620.86 5,267,764.56 44,666,070.45 5,969,515.13 364,945,460.67<br />
Other Fund Uses 641,919.77 218,644.25 816,100.00 8,143.27 1,684,807.29<br />
TOTAL OTHER FINANCING SOURCES (USES): -62,222,936.18 38,227,726.05 100,454,074.76 282,336,092.37 -1,510,967.60 357,283,989.40<br />
EXCESS REVENUE & OTHER OVER (UNDER) -9,693,753.63 10,100,346.42 12,581,416.35 -5,237,669.89 2,319,886.94 10,070,226.19<br />
EXPENDITURES AND OTHER USES<br />
BEGINNING FUND BALANCE - OCT 1 319,329,540.71 237,112,499.53 46,520,946.14 559,174,872.79 27,697,701.96 1,189,835,561.13<br />
ENDING FUND BALANCE - SEPT 30 309,635,787.08 247,212,845.95 59,102,362.49 553,937,202.90 30,017,588.90 1,199,905,787.32<br />
35
Local <strong>Education</strong> Agencies<br />
SCHOOL SYSTEM REVENUES – FY <strong>2001</strong><br />
Sys System Name ADM State Revenues Local Revenues** Federal Revenues<br />
001 AUTAUGA COUNTY 8,603.30 34,416,477.03 12,470,344.91 4,044,840.34<br />
002 BALDWIN COUNTY 22,598.51 79,084,895.37 65,068,793.08 9,654,663.94<br />
003 BARBOUR COUNTY 1,603.26 7,463,804.04 1,560,301.26 1,881,486.13<br />
004 BIBB COUNTY 3,616.19 16,887,488.43 3,296,746.87 2,864,230.28<br />
005 BLOUNT COUNTY 7,283.02 29,603,610.92 9,602,498.99 3,179,865.07<br />
006 BULLOCK COUNTY 1,976.33 7,824,135.28 1,695,363.90 2,309,917.38<br />
007 BUTLER COUNTY 3,621.54 14,541,381.46 3,791,633.59 4,192,285.87<br />
008 CALHOUN COUNTY 9,595.69 39,120,198.03 12,114,707.18 4,853,749.78<br />
009 CHAMBERS COUNTY 4,312.37 16,490,407.25 6,141,801.33 3,299,532.58<br />
010 CHEROKEE COUNTY 3,921.88 15,999,786.41 6,380,938.80 2,001,717.71<br />
011 CHILTON COUNTY 6,804.95 26,244,947.21 9,552,993.06 3,489,540.62<br />
012 CHOCTAW COUNTY 2,264.19 9,376,317.19 3,231,364.16 2,443,064.49<br />
013 CLARKE COUNTY 3,585.67 14,475,018.97 5,226,530.39 3,218,809.44<br />
014 CLAY COUNTY 2,419.22 12,082,116.81 3,008,833.03 1,373,756.90<br />
015 CLEBURNE COUNTY 2,552.48 10,719,997.57 2,694,999.09 1,402,115.13<br />
016 COFFEE COUNTY 1,976.71 8,035,839.67 2,965,202.26 1,385,254.80<br />
017 COLBERT COUNTY 3,336.70 14,088,836.91 7,004,717.14 2,013,877.67<br />
018 CONECUH COUNTY 2,106.95 8,605,924.07 2,236,108.03 2,107,549.02<br />
019 COOSA COUNTY 1,730.07 6,996,300.41 1,825,900.55 1,256,702.85<br />
020 COVINGTON COUNTY 3,276.75 13,358,688.29 4,695,900.44 2,413,741.07<br />
021 CRENSHAW COUNTY 2,400.84 9,838,348.31 2,817,758.86 1,624,229.92<br />
022 CULLMAN COUNTY 9,529.47 41,719,924.45 12,668,233.65 5,025,703.88<br />
023 DALE COUNTY 2,697.09 10,502,881.59 3,546,255.15 1,400,530.20<br />
024 DALLAS COUNTY 4,797.38 20,284,278.58 3,952,613.29 4,392,381.46<br />
025 DEKALB COUNTY 7,783.89 34,342,949.08 11,278,779.10 5,300,225.91<br />
026 ELMORE COUNTY 10,472.81 40,468,128.07 11,859,769.22 4,054,919.19<br />
027 ESCAMBIA COUNTY 4,822.30 19,637,309.98 9,632,050.50 4,109,381.26<br />
028 ETOWAH COUNTY 8,466.38 34,734,139.79 11,107,385.69 3,683,242.39<br />
029 FAYETTE COUNTY 2,771.27 11,931,342.97 3,650,667.77 1,410,359.52<br />
030 FRANKLIN COUNTY 3,154.55 13,143,013.41 4,660,254.02 1,779,814.23<br />
031 GENEVA COUNTY 2,787.49 11,301,726.36 2,728,206.04 1,846,257.35<br />
032 GREENE COUNTY 1,750.08 8,788,496.14 1,904,137.40 2,697,979.19<br />
033 HALE COUNTY 3,346.34 13,710,031.89 3,360,779.56 3,134,565.86<br />
034 HENRY COUNTY 2,796.26 11,385,711.95 3,507,178.73 1,906,102.96<br />
035 HOUSTON COUNTY 6,155.09 21,831,004.41 9,859,874.87 3,432,394.30<br />
036 JACKSON COUNTY 6,232.61 26,113,360.58 11,387,842.12 3,566,972.36<br />
037 JEFFERSON COUNTY 40,863.47 156,105,221.47 93,474,207.22 18,909,733.98<br />
038 LAMAR COUNTY 2,692.16 13,279,022.93 4,065,557.75 1,772,504.67<br />
039 LAUDERDALE COUNTY 8,715.96 35,062,082.78 15,834,082.01 3,301,799.42<br />
040 LAWRENCE COUNTY 6,170.79 25,420,012.41 9,357,894.78 4,149,593.77<br />
041 LEE COUNTY 9,064.31 36,153,512.86 18,467,544.41 3,578,106.58<br />
042 LIMESTONE COUNTY 7,916.78 31,699,215.05 17,270,721.04 3,065,282.19<br />
043 LOWNDES COUNTY 2,656.05 11,647,911.80 3,715,470.05 5,139,693.50<br />
044 MACON COUNTY 3,935.07 16,750,344.63 3,984,905.94 3,853,543.64<br />
045 MADISON COUNTY 15,720.73 61,170,728.07 32,765,578.92 5,144,076.34<br />
046 MARENGO COUNTY 1,758.83 8,269,244.37 2,034,364.99 1,826,830.60<br />
047 MARION COUNTY 3,838.63 15,550,095.26 5,139,218.77 1,889,306.22<br />
048 MARSHALL COUNTY 6,966.14 30,223,111.27 15,034,812.88 4,043,560.90<br />
049 MOBILE COUNTY 65,708.17 245,317,963.78 100,625,912.32 52,275,028.88<br />
050 MONROE COUNTY 4,450.81 19,040,328.53 5,378,875.21 3,226,308.26<br />
051 MONTGOMERY COUNTY 33,290.43 127,122,464.42 54,618,090.22 27,824,617.30<br />
052 MORGAN COUNTY 7,422.39 32,617,664.18 21,437,962.35 3,474,819.99<br />
053 PERRY COUNTY 2,293.79 9,519,092.69 1,874,575.00 3,014,495.63<br />
054 PICKENS COUNTY 3,704.46 15,905,359.31 4,259,327.02 2,911,906.74<br />
055 PIKE COUNTY 2,226.26 9,437,411.08 2,948,523.50 3,237,786.04<br />
056 RANDOLPH COUNTY 2,249.84 8,868,152.12 2,893,985.55 1,219,957.10<br />
057 RUSSELL COUNTY 3,867.91 15,292,224.10 5,277,120.10 2,816,977.85<br />
058 SAINT CLAIR COUNTY 7,061.74 28,317,390.27 10,079,587.38 3,006,156.58<br />
059 SHELBY COUNTY 20,243.25 75,917,097.17 70,784,470.70 7,418,249.18<br />
060 SUMTER COUNTY 2,785.39 11,756,285.66 3,361,451.05 4,635,496.40<br />
061 TALLADEGA COUNTY 7,867.83 31,050,480.67 11,634,270.90 5,455,174.56<br />
062 TALLAPOOSA COUNTY 3,372.11 13,021,522.42 5,520,212.87 2,030,234.55<br />
063 TUSCALOOSA COUNTY 15,781.67 60,334,164.13 29,258,404.07 7,736,036.87<br />
064 WALKER COUNTY 8,302.73 36,469,510.22 15,319,225.06 6,504,139.56<br />
065 WASHINGTON COUNTY 3,596.90 13,353,561.17 5,977,908.69 2,511,507.55<br />
066 WILCOX COUNTY 2,513.92 10,563,661.12 2,721,587.79 3,814,574.20<br />
067 WINSTON COUNTY 2,839.46 12,082,425.85 4,815,770.29 1,634,630.90<br />
101 ALBERTVILLE CITY 3,496.21 14,863,172.16 4,962,516.70 1,741,692.52<br />
102 ALEX. CITY 3,575.40 14,051,238.27 6,255,614.52 1,518,892.61<br />
36
Other Total State Revenue Rank by Local Revenue Rank by Federal Revenue Rank by<br />
Revenues Revenues Per ADM State/ADM Per ADM Local/ADM Per ADM Federal/ADM<br />
5,115,781.44 56,047,443.72 4,000.38 78 1,449.48 71 470.15 101<br />
4,124,944.05 157,933,296.44 3,499.56 126 2,879.34 14 427.23 109<br />
348,349.96 11,253,941.39 4,655.39 9 973.21 124 1,173.54 9<br />
166,116.50 23,214,582.08 4,669.97 8 911.66 125 792.06 32<br />
8,365,325.56 50,751,300.54 4,064.74 63 1,318.48 94 436.61 106<br />
204,116.13 12,033,532.69 3,958.92 83 857.83 126 1,168.79 10<br />
271,832.20 22,797,133.12 4,015.25 74 1,046.97 119 1,157.60 11<br />
645,568.27 56,734,223.26 4,076.85 58 1,262.52 100 505.83 92<br />
3,028,148.13 28,959,889.29 3,823.98 102 1,424.23 79 765.13 36<br />
858,428.37 25,240,871.29 4,079.62 57 1,627.01 57 510.40 89<br />
470,026.97 39,757,507.86 3,856.74 100 1,403.83 82 512.79 88<br />
151,078.45 15,201,824.29 4,141.14 47 1,427.16 77 1,079.00 13<br />
208,389.79 23,128,748.59 4,036.91 69 1,457.62 70 897.69 22<br />
412,491.77 16,877,198.51 4,994.22 3 1,243.72 102 567.85 76<br />
669,468.65 15,486,580.44 4,199.84 41 1,055.84 117 549.31 79<br />
108,612.83 12,494,909.56 4,065.26 62 1,500.07 66 700.79 46<br />
145,826.42 23,253,258.14 4,222.39 37 2,099.29 32 603.55 66<br />
679,695.94 13,629,277.06 4,084.54 56 1,061.30 116 1,000.28 17<br />
114,627.24 10,193,531.05 4,043.94 68 1,055.39 118 726.39 44<br />
179,244.55 20,647,574.35 4,076.81 59 1,433.10 75 736.63 42<br />
724,246.20 15,004,583.29 4,097.88 53 1,173.66 105 676.53 54<br />
2,393,487.00 61,807,348.98 4,377.99 19 1,329.37 91 527.39 82<br />
482,594.47 15,932,261.41 3,894.15 92 1,314.84 96 519.27 84<br />
401,619.77 29,030,893.10 4,228.20 36 823.91 127 915.58 21<br />
359,415.67 51,281,369.76 4,412.05 15 1,448.99 72 680.92 53<br />
233,743.92 56,616,560.40 3,864.11 96 1,132.43 112 387.19 115<br />
277,329.33 33,656,071.07 4,072.19 60 1,997.40 35 852.16 26<br />
2,539,002.65 52,063,770.52 4,102.60 51 1,311.94 97 435.04 107<br />
172,557.70 17,164,927.96 4,305.37 23 1,317.33 95 508.92 90<br />
372,344.32 19,955,425.98 4,166.37 45 1,477.31 68 564.21 77<br />
234,481.32 16,110,671.07 4,054.45 66 978.73 123 662.34 60<br />
773,276.98 14,163,889.71 5,021.77 2 1,088.03 114 1,541.63 3<br />
2,208,040.13 22,413,417.44 4,097.02 54 1,004.32 121 936.71 19<br />
3,332,796.86 20,131,790.50 4,071.76 61 1,254.24 101 681.66 52<br />
9,976,536.83 45,099,810.41 3,546.82 125 1,601.91 58 557.65 78<br />
1,911,333.85 42,979,508.91 4,189.80 43 1,827.14 40 572.31 74<br />
4,130,837.37 272,620,000.04 3,820.17 104 2,287.48 25 462.75 104<br />
3,921,496.33 23,038,581.68 4,932.48 4 1,510.15 64 658.39 62<br />
495,251.74 54,693,215.95 4,022.74 73 1,816.68 41 378.82 117<br />
724,161.32 39,651,662.28 4,119.41 50 1,516.48 63 672.46 56<br />
2,234,663.50 60,433,827.35 3,988.56 81 2,037.39 34 394.75 113<br />
341,857.34 52,377,075.62 4,004.05 77 2,181.53 27 387.19 114<br />
2,217,178.21 22,720,253.56 4,385.43 18 1,398.87 84 1,935.09 1<br />
307,225.50 24,896,019.71 4,256.68 28 1,012.66 120 979.28 18<br />
16,505,752.38 115,586,135.71 3,891.09 93 2,084.23 33 327.22 120<br />
274,569.05 12,405,009.01 4,701.56 7 1,156.66 109 1,038.66 15<br />
169,649.07 22,748,269.32 4,050.95 67 1,338.82 88 492.18 96<br />
3,228,469.14 52,529,954.19 4,338.57 22 2,158.27 30 580.46 71<br />
104,211,141.65 502,430,046.63 3,733.45 114 1,531.41 61 795.56 31<br />
893,038.09 28,538,550.09 4,277.95 26 1,208.52 103 724.88 45<br />
2,397,663.28 211,962,835.22 3,818.59 105 1,640.65 55 835.81 28<br />
399,757.60 57,930,204.12 4,394.50 16 2,888.28 13 468.15 103<br />
242,170.99 14,650,334.31 4,149.94 46 817.24 128 1,314.20 7<br />
172,724.43 23,249,317.50 4,293.57 24 1,149.78 110 786.05 33<br />
575,140.68 16,198,861.30 4,239.13 34 1,324.43 93 1,454.36 5<br />
226,532.43 13,208,627.20 3,941.68 87 1,286.31 99 542.24 81<br />
967,622.09 24,353,944.14 3,953.61 84 1,364.33 87 728.29 43<br />
291,210.00 41,694,344.23 4,009.97 75 1,427.35 76 425.70 110<br />
24,591,407.61 178,711,224.66 3,750.24 112 3,496.69 6 366.46 118<br />
453,434.24 20,206,667.35 4,220.70 38 1,206.82 104 1,664.22 2<br />
515,840.13 48,655,766.26 3,946.51 86 1,478.71 67 693.35 48<br />
95,752.96 20,667,722.80 3,861.54 98 1,637.02 56 602.07 67<br />
16,210,445.07 113,539,050.14 3,823.05 103 1,853.95 38 490.19 98<br />
3,217,726.26 61,510,601.10 4,392.47 17 1,845.08 39 783.37 35<br />
557,302.01 22,400,279.42 3,712.52 115 1,661.96 54 698.24 47<br />
361,060.02 17,460,883.13 4,202.07 40 1,082.61 115 1,517.38 4<br />
3,691,367.74 22,224,194.78 4,255.18 30 1,696.02 52 575.68 72<br />
2,667,823.11 24,235,204.49 4,251.22 31 1,419.40 80 498.17 93<br />
1,315,293.76 23,141,039.16 3,929.98 88 1,749.63 47 424.82 111<br />
Local <strong>Education</strong> Agencies<br />
37
Local <strong>Education</strong> Agencies<br />
SCHOOL SYSTEM REVENUES – FY <strong>2001</strong><br />
Sys System Name ADM State Revenues Local Revenues** Federal Revenues<br />
104 ANDALUSIA CITY 1,771.15 7,745,989.47 4,084,125.59 1,171,283.96<br />
105 ANNISTON CITY 2,782.32 10,993,541.01 3,891,676.47 3,410,692.99<br />
106 ARAB CITY 2,654.08 10,692,084.35 4,202,320.25 772,576.46<br />
107 ATHENS CITY 2,832.67 10,152,253.00 9,003,249.01 1,373,112.11<br />
109 ATTALLA CITY 1,983.48 8,940,653.44 2,845,474.13 1,234,674.91<br />
110 AUBURN CITY 4,419.64 16,615,256.86 13,344,070.61 3,351,438.78<br />
113 BESSEMER CITY 4,612.29 18,051,324.38 8,026,455.97 4,824,706.02<br />
114 BIRMINGHAM CITY 38,103.09 136,864,902.27 82,963,783.09 32,367,607.46<br />
116 BREWTON CITY 1,370.51 5,648,178.20 4,594,511.60 615,833.10<br />
125 CULLMAN CITY 2,682.94 9,540,839.74 6,111,813.39 1,811,170.03<br />
126 DALEVILLE CITY 1,653.53 7,223,655.08 1,630,476.19 1,478,697.25<br />
127 DECATUR CITY 8,947.46 33,555,600.76 31,666,094.37 4,413,185.62<br />
128 DEMOPOLIS CITY 2,316.91 8,944,924.86 3,248,099.65 1,603,014.75<br />
130 DOTHAN CITY 8,780.22 34,361,141.29 15,177,515.77 7,208,711.88<br />
131 ELBA CITY 1,033.08 4,428,220.56 1,496,063.03 706,033.59<br />
132 ENTERPRISE CITY 5,020.03 21,270,722.37 8,566,438.06 2,643,856.28<br />
133 EUFAULA CITY 3,066.86 11,554,311.66 5,481,955.33 1,814,429.72<br />
137 FAIRFIELD CITY 2,416.41 9,661,635.31 3,648,149.98 1,943,380.34<br />
141 FLORENCE CITY 4,417.19 17,095,241.97 15,162,170.57 3,863,804.96<br />
143 FORT PAYNE CITY 2,624.25 10,754,213.07 4,398,345.40 1,433,923.24<br />
144 GADSDEN CITY 5,530.49 20,217,679.09 9,633,761.66 4,916,882.34<br />
146 GENEVA CITY 1,364.01 6,418,269.20 2,083,273.62 702,580.55<br />
154 GUNTERSVILLE CITY 1,825.56 7,690,487.16 4,379,227.48 787,412.30<br />
155 HALEYVILLE CITY 1,690.63 6,807,673.01 2,972,160.52 799,495.48<br />
156 HARTSELLE CITY 3,027.96 15,332,116.07 5,983,250.77 803,972.87<br />
157 HOMEWOOD CITY 3,175.27 10,946,861.03 20,191,554.31 899,542.80<br />
158 HOOVER CITY 9,793.98 37,939,618.75 62,274,278.38 1,884,952.56<br />
159 HUNTSVILLE CITY 22,707.45 81,423,033.74 68,586,951.95 12,970,204.98<br />
162 JACKSONVILLE CITY 1,701.25 6,222,732.77 1,940,574.74 681,139.36<br />
163 JASPER CITY 2,568.61 9,687,234.77 6,623,707.71 1,203,369.32<br />
165 LANETT CITY 1,237.70 5,464,672.08 1,622,341.15 1,158,409.23<br />
168 LINDEN CITY 650.46 3,072,171.64 948,580.79 939,006.21<br />
169 MADISON CITY 6,023.77 22,704,211.60 16,204,897.33 1,493,400.90<br />
171 MIDFIELD CITY 1,184.56 4,776,819.06 1,675,758.87 791,970.32<br />
175 MT. BROOK CITY 3,938.96 15,218,364.95 22,753,326.75 480,673.88<br />
176 MUSCLE SHOALS CITY 2,406.69 8,862,687.83 6,381,510.16 657,873.57<br />
178 ONEONTA CITY 1,216.00 4,755,772.46 2,176,139.26 462,537.44<br />
179 OPELIKA CITY 4,615.89 17,274,128.69 9,803,493.41 2,751,101.15<br />
180 OPP CITY 1,429.23 6,317,659.46 1,994,597.91 819,187.19<br />
181 OXFORD CITY 3,125.16 12,385,245.88 4,971,912.07 1,129,063.78<br />
182 OZARK CITY 2,993.69 11,988,063.35 4,004,886.71 2,069,470.68<br />
183 PELL CITY CITY 3,914.77 14,984,884.32 5,240,538.55 2,477,153.67<br />
184 PHENIX CITY CITY 4,929.25 20,907,213.34 9,256,025.15 4,959,379.17<br />
185 PIEDMONT CITY 1,078.86 4,800,249.69 1,252,750.35 673,673.01<br />
188 ROANOKE CITY 1,511.33 6,432,260.11 1,753,454.46 891,336.33<br />
189 RUSSELLVILLE CITY 2,381.64 9,512,826.20 4,178,755.71 1,169,130.43<br />
190 SCOTTSBORO CITY 2,802.57 12,687,491.45 7,035,695.97 1,391,170.41<br />
191 SELMA CITY 4,195.86 17,358,276.00 4,743,118.20 4,762,623.94<br />
192 SHEFFIELD CITY 1,403.06 5,747,339.76 3,591,582.41 1,036,044.71<br />
193 SYLACAUGA CITY 2,260.92 9,491,429.63 5,415,321.72 1,511,653.45<br />
194 TALLADEGA CITY 3,117.77 13,325,058.38 4,449,514.59 2,368,494.25<br />
195 TALLASSEE CITY 1,838.29 6,721,934.78 2,151,916.74 943,806.15<br />
197 TARRANT CITY CITY 1,320.83 5,035,556.10 3,268,494.74 881,008.66<br />
198 THOMASVILLE CITY 1,679.84 7,035,012.82 2,231,835.96 854,497.47<br />
199 TROY CITY 2,295.09 8,365,102.79 4,061,704.27 1,728,904.68<br />
200 TUSCALOOSA CITY 9,599.29 40,702,655.69 28,092,719.42 7,540,469.25<br />
201 TUSCUMBIA CITY 1,417.56 5,759,093.85 3,062,291.78 735,161.33<br />
202 VESTAVIA HILLS CITY 4,448.45 14,778,123.16 18,504,704.89 759,577.82<br />
204 WINFIELD CITY 1,264.31 5,131,706.40 3,330,219.98 954,096.15<br />
COUNTIES TOTAL /AVERAGE 487,027.61 1,932,466,080.67 852,419,082.86 310,173,891.00<br />
CITIES TOTAL/AVERAGE 244,226.73 947,290,817.14 609,587,750.12 155,343,146.37<br />
STATE TOTAL/AVERAGE 731,254.34 2,879,756,897.81 1,462,006,832.98 465,517,037.37<br />
* Note: Based on data submitted to SDE by Local Boards <strong>of</strong> <strong>Education</strong>.<br />
** The required foundation program local match is included in local revenues.<br />
38
Other Total State Revenue Rank by Local Revenue Rank by Federal Revenue Rank by<br />
Revenues Revenues Per ADM State/ADM Per ADM Local/ADM Per ADM Federal/ADM<br />
606,739.84 13,608,138.86 4,373.42 20 2,305.92 24 661.31 61<br />
137,477.18 18,433,387.65 3,951.21 85 1,398.72 85 1,225.84 8<br />
11,397.13 15,678,378.19 4,028.55 71 1,583.34 60 291.09 121<br />
1,472,670.36 22,001,284.48 3,583.99 123 3,178.36 9 484.74 99<br />
3,125,536.43 16,146,338.91 4,507.56 11 1,434.59 74 622.48 65<br />
320,205.10 33,630,971.35 3,759.41 110 3,019.27 11 758.31 38<br />
1,227,061.52 32,129,547.89 3,913.74 89 1,740.23 49 1,046.05 14<br />
43,271,712.76 295,468,005.58 3,591.96 121 2,177.35 28 849.47 27<br />
23,969.65 10,882,492.55 4,121.22 49 3,352.41 8 449.35 105<br />
617,266.23 18,081,089.39 3,556.11 124 2,278.03 26 675.07 55<br />
47,988.22 10,380,816.74 4,368.63 21 986.06 122 894.27 23<br />
322,459.30 69,957,340.05 3,750.29 111 3,539.12 5 493.23 95<br />
383,839.82 14,179,879.08 3,860.71 99 1,401.91 83 691.88 49<br />
1,415,583.63 58,162,952.57 3,913.47 90 1,728.60 50 821.02 29<br />
87,563.91 6,717,881.09 4,286.43 25 1,448.16 73 683.43 51<br />
90,215.32 32,571,232.03 4,237.17 35 1,706.45 51 526.66 83<br />
155,375.97 19,006,072.68 3,767.47 109 1,787.48 43 591.62 69<br />
76,505.38 15,329,671.01 3,998.34 79 1,509.74 65 804.24 30<br />
434,795.10 36,556,012.60 3,870.16 95 3,432.54 7 874.72 25<br />
147,836.63 16,734,318.34 4,098.01 52 1,676.04 53 546.41 80<br />
842,569.19 35,610,892.28 3,655.68 119 1,741.94 48 889.05 24<br />
481,105.62 9,685,228.99 4,705.44 6 1,527.32 62 515.08 86<br />
11,504.89 12,868,631.83 4,212.67 39 2,398.84 22 431.33 108<br />
61,265.94 10,640,594.95 4,026.71 72 1,758.02 45 472.90 100<br />
582.77 22,119,922.48 5,063.51 1 1,976.00 36 265.52 124<br />
8,089,627.45 40,127,585.59 3,447.54 127 6,359.00 1 283.30 122<br />
35,786,319.47 137,885,169.16 3,873.77 94 6,358.42 2 192.46 126<br />
4,138,439.10 167,118,629.77 3,585.74 122 3,020.46 10 571.19 75<br />
128,866.54 8,973,313.41 3,657.74 117 1,140.68 111 400.38 112<br />
19,324.62 17,533,636.42 3,771.39 107 2,578.71 18 468.49 102<br />
111,140.69 8,356,563.15 4,415.18 14 1,310.77 98 935.94 20<br />
138,355.89 5,098,114.53 4,723.08 5 1,458.32 69 1,443.60 6<br />
6,304,745.18 46,707,255.01 3,769.10 108 2,690.16 15 247.92 125<br />
1,138,723.21 8,383,271.46 4,032.57 70 1,414.67 81 668.58 58<br />
113,080.31 38,565,445.89 3,863.55 97 5,776.48 3 122.03 128<br />
136,720.03 16,038,791.59 3,682.52 116 2,651.57 16 273.35 123<br />
25,268.80 7,419,717.96 3,911.00 91 1,789.59 42 380.38 116<br />
11,634,059.97 41,462,783.22 3,742.32 113 2,123.86 31 596.01 68<br />
139,068.51 9,270,513.07 4,420.32 13 1,395.58 86 573.17 73<br />
326,949.43 18,813,171.16 3,963.08 82 1,590.93 59 361.28 119<br />
135,828.98 18,198,249.72 4,004.44 76 1,337.78 90 691.28 50<br />
535,029.49 23,237,606.03 3,827.78 101 1,338.66 89 632.77 63<br />
541,544.69 35,664,162.35 4,241.46 32 1,877.78 37 1,006.11 16<br />
79,767.07 6,806,440.12 4,449.37 12 1,161.18 107 624.43 64<br />
130,202.60 9,207,253.50 4,256.03 29 1,160.21 108 589.77 70<br />
1,067,679.32 15,928,391.66 3,994.23 80 1,754.57 46 490.89 97<br />
1,528,756.79 22,643,114.62 4,527.09 10 2,510.44 20 496.39 94<br />
186,692.19 27,050,710.33 4,137.00 48 1,130.43 113 1,135.08 12<br />
2,110,230.74 12,485,197.62 4,096.29 55 2,559.82 19 738.42 41<br />
106,287.55 16,524,692.35 4,198.04 42 2,395.19 23 668.60 57<br />
285,884.19 20,428,951.41 4,273.91 27 1,427.15 78 759.68 37<br />
366,124.44 10,183,782.11 3,656.62 118 1,170.61 106 513.42 87<br />
135,979.37 9,321,038.87 3,812.42 106 2,474.58 21 667.01 59<br />
174,322.47 10,295,668.72 4,187.91 44 1,328.60 92 508.68 91<br />
1,860,585.69 16,016,297.43 3,644.78 120 1,769.74 44 753.31 40<br />
2,435,441.49 78,771,285.85 4,240.17 33 2,926.54 12 785.52 34<br />
64,135.88 9,620,682.84 4,062.68 64 2,160.26 29 518.61 85<br />
760,798.29 34,803,204.16 3,322.08 128 4,159.81 4 170.75 127<br />
20,520.99 9,436,543.52 4,058.90 65 2,634.02 17 754.64 39<br />
247,283,328.45 3,342,342,382.98 3,967.88 1,750.25 636.87<br />
140,112,846.19 1,852,334,559.82 3,878.74 2,495.99 636.06<br />
387,396,174.64 5,194,676,942.80 3,938.11 1,999.31 636.60<br />
Local <strong>Education</strong> Agencies<br />
39
Local <strong>Education</strong> Agencies<br />
SCHOOL SYSTEM REVENUES – FY <strong>2001</strong><br />
40
Local <strong>Education</strong> Agencies<br />
SYSTEM EXPENDITURES BY FUNCTION – FY <strong>2001</strong><br />
DEBT SERVICE<br />
3.6%<br />
OTHER EXPENDITURES<br />
2.6%<br />
CAPITAL OUTLAY<br />
8.9%<br />
ADMINISTRATION<br />
3.5%<br />
FOOD SERVICE<br />
6.0%<br />
TRANSPORTATION<br />
4.2%<br />
OPERATIONS AND MAINTENANCE<br />
7.4%<br />
INSTRUCTIONAL SUPPORT<br />
12.1%<br />
INSTRUCTION<br />
51.8%<br />
41
Local <strong>Education</strong> Agencies<br />
SYSTEM EXPENDITURES BY FUNCTION – FY <strong>2001</strong><br />
System Number/Name Instructional Instructional Operations and Transportation<br />
Services Support Maintenance Services<br />
AUTAUGA COUNTY 27,974,851.34 6,759,294.34 2,765,232.72 4,859,133.19<br />
BALDWIN COUNTY 84,465,078.17 21,609,575.25 12,199,927.08 6,441,024.65<br />
BARBOUR COUNTY 5,656,386.32 1,489,505.58 670,644.08 647,192.67<br />
BIBB COUNTY 12,447,368.34 2,875,976.09 1,144,878.95 1,151,422.79<br />
BLOUNT COUNTY 23,021,898.37 4,999,267.43 2,832,076.91 2,385,832.30<br />
BULLOCK COUNTY 6,866,400.97 1,701,641.65 771,822.87 729,829.19<br />
BUTLER COUNTY 13,260,197.61 3,228,424.38 1,469,430.77 1,243,846.05<br />
CALHOUN COUNTY 30,754,919.91 8,918,114.33 4,361,421.58 4,080,811.33<br />
CHAMBERS COUNTY 14,525,150.22 3,072,332.47 2,044,268.48 1,249,520.37<br />
CHEROKEE COUNTY 14,488,742.84 2,887,787.94 1,603,215.71 1,576,874.79<br />
CHILTON COUNTY 22,793,618.76 4,597,734.92 4,292,077.58 2,274,756.18<br />
CHOCTAW COUNTY 8,414,678.49 2,031,445.57 894,542.64 1,189,431.35<br />
CLARKE COUNTY 12,457,175.72 3,680,543.31 1,408,004.13 1,491,486.12<br />
CLAY COUNTY 8,611,453.08 1,577,349.68 781,573.62 990,898.25<br />
CLEBURNE COUNTY 8,778,099.11 1,915,832.92 827,896.30 881,209.95<br />
COFFEE COUNTY 7,147,297.74 1,670,823.36 648,989.37 711,961.67<br />
COLBERT COUNTY 12,564,942.71 2,604,878.54 1,960,254.62 1,366,096.14<br />
CONECUH COUNTY 7,396,656.94 1,591,589.29 1,060,887.95 1,097,063.15<br />
COOSA COUNTY 5,436,595.19 1,485,342.69 609,803.40 724,525.38<br />
COVINGTON COUNTY 11,435,739.57 2,295,107.15 1,433,743.59 1,490,572.05<br />
CRENSHAW COUNTY 8,143,035.02 1,680,458.60 820,055.27 828,456.68<br />
CULLMAN COUNTY 32,235,179.12 7,621,763.39 4,418,540.39 2,876,131.19<br />
DALE COUNTY 9,711,976.52 1,813,047.78 1,020,248.24 1,053,702.93<br />
DALLAS COUNTY 16,562,252.20 4,329,767.90 1,851,567.89 1,944,771.77<br />
DEKALB COUNTY 29,291,438.69 6,441,416.49 3,537,387.49 2,924,273.61<br />
ELMORE COUNTY 35,468,612.59 7,010,452.42 4,336,002.98 3,807,121.64<br />
ESCAMBIA COUNTY 18,090,376.61 4,588,687.03 2,522,482.20 2,560,184.65<br />
ETOWAH COUNTY 29,228,611.28 6,499,287.08 2,907,146.67 4,306,663.74<br />
FAYETTE COUNTY 9,681,237.88 1,836,638.22 1,258,633.83 1,000,297.27<br />
FRANKLIN COUNTY 11,514,640.70 2,008,111.25 1,369,021.72 1,598,880.20<br />
GENEVA COUNTY 9,437,119.25 2,099,832.20 913,873.39 806,838.16<br />
GREENE COUNTY 7,013,384.20 1,727,965.06 1,086,622.07 951,455.41<br />
HALE COUNTY 11,967,125.73 2,226,312.15 1,571,332.63 1,314,625.54<br />
HENRY COUNTY 10,173,548.32 2,027,124.84 1,089,872.03 1,002,453.86<br />
HOUSTON COUNTY 21,496,062.01 4,476,092.78 2,050,692.34 1,936,912.87<br />
JACKSON COUNTY 22,776,303.37 4,480,673.31 4,163,305.25 4,355,230.53<br />
JEFFERSON COUNTY 146,696,846.19 30,404,819.83 18,031,054.29 10,637,680.14<br />
LAMAR COUNTY 8,969,353.92 2,647,610.63 901,677.68 1,161,870.89<br />
LAUDERDALE COUNTY 31,352,150.64 6,255,364.77 4,527,891.40 2,506,937.83<br />
LAWRENCE COUNTY 22,772,427.24 5,069,889.60 3,266,395.31 2,543,032.34<br />
LEE COUNTY 32,207,297.74 6,863,654.33 4,402,729.83 2,989,322.00<br />
LIMESTONE COUNTY 30,948,690.37 5,287,345.24 3,665,696.52 2,672,203.77<br />
LOWNDES COUNTY 9,208,755.49 2,883,341.66 1,174,628.74 955,895.54<br />
MACON COUNTY 13,867,686.11 2,823,685.11 2,137,290.67 1,452,295.87<br />
MADISON COUNTY 54,064,449.46 13,149,731.22 8,277,285.78 5,422,335.34<br />
MARENGO COUNTY 6,309,532.41 1,299,838.86 728,644.94 1,316,223.47<br />
MARION COUNTY 13,939,783.90 2,801,676.52 1,340,948.22 1,170,684.96<br />
MARSHALL COUNTY 24,348,178.83 6,082,173.35 3,613,381.36 3,454,690.27<br />
MOBILE COUNTY 222,220,316.73 49,010,006.28 29,985,030.94 21,157,772.65<br />
MONROE COUNTY 16,121,244.85 3,847,749.87 1,591,239.16 1,691,247.89<br />
MONTGOMERY COUNTY 116,050,963.02 29,537,107.29 18,774,235.73 7,134,569.43<br />
MORGAN COUNTY 28,513,409.00 8,462,865.69 4,276,134.59 3,202,163.26<br />
PERRY COUNTY 8,185,401.90 1,390,367.13 745,579.18 813,485.02<br />
PICKENS COUNTY 13,803,998.51 3,128,576.01 1,633,864.15 1,347,431.45<br />
PIKE COUNTY 7,900,051.90 2,672,712.95 1,511,451.69 1,062,833.67<br />
RANDOLPH COUNTY 7,485,118.89 1,589,880.97 856,014.50 1,095,000.96<br />
RUSSELL COUNTY 13,204,185.60 2,773,245.59 1,762,272.39 2,287,714.84<br />
SAINT CLAIR COUNTY 22,671,901.08 4,432,498.43 2,556,781.76 2,056,703.78<br />
SHELBY COUNTY 77,548,075.94 22,283,813.40 10,738,919.60 8,653,808.13<br />
SUMTER COUNTY 11,175,806.91 2,247,603.29 1,281,899.24 1,271,100.07<br />
TALLADEGA COUNTY 25,296,410.78 8,108,173.62 3,710,165.17 2,830,165.22<br />
TALLAPOOSA COUNTY 12,820,532.92 2,082,738.89 1,487,970.80 1,096,120.67<br />
TUSCALOOSA COUNTY 58,625,988.34 11,193,285.54 6,652,305.91 4,514,972.80<br />
WALKER COUNTY 29,843,268.16 6,154,503.97 5,382,344.61 2,821,181.85<br />
42
Food Administrative Capital Debt Other Total<br />
Services Services Outlay Service Expenditures Expenditures<br />
3,010,599.77 1,010,786.54 3,192,731.03 3,868,047.40 796,331.56 54,237,007.89<br />
7,302,170.57 3,449,403.27 3,643,413.21 6,229,513.80 3,046,910.46 148,387,016.46<br />
1,064,527.15 539,738.97 108,884.98 507,190.35 554,553.25 11,238,623.35<br />
1,556,081.51 788,765.38 6,243,770.66 862,738.49 905,854.24 27,976,856.45<br />
3,020,338.12 1,310,143.11 2,217,829.84 785,010.33 917,993.10 41,490,389.51<br />
1,006,842.44 741,537.46 1,148,734.07 124,795.00 191,111.65 13,282,715.30<br />
1,591,644.36 892,587.61 1,157,143.55 908,013.09 868,466.77 24,619,754.19<br />
4,650,460.82 1,633,107.55 502,694.72 118,412.50 1,157,741.06 56,177,683.80<br />
1,711,883.01 1,171,110.31 6,013,812.36 1,479,689.30 802,728.06 32,070,494.58<br />
1,922,317.09 1,011,316.06 592,727.18 689,749.92 576,660.28 25,349,391.81<br />
3,006,845.73 1,203,214.30 2,198,384.91 850,714.38 1,158,159.10 42,375,505.86<br />
1,112,698.41 797,890.92 145,464.48 274,949.17 338,199.17 15,199,300.20<br />
1,930,165.55 562,323.42 166,960.05 1,086,365.86 757,142.47 23,540,166.63<br />
1,030,761.98 532,575.26 1,671,903.05 480,601.03 499,263.30 16,176,379.25<br />
1,222,423.46 643,665.35 1,770,383.46 248,254.00 195,210.77 16,482,975.32<br />
843,378.03 554,405.76 775,935.59 291,870.02 142,624.44 12,787,285.98<br />
1,528,609.78 972,718.31 2,085,525.48 725,484.18 987,093.59 24,795,603.35<br />
1,163,679.23 697,948.26 307,377.97 431,916.67 496,950.80 14,244,070.26<br />
829,923.95 554,917.67 152,147.32 99,217.32 255,440.35 10,147,913.27<br />
1,417,864.37 803,057.24 815,755.09 112,071.86 549,158.99 20,353,069.91<br />
1,084,990.51 695,388.97 1,573,714.03 325,104.99 391,054.85 15,542,258.92<br />
4,069,446.84 1,574,697.14 10,227,313.23 1,300,032.40 1,217,040.00 65,540,143.70<br />
903,466.33 883,321.00 1,632,764.67 690,751.33 289,170.11 17,998,448.91<br />
2,070,210.36 1,057,534.87 101,847.92 751,699.15 438,541.44 29,108,193.50<br />
3,696,254.25 1,896,106.74 5,703,033.36 489,171.01 1,036,822.17 55,015,903.81<br />
3,096,019.80 1,658,493.70 4,682,689.94 1,315,169.60 1,533,393.40 62,907,956.07<br />
2,088,917.61 1,348,838.80 4,068,165.77 661,762.50 509,271.70 36,438,686.87<br />
3,323,026.20 1,521,789.24 2,635,242.09 1,515,050.01 850,042.34 52,786,858.65<br />
1,225,109.92 720,278.67 955,102.37 585,535.43 307,710.09 17,570,543.68<br />
1,392,564.39 746,138.18 525,267.11 469,265.00 754,403.27 20,378,291.82<br />
1,342,828.24 617,566.01 1,779,136.95 615,983.39 512,411.14 18,125,588.73<br />
1,349,100.29 499,168.81 1,443,706.97 179,978.39 239,023.86 14,490,405.06<br />
1,552,689.66 873,238.20 1,139,663.74 428,434.78 655,874.55 21,729,296.98<br />
1,453,003.80 680,840.19 310,649.76 1,776,007.61 442,735.66 18,956,236.07<br />
3,025,247.43 1,322,404.62 2,624,902.80 1,012,429.92 598,620.90 38,543,365.67<br />
3,287,236.54 1,190,645.90 1,750,226.78 250,339.00 854,565.58 43,108,526.26<br />
16,099,516.37 8,603,562.35 8,555,209.00 16,559,039.69 12,155,085.90 267,742,813.76<br />
1,390,221.48 597,115.94 5,775,502.83 824,953.71 1,018,537.50 23,286,844.58<br />
3,489,353.36 1,679,721.41 3,280,944.35 735,921.68 1,080,751.26 54,909,036.70<br />
2,684,184.73 1,632,954.01 2,328,499.66 468,966.07 1,424,711.71 42,191,060.67<br />
3,920,143.04 1,315,970.22 8,813,207.86 2,678,905.44 1,348,735.46 64,539,965.92<br />
4,627,567.53 954,855.42 5,876,393.88 2,613,227.67 364,880.45 57,010,860.85<br />
1,948,535.67 1,062,131.84 313,970.24 1,040,556.74 1,749,210.63 20,337,026.55<br />
1,584,170.24 1,145,773.57 1,761,287.83 1,243,990.60 312,317.81 26,328,497.81<br />
5,285,169.98 2,527,314.38 14,892,427.72 6,190,875.30 2,016,479.85 111,826,069.03<br />
1,096,488.50 467,357.11 1,506,565.40 135,077.83 287,668.84 13,147,397.36<br />
1,309,247.54 933,553.09 309,541.21 742,687.08 730,102.14 23,278,224.66<br />
3,823,640.27 1,327,318.69 5,225,664.93 5,580,842.64 3,426,319.39 56,882,209.73<br />
25,021,707.41 15,914,140.27 35,664,692.43 14,218,708.34 9,292,995.81 422,485,370.86<br />
1,889,816.57 636,208.09 2,004,044.51 564,888.70 28,346,439.64<br />
12,762,549.98 7,072,662.71 27,224,077.79 4,580,638.33 5,346,678.98 228,483,483.26<br />
3,679,870.49 1,582,482.50 6,435,425.66 2,926,140.51 244,272.47 59,322,764.17<br />
1,309,640.49 1,068,911.87 876,691.20 584,764.40 365,125.42 15,339,966.61<br />
1,628,527.95 855,386.63 393,629.54 246,332.32 636,645.66 23,674,392.22<br />
1,245,814.17 963,946.12 366,008.71 406,233.40 212,188.01 16,341,240.62<br />
865,285.39 592,644.53 400,216.93 102,169.24 372,861.82 13,359,193.23<br />
2,040,486.41 1,076,801.04 6,416,296.85 1,462,303.57 203,077.71 31,226,384.00<br />
2,313,721.32 957,872.42 2,576,935.06 1,517,387.44 867,567.99 39,951,369.28<br />
9,080,307.24 3,259,756.23 13,426,697.69 13,846,953.03 5,633,464.52 164,471,795.78<br />
1,462,492.75 1,265,132.30 14,110.00 758,944.23 544,610.32 20,021,699.11<br />
3,680,864.72 1,646,624.43 4,489,625.66 2,398,296.23 590,825.43 52,751,151.26<br />
1,626,268.44 1,198,673.05 518,267.94 704,548.02 420,061.14 21,955,181.87<br />
6,909,261.01 2,745,194.52 10,503,539.03 4,483,823.92 2,277,843.40 107,906,214.47<br />
3,940,603.80 2,236,127.68 3,189,515.63 1,249,631.47 2,169,174.25 56,986,351.42<br />
Local <strong>Education</strong> Agencies<br />
43
Local <strong>Education</strong> Agencies<br />
SYSTEM EXPENDITURES BY FUNCTION – FY <strong>2001</strong><br />
System Number/Name Instructional Instructional Operations and Transportation<br />
Services Support Maintenance Services<br />
WASHINGTON COUNTY 13,244,935.82 2,437,543.09 1,547,388.03 1,442,723.95<br />
WILCOX COUNTY 9,575,207.70 2,516,525.46 1,287,338.31 1,143,409.35<br />
WINSTON COUNTY 10,452,227.46 2,197,630.48 1,359,596.79 2,629,128.74<br />
ALBERTVILLE CITY 12,824,432.32 2,746,087.07 1,665,763.91 976,354.01<br />
ALEX. CITY 13,370,599.28 2,933,357.32 1,845,562.67 857,506.00<br />
ANDALUSIA CITY 6,731,379.57 1,417,639.03 824,927.52 156,607.02<br />
ANNISTON CITY 10,229,633.08 2,737,535.61 1,762,270.36 852,361.97<br />
ARAB CITY 9,433,765.32 2,502,960.99 860,552.41 510,590.28<br />
ATHENS CITY 13,255,210.15 2,447,637.17 2,215,285.72 262,786.45<br />
ATTALLA CITY 7,102,782.79 1,387,490.38 694,208.99 292,331.80<br />
AUBURN CITY 17,541,245.94 5,218,537.83 2,182,139.83 1,002,064.90<br />
BESSEMER CITY 15,760,025.22 3,736,923.78 2,273,545.31 716,792.14<br />
BIRMINGHAM CITY 158,467,741.34 40,326,137.46 31,595,043.97 7,197,897.65<br />
BREWTON CITY 5,662,133.88 1,184,120.11 741,213.63 157,758.16<br />
CULLMAN CITY 9,282,991.88 1,852,605.72 954,650.08 127,394.99<br />
DALEVILLE CITY 5,898,799.67 1,398,210.48 526,665.39 471,821.40<br />
DECATUR CITY 36,793,750.80 10,161,558.81 7,074,815.47 979,206.80<br />
DEMOPOLIS CITY 8,288,128.86 1,910,981.92 879,522.01 81,044.68<br />
DOTHAN CITY 31,718,341.92 9,577,051.98 4,321,431.96 2,356,732.02<br />
ELBA CITY 3,869,216.99 957,646.82 460,398.33 223,319.38<br />
ENTERPRISE CITY 18,508,331.38 5,602,862.45 2,082,566.21 1,437,917.49<br />
EUFAULA CITY 10,896,938.26 2,453,489.93 1,278,638.42 396,089.47<br />
FAIRFIELD CITY 8,117,289.26 2,014,237.16 1,367,248.12 100,330.83<br />
FLORENCE CITY 20,267,493.92 4,995,610.39 3,524,339.54 838,366.52<br />
FORT PAYNE CITY 9,290,146.32 1,805,032.45 880,443.20 755,992.10<br />
GADSDEN CITY 20,636,933.99 5,715,559.15 3,107,259.34 537,421.55<br />
GENEVA CITY 5,326,061.82 896,631.68 556,578.23 300,420.70<br />
GUNTERSVILLE CITY 7,032,668.59 1,701,215.81 994,046.70 435,392.92<br />
HALEYVILLE CITY 6,234,673.96 1,059,407.27 723,939.16 49,809.42<br />
HARTSELLE CITY 11,659,981.03 2,633,940.11 1,558,307.33 682,380.32<br />
HOMEWOOD CITY 16,443,100.57 4,016,392.46 2,701,904.55 432,150.10<br />
HOOVER CITY 43,941,591.28 9,952,016.08 8,961,014.98 3,889,462.27<br />
HUNTSVILLE CITY 97,388,217.48 21,664,455.28 18,935,139.21 2,938,955.05<br />
JACKSONVILLE CITY 6,016,339.13 1,152,430.20 628,010.72 308,455.21<br />
JASPER CITY 9,744,013.10 2,984,708.73 1,422,906.79 393,267.15<br />
LANETT CITY 4,810,913.57 1,074,936.92 458,887.88 60,291.94<br />
LINDEN CITY 2,747,798.67 713,994.99 324,279.56 91,177.53<br />
MADISON CITY 20,340,141.42 4,955,590.91 2,888,633.35 1,873,890.91<br />
MIDFIELD CITY 4,469,454.80 927,316.32 746,178.10 396,954.56<br />
MT. BROOK CITY 20,353,663.92 5,572,260.38 3,444,641.97 95,227.73<br />
MUSCLE SHOALS CITY 9,470,477.43 2,061,235.01 2,042,186.94 112,289.48<br />
ONEONTA CITY 4,174,162.34 921,743.39 463,940.94 258,090.46<br />
OPELIKA CITY 17,680,519.40 3,785,853.71 3,098,040.54 879,352.87<br />
OPP CITY 5,313,725.74 1,066,937.40 775,994.90 29,551.51<br />
OXFORD CITY 11,096,519.70 2,304,060.41 1,153,984.32 881,663.85<br />
OZARK CITY 10,555,410.83 2,892,612.69 1,445,459.40 716,756.93<br />
PELL CITY CITY 13,478,010.78 2,852,543.72 1,585,954.68 1,250,313.27<br />
PHENIX CITY CITY 16,966,745.60 4,396,164.63 3,086,115.09 1,233,588.01<br />
PIEDMONT CITY 4,059,003.30 916,963.74 389,453.03<br />
ROANOKE CITY 5,092,160.80 1,223,912.53 621,577.57 142,294.51<br />
RUSSELLVILLE CITY 8,940,578.56 1,745,201.20 1,085,846.09 94,359.92<br />
SCOTTSBORO CITY 11,010,356.40 2,353,627.11 1,857,494.86 1,007,272.84<br />
SELMA CITY 14,547,304.73 4,122,430.29 2,156,481.57 281,629.19<br />
SHEFFIELD CITY 5,917,609.68 1,274,984.76 1,009,142.73 89,440.26<br />
SYLACAUGA CITY 9,081,401.63 2,174,782.56 1,076,543.90 401,327.52<br />
TALLADEGA CITY 11,963,898.36 3,149,097.19 1,671,860.19 641,288.85<br />
TALLASSEE CITY 6,328,801.77 1,263,676.88 562,878.70 89,766.79<br />
TARRANT CITY CITY 5,265,784.24 1,080,016.38 811,706.14 130,684.63<br />
THOMASVILLE CITY 6,132,979.60 1,304,894.90 513,684.43 273,009.76<br />
TROY CITY 7,811,122.37 2,093,243.07 971,876.91 55,906.97<br />
TUSCALOOSA CITY 37,954,252.67 9,016,612.89 5,591,842.52 2,172,359.87<br />
TUSCUMBIA CITY 5,255,185.24 1,536,919.85 853,955.08 58,694.40<br />
VESTAVIA HILLS CITY 18,862,259.80 3,820,862.08 2,544,591.03 176,213.01<br />
WINFIELD CITY 4,237,975.94 996,974.59 435,917.44 272,193.64<br />
STATEWIDE TOTALS 2,682,364,531.09 626,240,078.59 381,175,123.95 218,870,765.73<br />
44
Food Administrative Capital Debt Other Total<br />
Services Services Outlay Service Expenditures Expenditures<br />
1,354,341.71 898,306.96 725,525.21 566,321.63 630,324.06 22,847,410.46<br />
1,348,660.47 891,539.08 390,356.92 549,575.00 741,292.91 18,443,905.20<br />
1,387,010.12 890,261.79 567,157.14 791,802.00 618,347.86 20,893,162.38<br />
1,395,323.22 793,009.53 10,290,486.58 1,073,968.64 262,175.55 32,027,600.83<br />
1,145,557.46 642,374.49 840,224.03 1,485,437.00 206,785.44 23,327,403.69<br />
696,169.53 463,406.54 5,527,947.35 980,000.00 352,453.60 17,150,530.16<br />
1,734,004.30 876,262.59 51,215.11 161,768.96 366,772.64 18,771,824.62<br />
928,937.60 730,577.56 1,078,469.08 292,062.05 16,337,915.29<br />
1,133,987.65 1,054,073.08 5,026,398.48 1,428,753.36 933,267.13 27,757,399.19<br />
803,145.25 747,070.40 5,114,180.06 497,136.51 275,612.64 16,913,958.82<br />
1,836,008.67 1,237,798.68 548,557.32 227,969.16 1,891,868.43 31,686,190.76<br />
2,340,682.04 1,763,973.39 2,613,088.47 687,945.22 887,374.13 30,780,349.70<br />
14,764,603.87 15,803,062.23 43,974,542.36 7,141,978.43 10,541,568.97 329,812,576.28<br />
345,419.06 399,519.20 1,831,340.45 81,388.78 10,402,893.27<br />
1,047,495.51 846,649.53 259,591.96 1,615,908.68 1,084,154.85 17,071,443.20<br />
619,366.62 537,872.38 484,017.97 332,016.35 151,374.25 10,420,144.51<br />
3,936,688.72 1,830,070.68 1,689,575.95 3,535,129.90 714,889.82 66,715,686.95<br />
1,000,618.47 574,311.59 617,826.84 15,558.92 632,632.91 14,000,626.20<br />
4,241,609.75 2,396,255.53 1,362,404.61 1,000,064.37 2,789,989.87 59,763,882.01<br />
602,353.54 369,212.51 89,083.16 69,182.87 6,640,413.60<br />
1,955,647.13 1,293,127.89 1,655,100.11 255,162.71 32,790,715.37<br />
1,258,666.88 1,041,408.93 2,493,849.86 413,669.11 20,232,750.86<br />
1,114,158.91 823,665.20 1,256,827.58 245,580.11 262,929.28 15,302,266.45<br />
1,793,538.67 1,252,954.24 4,333,594.81 663,841.04 1,511,522.60 39,181,261.73<br />
1,324,083.97 829,782.21 2,457,770.18 309,814.77 378,057.66 18,031,122.86<br />
2,494,662.71 1,731,606.30 101,742.04 221,345.00 961,911.09 35,508,441.17<br />
504,631.26 257,747.12 944,374.51 334,191.80 133,226.70 9,253,863.82<br />
860,965.56 582,107.13 1,443,673.39 308,515.64 397,987.35 13,756,573.09<br />
699,118.13 401,247.36 788,910.34 353,762.15 219,217.86 10,530,085.65<br />
1,141,047.63 876,951.40 5,723,604.23 378,568.18 125,038.74 24,779,818.97<br />
1,393,499.11 1,034,150.87 11,327,374.85 1,523,402.84 581,349.89 39,453,325.24<br />
5,342,856.98 2,937,513.85 25,652,936.88 14,120,409.24 2,351,082.32 117,148,883.88<br />
8,147,220.83 7,100,849.87 7,790,695.00 2,687,138.88 166,652,671.60<br />
651,288.09 531,022.68 1,025,756.77 167,369.43 41,093.85 10,521,766.08<br />
1,034,551.86 588,640.08 121,140.57 384,601.54 567,972.68 17,241,802.50<br />
664,848.15 584,213.96 912,213.79 161,408.89 82,776.77 8,810,491.87<br />
384,370.02 355,913.71 214,958.95 21,725.21 290,753.96 5,144,972.60<br />
2,196,723.88 964,774.75 8,744,110.29 3,157,391.87 823,492.57 45,944,749.95<br />
508,110.33 603,205.22 188,896.46 52,057.56 7,892,173.35<br />
1,500,233.50 1,237,000.33 3,948,217.46 2,169,083.78 1,419,914.83 39,740,243.90<br />
1,149,230.67 1,056,380.47 41,780.00 229,147.47 16,162,727.47<br />
437,921.18 307,933.02 288,178.95 249,870.33 261,236.91 7,363,077.52<br />
1,845,785.88 1,118,194.41 5,046,182.95 2,265,308.37 915,942.41 36,635,180.54<br />
521,186.39 340,290.53 761,517.56 67,126.82 256,618.96 9,132,949.81<br />
1,396,506.04 871,091.75 1,261,915.74 1,265,910.40 45,575.40 20,277,227.61<br />
1,273,578.28 724,177.65 149,589.57 443,370.40 189,315.16 18,390,270.91<br />
1,741,898.32 882,082.19 1,191,337.38 854,138.12 666,015.87 24,502,294.33<br />
2,930,209.25 1,359,700.65 8,463,551.53 1,649,549.33 2,503,705.18 42,589,329.27<br />
498,348.18 294,088.94 1,592,768.87 184,764.87 31,770.20 7,967,161.13<br />
561,360.57 547,691.38 413,501.06 308,729.72 8,911,228.14<br />
1,039,686.46 1,031,279.35 569,113.35 820,698.33 1,122,082.42 16,448,845.68<br />
1,483,188.75 672,657.05 2,666,536.74 2,028,578.12 505,248.37 23,584,960.24<br />
2,083,855.59 899,966.69 463,186.61 11,000.00 1,619,789.30 26,185,643.97<br />
689,721.23 601,473.86 490,745.91 201,591.85 257,227.06 10,531,937.34<br />
993,751.36 834,832.92 1,580,450.13 233,661.68 414,637.21 16,791,388.91<br />
1,650,229.42 702,767.37 221,880.88 502,391.39 345,353.57 20,848,767.22<br />
785,372.64 413,997.79 799,940.73 446,099.40 199,628.68 10,890,163.38<br />
636,518.72 588,380.14 387,366.95 320,865.40 263,988.55 9,485,311.15<br />
518,817.91 488,761.57 885,570.43 198,466.72 222,151.37 10,538,336.69<br />
923,180.82 765,066.83 890,244.86 237,403.75 343,176.39 14,091,221.97<br />
4,174,438.22 2,835,663.72 13,972,603.92 5,702,160.68 1,459,432.65 82,879,367.14<br />
673,723.10 630,461.84 525,526.43 148,202.15 211,066.90 9,893,734.99<br />
1,353,978.51 1,622,827.03 1,031,637.47 802,265.00 1,000,147.08 31,214,781.01<br />
581,106.02 300,248.32 6,292,692.64 1,086,778.26 14,203,886.85<br />
310,174,585.02 181,141,362.52 463,399,553.81 186,089,006.81 133,023,997.30 5,182,479,004.82<br />
45
Local <strong>Education</strong> Agencies<br />
VOCATIONAL EDUCATION FUNDS<br />
AVAILABLE<br />
State Funds Encumbered and Used $53,803.45<br />
State Vocational Appropriation 641,729.00<br />
TOTALSTATE FUNDS AVAILABLE 695,532.45<br />
Federal Funds Encumbered 4,389,235.97<br />
Federal Funds (10/1/2000 – 9/30/<strong>2001</strong>) 21,443,360.00<br />
TOTAL FEDERAL FUNDS AVAILABLE 25,832,595.97<br />
GRAND TOTAL ALL FUNDS AVAILABLE $26,528,128.42<br />
EXPENDITURES<br />
STATE FEDERAL TOTAL<br />
County & City Boards <strong>of</strong> <strong>Education</strong> $11,083,202.12 $11,083,202.12<br />
Vocational Technical Schools (Postsecondary) 7,616,161.22 7,616,161.22<br />
Special Schools 111,605.18 111,605.18<br />
State <strong>Department</strong> <strong>of</strong> <strong>Education</strong>-Salaries 219,466.59 1,262,484.01 1) 1,481,950.60<br />
State <strong>Department</strong> <strong>of</strong> <strong>Education</strong>-Other Expenses 380,062.98 1,259,445.53 2) 1,639,508.51<br />
Encumbered for Sub-recipients as <strong>of</strong> 9/30/<strong>2001</strong> 3,260,130.91 3) 3,260,130.91<br />
Encumbered for State Office as <strong>of</strong> 9/30/<strong>2001</strong> 96,002.88 1,239,567.00 4) 1,335,569.88<br />
GRAND TOTAL $695,532.45 $25,0832,595.97 $26,528,128.42<br />
1/ Includes $825,458.38 for salaries paid through the State Office for Leadership activities, and is not an administrative cost.<br />
2/ Includes $174,572.68 for travel paid through the State Office for Leadership activities, and is not an administrative cost.<br />
3/ Includes $768,387.06 carryover <strong>of</strong> Federal Funds.<br />
4/ Includes $1,214,973.71 carryover <strong>of</strong> Federal Funds.<br />
NOTE:<br />
The total Non-Federal Expenditures included in the <strong>2001</strong> <strong>Annual</strong> Federal Financial Status <strong>Report</strong> was $201,272,418.<br />
46
Local <strong>Education</strong> Agencies<br />
VOCATIONAL EDUCATION FUNDS EXPENDED – FY <strong>2001</strong><br />
FEDERAL DOLLARS<br />
COUNTY SYSTEMS:<br />
FEDERAL DOLLARS<br />
CITY SYSTEMS:<br />
Autauga<br />
Baldwin<br />
Barbour<br />
Bibb<br />
Blount<br />
Bullock<br />
Butler<br />
Calhoun<br />
Chambers<br />
Cherokee<br />
Chilton<br />
Choctaw<br />
Clarke<br />
Clay<br />
Cleburne<br />
C<strong>of</strong>fee<br />
Colbert<br />
Conecuh<br />
Coosa<br />
Covington<br />
Crenshaw<br />
Cullman<br />
Dale<br />
Dallas<br />
Dekalb<br />
Elmore<br />
Escambia<br />
Etowah<br />
Fayette<br />
Franklin<br />
Geneva<br />
Greene<br />
Hale<br />
Henry<br />
Houston<br />
Jackson<br />
Jefferson<br />
Lamar<br />
Lauderdale<br />
Lawrence<br />
Lee<br />
Limestone<br />
Lowndes<br />
Macon<br />
Madison<br />
Marengo<br />
Marion<br />
Marshall<br />
Mobile<br />
Monroe<br />
Montgomery<br />
Morgan<br />
Perry<br />
Pickens<br />
Pike<br />
Randolph<br />
Russell<br />
St. Clair<br />
Shelby<br />
Sumter<br />
Talladega<br />
Tallapoosa<br />
Tuscaloosa<br />
Walker<br />
Washington<br />
Wilcox<br />
Winston<br />
Albertville<br />
Alexander City<br />
Andalusia<br />
Anniston<br />
Arab<br />
Athens<br />
Attalla<br />
Auburn<br />
Bessemer<br />
Birmingham<br />
Cullman<br />
Daleville<br />
Decatur<br />
Demopolis<br />
Dothan<br />
Elba<br />
Enterprise<br />
Eufaula<br />
Fairfield<br />
Florence<br />
Ft. Payne<br />
Gadsden<br />
Geneva<br />
Guntersville<br />
Haleyville<br />
Hartselle<br />
Homewood<br />
Hoover<br />
Huntsville<br />
Jacksonville<br />
Jasper<br />
Lanett<br />
Linden<br />
Madison<br />
Midfield<br />
Mountain Brook<br />
Muscle Shoals<br />
Oneonta<br />
Opelika<br />
Opp<br />
Oxford<br />
Ozark<br />
Pell City<br />
Phenix City<br />
Piedmont<br />
Roanoke<br />
Russellville<br />
Scottsboro<br />
Selma<br />
Sheffield<br />
Sylacauga<br />
Talladega<br />
Tallassee<br />
Tarrant<br />
Thomasville<br />
Troy<br />
Tuscaloosa<br />
Tuscumbia<br />
Vestavia Hills<br />
Winfield<br />
All LEAs expended state dollars for<br />
vocational programs.<br />
47
<strong>Alabama</strong> <strong>Department</strong> <strong>of</strong> <strong>Education</strong><br />
STATE BOARD OF EDUCATION<br />
GENERAL COUNSEL<br />
STATE SUPERINTENDENT OF EDUCATION<br />
DIRECTOR<br />
Communications<br />
Learning Resources<br />
Legislative Services<br />
DEPUTY STATE<br />
SUPERINTENDENT<br />
Prevention and<br />
Support Services<br />
<strong>Alabama</strong> Reading<br />
Initiative<br />
ASSISTANT STATE<br />
SUPERINTENDENT<br />
ASSISTANT STATE<br />
SUPERINTENDENT<br />
ASSISTANT STATE<br />
SUPERINTENDENT<br />
Adult and Community <strong>Education</strong><br />
Private School Licensure<br />
State Approving Agency<br />
DIRECTOR<br />
Disability<br />
Determination Services<br />
Federal Programs<br />
PEPE<br />
Special <strong>Education</strong><br />
Child Nutrition Programs<br />
Financial Management and Compliance<br />
Human Resources<br />
LEA Accounting<br />
Mail, Files, and Supplies<br />
Purchasing<br />
School Architect<br />
School Facilities<br />
SDE Accounting<br />
Student Transportation<br />
Comprehensive State Monitoring<br />
Training and Assessment<br />
Technology Initiatives<br />
DIRECTOR<br />
Management Information Systems<br />
Administration/Finance<br />
Career/Technical<br />
Child Nutrition<br />
Prevention & Support<br />
Special <strong>Education</strong><br />
Health Services<br />
DIRECTOR<br />
Classroom Improvement<br />
Team Coordination<br />
TEAMS<br />
DIRECTOR<br />
Teacher <strong>Education</strong> and<br />
Certification<br />
Instruction/Assessment<br />
Federal Programs<br />
Capital Planning<br />
Teacher Ed./Certification<br />
Technology<br />
Transportation<br />
DIRECTOR<br />
Career/Technical<br />
<strong>Education</strong><br />
48
State Board <strong>of</strong> <strong>Education</strong><br />
The State Board <strong>of</strong> <strong>Education</strong> is made up <strong>of</strong> the Governor, who is the President <strong>of</strong> the Board, ex <strong>of</strong>ficio, the State<br />
Superintendent <strong>of</strong> <strong>Education</strong> who serves as the Secretary to the Board, and eight elected board members who represent<br />
the eight school districts <strong>of</strong> the state. In very general terms, the duties <strong>of</strong> the board include general supervision <strong>of</strong> public<br />
schools in <strong>Alabama</strong> and the formulation <strong>of</strong> regulations for implementing education laws.<br />
State Superintendent <strong>of</strong> <strong>Education</strong><br />
The State Superintendent <strong>of</strong> <strong>Education</strong> serves as the chief state school <strong>of</strong>ficer. The superintendent is appointed by the<br />
state board <strong>of</strong> education and serves at the board's pleasure. The authority and duties <strong>of</strong> the superintendent are determined<br />
by the state board <strong>of</strong> education according to regulations as the legislature prescribes. The superintendent oversees<br />
the administration <strong>of</strong> the State <strong>Department</strong> <strong>of</strong> <strong>Education</strong> and the interpretation <strong>of</strong> intent <strong>of</strong> laws.<br />
OFFICE OF GENERAL COUNSEL<br />
The Office <strong>of</strong> General Counsel (OGC) provides legal counsel to the State Board <strong>of</strong> <strong>Education</strong>, the State Superintendent<br />
<strong>of</strong> <strong>Education</strong>, and the State <strong>Department</strong> <strong>of</strong> <strong>Education</strong>. The OGC reviews and provides suggestions on interpretations <strong>of</strong><br />
statutory and case precedent. In addition to legal compliance review, the OGC handles all litigation involving the department,<br />
the State Board, and the State Superintendent. Teacher background check investigations and prosecution <strong>of</strong> certificate<br />
revocations are handled by the assistant attorneys general in the <strong>of</strong>fice. Personnel investigations, Equal<br />
Employment Opportunity Commission complaints, and Board <strong>of</strong> Adjustment claims also fall within the jurisdiction <strong>of</strong><br />
this <strong>of</strong>fice. The Administrative Code and its amendments are within the responsibilities <strong>of</strong> the OGC. Any legislation<br />
which may affect education in <strong>Alabama</strong> is reviewed by the OGC as well as all financial transactions involving the<br />
issuance <strong>of</strong> warrants by local boards <strong>of</strong> education are examined and approved by the OGC. The attorneys within the<br />
<strong>of</strong>fice also advise the 128 school districts as needed when issues <strong>of</strong> potential statewide impact arise.<br />
DIRECTOR – COMMUNICATIONS/LEARNING RESOURCES/LEGISLATIVE SERVICES<br />
The mission <strong>of</strong> the Communications and Public Information Section is to increase awareness and understanding <strong>of</strong> the<br />
State Board <strong>of</strong> <strong>Education</strong>’s high academic standards, goals and initiatives, and policies through a plan <strong>of</strong> aggressive communications.<br />
The section produces a monthly newsletter for <strong>Alabama</strong>’s K-12 educators, handles news media relations,<br />
coordinates various teacher and school recognition programs, and conducts public information efforts.<br />
The <strong>Alabama</strong> Learning Resources Center (ALRC) provides technology support to the State Board <strong>of</strong> <strong>Education</strong>, the State<br />
<strong>Department</strong> <strong>of</strong> <strong>Education</strong> (SDE), Local <strong>Education</strong> Agencies (LEAs), and the citizens <strong>of</strong> the State <strong>of</strong> <strong>Alabama</strong>. The<br />
ALRC is responsible for setting up and taping all State Board <strong>of</strong> <strong>Education</strong> meetings, in addition to providing sound and<br />
video services to the State Board, and SDE, as requested. The section also produces documentary and training videos,<br />
duplicates videos for classroom use at no cost to the LEAs or citizens <strong>of</strong> <strong>Alabama</strong>, provides technical assistance to SDE<br />
personnel in producing workshop materials, and maintains a collection <strong>of</strong> computer and audiovisual equipment projectors<br />
for use by SDE staff. The ALRC is also available to assist LEAs in writing specifications for the purchase <strong>of</strong> technology<br />
equipment and networking.<br />
The Office <strong>of</strong> Legislative Services coordinates all legislative actions to effectively communicate the State <strong>Department</strong> <strong>of</strong><br />
<strong>Education</strong>’s position on all legislative issues to members <strong>of</strong> the legislative and executive branches <strong>of</strong> government, as well<br />
as the general public so that information is provided to these groups in a timely manner. In addition, the Office <strong>of</strong><br />
Legislative Services is responsible for analyzing proposed legislation and existing laws to provide recommendations to<br />
the State Superintendent on revisions to existing laws or to develop departmental positions on proposed legislation.<br />
State <strong>Department</strong> <strong>of</strong> <strong>Education</strong><br />
49
<strong>Alabama</strong> <strong>Department</strong> <strong>of</strong> <strong>Education</strong><br />
Deputy State Superintendent<br />
ALABAMA READING INITIATIVE<br />
The <strong>Alabama</strong> Reading Initiative is a statewide initiative managed by the State <strong>Department</strong> <strong>of</strong> <strong>Education</strong> that aims to significantly<br />
improve reading instruction and ultimately achieve 100 percent literacy among public school students. The<br />
initiative started in 1998 after a yearlong comprehensive review <strong>of</strong> research and best practices in reading. The <strong>Alabama</strong><br />
Reading Initiative seeks to give teachers training to help them teach in proven and effective ways, specifically by integrating<br />
the best practices <strong>of</strong> phonics and the whole-language approach to teaching reading.<br />
PREVENTION AND SUPPORT SERVICES<br />
The Prevention and Support Services Section has the responsibility <strong>of</strong> providing technical assistance to school and<br />
school system personnel in the areas <strong>of</strong> school safety, discipline, attendance, state at-risk programs, and the federally<br />
funded Safe and Drug Free Schools and Communities Program (IASA Title IV). The Section is also responsible for<br />
implementation <strong>of</strong> the School Safety And Discipline sections <strong>of</strong> the <strong>Alabama</strong> Code 16-6B-5 through 16-6B-7 and the<br />
<strong>Alabama</strong> Accountability Act <strong>of</strong> 1995 which includes school safety and discipline as one <strong>of</strong> the three (3) areas <strong>of</strong> possible<br />
intervention by the State Superintendent <strong>of</strong> <strong>Education</strong>. This responsibility includes data collection, LEA compliance<br />
determination, and implementation <strong>of</strong> State Board <strong>of</strong> <strong>Education</strong> regulations relating to the Accountability Act.<br />
Assistant State Superintendent<br />
CHILD NUTRITION<br />
Responsible for the management and supervision <strong>of</strong> all aspects <strong>of</strong> the state child nutrition program in both school and<br />
non-school settings. Activities include interpretation <strong>of</strong> federal and state laws, policies, program assessments, audits and<br />
reviews, the processing and allocation <strong>of</strong> United States <strong>Department</strong> <strong>of</strong> Agriculture commodities and the provision <strong>of</strong><br />
training and technical assistance.<br />
FINANCIAL MANAGEMENT AND COMPLIANCE<br />
Responsible for the determination <strong>of</strong> state appropriations to <strong>Alabama</strong> school systems and ensures accountability requirements<br />
for school systems as mandated. Activities include K-12 and State <strong>Department</strong> <strong>of</strong> <strong>Education</strong> funding, budget planning,<br />
local education agency audits, warrants, and technical assistance to local school systems.<br />
HUMAN RESOURCES<br />
The Human Resources section has the responsibility to ensure merit system rules and regulations are followed, State<br />
Personnel Board Rules are properly implemented, SDE policies and procedures are updated and enforced, and state and<br />
federal employment laws are carried out.<br />
LOCAL EDUCATION AGENCY (LEA) ACCOUNTING<br />
Responsible for reviewing and approving 128 local school system budgets, program applications, amendments, and the<br />
disbursement <strong>of</strong> state and federal funds. Activities include technical assistance and training for local school personnel in<br />
fiscal planning, budgeting and reporting.<br />
50
MAIL, FILES, AND SUPPLIES<br />
Responsible for the pickup, sorting, and delivery <strong>of</strong> all State <strong>Department</strong> <strong>of</strong> <strong>Education</strong> mail, printing, United Parcel<br />
Service shipments, and daily mail runs throughout the state complex. The staff also assists with the delivery <strong>of</strong> workshop<br />
materials and moving <strong>of</strong> furniture and equipment for department staff.<br />
PURCHASING<br />
This section reviews, prepares purchase orders, and receives and delivers materials to department personnel. Other<br />
responsibilities include the processing <strong>of</strong> invoices, material receipts, the sale and distribution <strong>of</strong> educational materials as<br />
well as the coordination <strong>of</strong> all printing activities for the department.<br />
SCHOOL ARCHITECT<br />
Responsible for the review <strong>of</strong> school construction plans, approval <strong>of</strong> all K-12 architectural and construction projects, onsite<br />
construction visits and technical assistance to local school systems in both the planning and implementation <strong>of</strong><br />
school construction. This <strong>of</strong>fice also administers state bond issue projects for the <strong>Alabama</strong> Public School and College<br />
Authority (APSCS).<br />
SCHOOL FACILITIES<br />
Responsible for assisting local school systems in the planning, development and implementation <strong>of</strong> capital plans.<br />
Activities include the approval <strong>of</strong> capital needs plans; construction reviews; visits, sales and leases <strong>of</strong> school property;<br />
assistance in maintaining student demographic information and training in school facilities activities.<br />
STATE DEPARTMENT OF EDUCATION ACCOUNTING<br />
Responsible for all departmental budgeting and budget control; department fiscal compliance with state and federal<br />
laws, regulations and policies; all financial and accounting activities; and the maintenance <strong>of</strong> payroll and personnel<br />
information.<br />
STUDENT TRANSPORTATION<br />
Responsible for the management <strong>of</strong> the statewide comprehensive student transportation program. Activities include bus<br />
inspection, fleet renewal assistance, route information, Driver’s <strong>Education</strong> Programs, training for bus drivers, supervisors,<br />
and other personnel, technical assistance and the monitoring and evaluation <strong>of</strong> state and local operations.<br />
COMPREHENSIVE STATE MONITORING<br />
Monitors local education agencies for compliance with state and federal laws as well as school board adopted codes as<br />
they relate to the allocation <strong>of</strong> funds to these agencies. This monitoring process is followed up with written reports<br />
requiring corrective action plans if necessary.<br />
TRAINING AND ASSESSMENT<br />
This section's mission is to train and assess SDE employees based on the needs <strong>of</strong> each employee. Assessments are<br />
done via a database driven exam, which given an immediate response. In addition, on-line training, using interactive<br />
streaming audio and video tutorials are available for employees to access at their desk, home, or the SDE training lab.<br />
State <strong>Department</strong> <strong>of</strong> <strong>Education</strong><br />
51
<strong>Alabama</strong> <strong>Department</strong> <strong>of</strong> <strong>Education</strong><br />
OFFICE OF TECHNOLOGY INITIATIVES<br />
Serves as a single point <strong>of</strong> contact in school system technology planning. This <strong>of</strong>fice implements the <strong>Alabama</strong><br />
Technology Plan for K-12 <strong>Education</strong>, provides support and assistance in filing for E-rate discounts, and supports LEA's<br />
in technology planning. It is responsible for administering Federal Grant Programs for Technology, responding to<br />
requests from organizations and agencies needing technology data, and maintaining a database <strong>of</strong> technology compiled<br />
from yearly survey reports. This division also serves as technology member for SDE teams to provide on-site support to<br />
Alert II schools, assistance with system monitoring, help in in-service needs, and other technology related issues. The<br />
Office <strong>of</strong> Technology Initiatives coordinates and implements all aspects <strong>of</strong> the <strong>Alabama</strong> <strong>Education</strong>al Technology<br />
Conference. Its mission is to use technology as a tool to prepare the student <strong>of</strong> today to become a productive, contributing<br />
citizen <strong>of</strong> tomorrow.<br />
DIRECTOR – MANAGEMENT INFORMATION SYSTEMS<br />
Responsible for maintaining and coordinating data systems services to the State <strong>Department</strong> <strong>of</strong> <strong>Education</strong> and local<br />
school systems. This includes data base management, information collection and distribution, report preparation, s<strong>of</strong>tware<br />
development and project management. Activities include State <strong>Department</strong> <strong>of</strong> <strong>Education</strong> employee training, local<br />
education agency staff training, inventory and disposition <strong>of</strong> equipment, equipment repair and maintenance.<br />
Assistant State Superintendent<br />
ADULT AND COMMUNITY EDUCATION<br />
The adult education section provides educational opportunities for adults to acquire the basic skills necessary to function<br />
in society and to have a positive effect on the literacy <strong>of</strong> their children. It enables adults to continue their education to at<br />
least the level <strong>of</strong> completion <strong>of</strong> secondary school. It makes available to adults the means to secure training that will<br />
enable them to become more employable, productive, and responsible citizens. The community education component <strong>of</strong><br />
the section makes available extended day school programs that address the needs <strong>of</strong> latchkey children; makes available<br />
educational vocational and cultural classes to local communities; provides tutor training to volunteers to assess students<br />
and schools; provides training on parent involvement issues; and provides youth at risk and preschool programs.<br />
CHILD NUTRITION/NON-SCHOOL PROGRAMS<br />
Consists <strong>of</strong> four individual programs that meet nutritional needs <strong>of</strong> selected groups. These groups include childcare,<br />
family day care, adult care, and summer feeding. All programs must meet stringent federal guidelines and conform to<br />
appropriate monitoring standards.<br />
PRIVATE SCHOOL LICENSURE<br />
The Private School Licensure Section licenses and regulates all private post-secondary schools pursuant to the <strong>Alabama</strong><br />
Private School Licensure Law. This section provides for students, educational institutions, and the general public protection<br />
from economic and academic fraud. This section also maintains supervision <strong>of</strong> all licensed schools which<br />
includes conducting on-site visits; processing licensure applications; handling consumer complaints; servicing student<br />
transcripts for closed (licensed) private schools; and registering all private, nondenominational and parochial schools.<br />
52
Assistant State Superintendent<br />
STATE APPROVING AGENCY<br />
The State Approving Agency (SAA) for veterans’ training is responsible for approving and supervising educational and<br />
job training programs for which benefits are paid to veterans and other eligible persons under Chapter 30, 32, and 35 <strong>of</strong><br />
Title 38 U.S. Code and Chapter 1606 formerly 106, <strong>of</strong> Title 10 U.S. Code. The SAA provides technical assistance to<br />
schools and employers desiring to <strong>of</strong>fer training to veterans, maintains a computerized database <strong>of</strong> approved sites and<br />
program <strong>of</strong>ferings for the training <strong>of</strong> veterans, and provides outreach services to groups and organizations interested in<br />
veterans’ education training.<br />
DIRECTOR – DISABILITY DETERMINATION SERVICES<br />
The Disability Determination Service (DDS) processes Social Security Disability and Supplemental Security Income<br />
(SSI) claims for the citizens <strong>of</strong> <strong>Alabama</strong>. The DDS is funded by the Social Security Administration (SSA) to process<br />
these claims under applicable federal statutes, regulations, and standards. The DDS has a very close, positive working<br />
relationship with all school systems in <strong>Alabama</strong>. The DDS requests school records to documents childhood disability<br />
claims and, in turn, provides requested testing information to the school systems. Childhood claims comprise approximately<br />
one third <strong>of</strong> the DDS workload. Outreach projects with social agencies and medical facilities are vital function <strong>of</strong><br />
the DDS. The DDS also refers selected individuals for rehabilitation services aimed largely at providing the opportunity<br />
to return to gainful employment.<br />
FEDERAL PROGRAMS<br />
The major responsibilities <strong>of</strong> the Federal Program Section are to administer all federally funded education programs and<br />
to provide technical assistance to local education agencies and schools. These responsibilities include promoting, supervising,<br />
and coordinating statewide educational programs with federal programs; assisting schools in developing, revising,<br />
and implementing their school wide plans; reviewing federal programs in local education agencies and schools as part <strong>of</strong><br />
<strong>Alabama</strong>’s consolidated monitoring process; and approving consolidated applications and amendments submitted by<br />
local education agencies.<br />
PROFESSIONAL EDUCATION PERSONNEL EVALUATION<br />
The <strong>Alabama</strong> Pr<strong>of</strong>essional <strong>Education</strong> Personnel Evaluation (PEPE) program addresses the resolution adopted by the State<br />
Board <strong>of</strong> <strong>Education</strong> in July 1988 establishing policies and procedures requiring a pr<strong>of</strong>essional education personnel evaluation<br />
system in each local school system. The mission <strong>of</strong> PEPE is to assure excellence in education in <strong>Alabama</strong>’s public<br />
schools. The primary purpose <strong>of</strong> the program is to assist educators through the process <strong>of</strong> performance evaluation and<br />
pr<strong>of</strong>essional growth to deliver quality educational services, thus increasing student achievement.<br />
SPECIAL EDUCATION SERVICES<br />
Provides technical assistance to all education agencies serving <strong>Alabama</strong>’s gifted children as well as children with disabilities.<br />
SES is also responsible for ensuring that education agencies providing services are in compliance with all federal<br />
and state laws and regulations and for processing all complaints and requests for due process hearings and mediation<br />
regarding special education issues.<br />
State <strong>Department</strong> <strong>of</strong> <strong>Education</strong><br />
53
<strong>Alabama</strong> <strong>Department</strong> <strong>of</strong> <strong>Education</strong><br />
EDUCATION RESEARCH<br />
<strong>Education</strong> Research is charged with producing the grading scales for the State Superintendent's <strong>Report</strong> Card and assisting<br />
elements <strong>of</strong> the State <strong>Department</strong> <strong>of</strong> <strong>Education</strong> with technical issues related to testing, evaluation, and pr<strong>of</strong>essional<br />
development. In addition, the section conducts research for the State Superintendent <strong>of</strong> <strong>Education</strong> in areas such as<br />
school finance, equity and adequacy issues, and cost <strong>of</strong> public education, state rankings, and teacher salary rankings relative<br />
to the nation and other southeastern states. The section also provides analytic and statistical support for various<br />
programs (i.e. special education issues) and technical method assistance to local educational agencies.<br />
DIRECTOR- CLASSROOM IMPROVEMENT/TEAM COORDINATION<br />
The Classroom Improvement Section is responsible for the development and implementation <strong>of</strong> the minimum curriculum<br />
content, standards, and course design for students in the public schools, Grades K-12. It is also responsible for<br />
instructional support programs such as textbook selection, scholarship programs, and counseling and guidance services.<br />
In addition, content specialists assist local systems with instructional and administrative strategies to enhance effective<br />
learning. The state-sponsored assessment program, designed to measure the effectiveness <strong>of</strong> the implementation <strong>of</strong><br />
instruction and curriculum is also developed and implemented through this section. Together, all <strong>of</strong> the areas within this<br />
section form the basis <strong>of</strong> the implementation <strong>of</strong> the accountability law as defined by the <strong>Alabama</strong> Legislature.<br />
SCHOOL ASSISTANCE TEAMS<br />
As recommended by the 21st Century <strong>Report</strong>, the state superintendent organized the State <strong>Department</strong> <strong>of</strong> <strong>Education</strong> staff<br />
into School Assistance Teams. The goal <strong>of</strong> this organization is to maximize Local <strong>Education</strong> Agency (LEA) support<br />
services. The 10 cross-functional teams have common assignments and work to provide more efficient service and<br />
assistance to the Local <strong>Education</strong> Agencies. The creation <strong>of</strong> School Assistance Teams allows the maximization <strong>of</strong> talent,<br />
knowledge, and expertise <strong>of</strong> team members to connect LEAs with the needed resources and support to implement the<br />
goals <strong>of</strong> the State Board <strong>of</strong> <strong>Education</strong>. It also represents a shift from the SDE regulatory institution with fragmented<br />
delivery <strong>of</strong> services and support to that <strong>of</strong> a resource and partner to help LEAs improve student achievement and meet<br />
local and state goals.<br />
The teams seek to provide timely and responsive assistance upon request by the LEAs. Team members work with local<br />
school systems to identify and prioritize local system needs, and then to provide a more comprehensive range <strong>of</strong> services.<br />
The new structure provides a steady flow <strong>of</strong> information from local systems to the state superintendent on each<br />
team’s work with local systems, enabling further planning by the SDE to continue providing beneficial assistance.<br />
DIRECTOR- CAREER/TECHNICAL EDUCATION<br />
The Career/Technical <strong>Education</strong> Section is responsible for facilitating career/technical education programming at the<br />
state and federal level in all local education agencies. Staff serve in a technical assistance capacity to deliver state-<strong>of</strong>the-art<br />
and articulated career/technical and academic education. The section supports the goals <strong>of</strong> the State Board <strong>of</strong><br />
<strong>Education</strong> by performing duties as assigned through the Division <strong>of</strong> Instructional Services.<br />
DIRECTOR- TEACHER EDUCATION AND CERTIFICATION<br />
The Teacher <strong>Education</strong> and Certification Section is responsible for ensuring that colleges and universities meet the continuously<br />
updated teacher education program approval standards adopted by the State Board <strong>of</strong> <strong>Education</strong> (SBE).<br />
Persons who meet SBE test requirements, complete approved programs, and meet background clearance requirements<br />
are eligible for certification. Certificates are also awarded to persons who meet alternative route criteria adopted by the<br />
SBE. Assistance is provided to persons who are considering education as a career, to members <strong>of</strong> the U.S. military who<br />
wish to pursue a second career in teaching, to students enrolled in teacher education programs, to local education agencies<br />
in need <strong>of</strong> personnel, and to individuals seeking employment.<br />
54
<strong>Alabama</strong> <strong>Department</strong> <strong>of</strong> <strong>Education</strong><br />
EXPENDITURES & APPROPRIATIONS – FY <strong>2001</strong><br />
EDUCATION TRUST FUND:<br />
Personnel Costs . . . . . . . . . . . . . . . . . . . . . . . . . . . . . . . . . . . . . . . . . .9,236,481<br />
Employee Benefits . . . . . . . . . . . . . . . . . . . . . . . . . . . . . . . . . . . . . . . .2,106,277<br />
Travel - In State . . . . . . . . . . . . . . . . . . . . . . . . . . . . . . . . . . . . . . . . . . . . .861,857<br />
Travel - Out <strong>of</strong> State . . . . . . . . . . . . . . . . . . . . . . . . . . . . . . . . . . . . . . . . . .22,282<br />
Repairs and Maintenance . . . . . . . . . . . . . . . . . . . . . . . . . . . . . . . . . . . . . . . . .365<br />
Rentals and Leases . . . . . . . . . . . . . . . . . . . . . . . . . . . . . . . . . . . . . . . . .1,665,480<br />
Utilities and Communication . . . . . . . . . . . . . . . . . . . . . . . . . . . . . . . . . .136,130<br />
Pr<strong>of</strong>essional Services . . . . . . . . . . . . . . . . . . . . . . . . . . . . . . . . . . . . . .15,262,951<br />
Supplies, Materials, and Operating Expense . . . . . . . . . . . . . . . . . . . . . . .789,284<br />
Transportation Equipment Operations . . . . . . . . . . . . . . . . . . . . . . . . . . . . . . . . .-<br />
Grants and Benefits . . . . . . . . . . . . . . . . . . . . . . . . . . . . . . . . . . . . .2,666,681,987<br />
Capital Outlay . . . . . . . . . . . . . . . . . . . . . . . . . . . . . . . . . . . . . . . . . . . . . . . . . . . .-<br />
Transportation Equipment Purchases . . . . . . . . . . . . . . . . . . . . . . . . . . . . . . . . . .-<br />
Other Equipment Purchases . . . . . . . . . . . . . . . . . . . . . . . . . . . . . . . . . . . .11,156<br />
TOTAL EDUCATION TRUST FUND EXPENDITURES . . . .2,696,774,250<br />
FEDERAL FUNDS:<br />
Personnel Costs . . . . . . . . . . . . . . . . . . . . . . . . . . . . . . . . . . . . . . . . . .17,354,904<br />
Employee Benefits . . . . . . . . . . . . . . . . . . . . . . . . . . . . . . . . . . . . . . . . .4,506,512<br />
Travel - In State . . . . . . . . . . . . . . . . . . . . . . . . . . . . . . . . . . . . . . . . . . . . .954,345<br />
Travel - Out <strong>of</strong> State . . . . . . . . . . . . . . . . . . . . . . . . . . . . . . . . . . . . . . . . .204,051<br />
Repairs and Maintenance . . . . . . . . . . . . . . . . . . . . . . . . . . . . . . . . . . . . . .30,974<br />
Rentals and Leases . . . . . . . . . . . . . . . . . . . . . . . . . . . . . . . . . . . . . . . . .2,346,149<br />
Utilities and Communication . . . . . . . . . . . . . . . . . . . . . . . . . . . . . . . . .1,122,695<br />
Pr<strong>of</strong>essional Services . . . . . . . . . . . . . . . . . . . . . . . . . . . . . . . . . . . . . .16,457,471<br />
Supplies, Materials, and Operating Expense . . . . . . . . . . . . . . . . . . . . .9,048,158<br />
Transportation Equipment Operations . . . . . . . . . . . . . . . . . . . . . . . . . . . . . 2,063<br />
Grants and Benefits . . . . . . . . . . . . . . . . . . . . . . . . . . . . . . . . . . . . . .462,245,092<br />
Capital Outlay . . . . . . . . . . . . . . . . . . . . . . . . . . . . . . . . . . . . . . . . . . . . . . . . . . . .-<br />
Transportation Equipment Purchases . . . . . . . . . . . . . . . . . . . . . . . . . . . . . . . . . .-<br />
Other Equipment Purchases . . . . . . . . . . . . . . . . . . . . . . . . . . . . . . . . . . .209,803<br />
TOTAL FEDERAL FUNDS EXPENDITURES . . . . . . . . . . . . . .514,482,217<br />
OTHER FUNDS:<br />
Personnel Costs . . . . . . . . . . . . . . . . . . . . . . . . . . . . . . . . . . . . . . . . . . .2,987,764<br />
Employee Benefits . . . . . . . . . . . . . . . . . . . . . . . . . . . . . . . . . . . . . . . . . .733,898<br />
Travel - In State . . . . . . . . . . . . . . . . . . . . . . . . . . . . . . . . . . . . . . . . . . . . .337,979<br />
Travel - Out <strong>of</strong> State . . . . . . . . . . . . . . . . . . . . . . . . . . . . . . . . . . . . . . . . . .21,407<br />
Repairs and Maintenance . . . . . . . . . . . . . . . . . . . . . . . . . . . . . . . . . . . . .120,940<br />
Rentals and Leases . . . . . . . . . . . . . . . . . . . . . . . . . . . . . . . . . . . . . . . . . .413,065<br />
Utilities and Communication . . . . . . . . . . . . . . . . . . . . . . . . . . . . . . . . . .327,564<br />
Pr<strong>of</strong>essional Services . . . . . . . . . . . . . . . . . . . . . . . . . . . . . . . . . . . . . . .4,244,144<br />
Supplies, Materials, and Operating Expense . . . . . . . . . . . . . . . . . . . . .1,167,246<br />
Transportation Equipment Operations . . . . . . . . . . . . . . . . . . . . . . . . . . . .15,847<br />
Grants and Benefits . . . . . . . . . . . . . . . . . . . . . . . . . . . . . . . . . . . . . . .95,646,143<br />
Capital Outlay . . . . . . . . . . . . . . . . . . . . . . . . . . . . . . . . . . . . . . . . . . . . . . . . . . . .-<br />
Transportation Equipment Purchases . . . . . . . . . . . . . . . . . . . . . . . . . . . . . . . . . .-<br />
Other Equipment Purchases . . . . . . . . . . . . . . . . . . . . . . . . . . . . . . . . . .1,021,618<br />
TOTAL OTHER FUNDS EXPENDITURES . . . . . . . . . . . . . . . .107,037,615<br />
55
<strong>Alabama</strong> <strong>Department</strong> <strong>of</strong> <strong>Education</strong>