Annual Report 2001 - Alabama Department of Education
Annual Report 2001 - Alabama Department of Education
Annual Report 2001 - Alabama Department of Education

You also want an ePaper? Increase the reach of your titles
YUMPU automatically turns print PDFs into web optimized ePapers that Google loves.
Public <strong>Education</strong> in <strong>Alabama</strong><br />
REPORT CARD 2000-<strong>2001</strong><br />
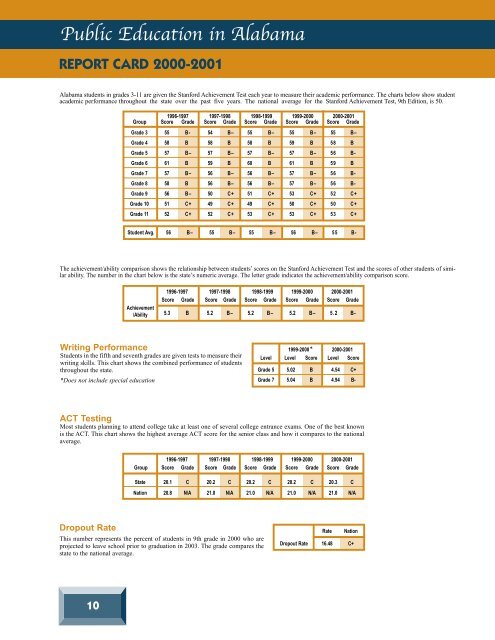
<strong>Alabama</strong> students in grades 3-11 are given the Stanford Achievement Test each year to measure their academic performance. The charts below show student<br />
academic performance throughout the state over the past five years. The national average for the Stanford Achievement Test, 9th Edition, is 50.<br />
1996-1997 1997-1998 1998-1999 1999-2000 2000-<strong>2001</strong><br />
Group Score Grade Score Grade Score Grade Score Grade Score Grade<br />
Grade 3 55 B- 54 B– 55 B– 55 B– 55 B–<br />
Grade 4 58 B 58 B 58 B 59 B 58 B<br />
Grade 5 57 B– 57 B– 57 B– 57 B– 56 B-<br />
Grade 6 61 B 59 B 60 B 61 B 59 B<br />
Grade 7 57 B– 56 B– 56 B– 57 B– 56 B-<br />
Grade 8 58 B 56 B– 56 B– 57 B– 56 B-<br />
Grade 9 56 B– 50 C+ 51 C+ 53 C+ 52 C+<br />
Grade 10 51 C+ 49 C+ 49 C+ 50 C+ 50 C+<br />
Grade 11 52 C+ 52 C+ 53 C+ 53 C+ 53 C+<br />
Student Avg. 56 B– 55 B– 55 B– 56 B– 55 B-<br />
The achievement/ability comparison shows the relationship between students’ scores on the Stanford Achievement Test and the scores <strong>of</strong> other students <strong>of</strong> similar<br />
ability. The number in the chart below is the state’s numeric average. The letter grade indicates the achievement/ability comparison score.<br />
1996-1997 1997-1998 1998-1999 1999-2000 2000-<strong>2001</strong><br />
Score Grade Score Grade Score Grade Score Grade Score Grade<br />
Achievement<br />
/Ability 5.3 B 5.2 B– 5.2 B– 5.2 B– 5.2 B-<br />
Writing Performance<br />
Students in the fifth and seventh grades are given tests to measure their<br />
writing skills. This chart shows the combined performance <strong>of</strong> students<br />
throughout the state.<br />
*Does not include special education<br />
1999-2000* 2000-<strong>2001</strong><br />
Level Level Score Level Score<br />
Grade 5 5.02 B 4.54 C+<br />
Grade 7 5.04 B 4.94 B-<br />
ACT Testing<br />
Most students planning to attend college take at least one <strong>of</strong> several college entrance exams. One <strong>of</strong> the best known<br />
is the ACT. This chart shows the highest average ACT score for the senior class and how it compares to the national<br />
average.<br />
1996-1997 1997-1998 1998-1999 1999-2000 2000-<strong>2001</strong><br />
Group Score Grade Score Grade Score Grade Score Grade Score Grade<br />
State 20.1 C 20.2 C 20.2 C 20.2 C 20.3 C<br />
Nation 20.8 N/A 21.0 N/A 21.0 N/A 21.0 N/A 21.0 N/A<br />
Dropout Rate<br />
This number represents the percent <strong>of</strong> students in 9th grade in 2000 who are<br />
projected to leave school prior to graduation in 2003. The grade compares the<br />
state to the national average.<br />
Rate<br />
Nation<br />
Dropout Rate 16.48 C+<br />
10