analysis of septic-tank density for three areas in cedar valley, iron ...
analysis of septic-tank density for three areas in cedar valley, iron ...
analysis of septic-tank density for three areas in cedar valley, iron ...

You also want an ePaper? Increase the reach of your titles
YUMPU automatically turns print PDFs into web optimized ePapers that Google loves.
ANALYSIS OF SEPTIC-TANK DENSITY FOR<br />
THREE AREAS IN CEDAR VALLEY, IRON<br />
COUNTY, UTAH- A CASE STUDY FOR<br />
EVALUATIONS OF PROPOSED,<br />
SUBDIVISIONS IN CEDAR VALLEY<br />
by<br />
Mike Lowe, Janae Wallace, Charles E. Bishop<br />
Utah Geological Survey<br />
2000<br />
WATER RESOURCE BULLETIN 27<br />
UTAH GEOLOGICAL SURVEY<br />
a division <strong>of</strong><br />
Department <strong>of</strong> Natural Resources
ANALYSIS OF SEPTIC-TANK DENSITY FOR THREE<br />
AREAS IN CEDAR VALLEY, IRON COUNTY, UTAH-<br />
A CASE STUDY FOR EVALUATIONS OF<br />
PROPOSED SUBDIVISIONS IN CEDAR VALLEY<br />
by<br />
Mike Lowe, Janae Wallace, Charles E. Bishop<br />
Utah Geological Survey<br />
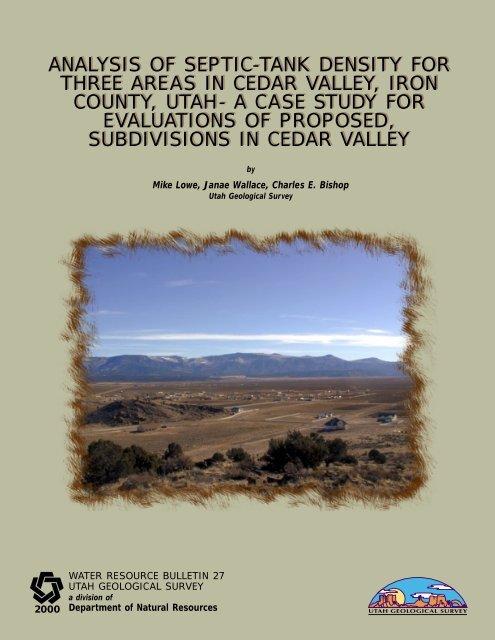
Cover Photo: View <strong>of</strong> Cedar Valley look<strong>in</strong>g east-southeast from Bauers Knoll toward the<br />
Hamiltons Fort area (photograph by Mike Lowe).<br />
ISBN 1-55791-650-0<br />
2000<br />
WATER RESOURCE BULLETIN 27<br />
UTAH GEOLOGICAL SURVEY<br />
a division <strong>of</strong><br />
Department <strong>of</strong> Natural Resources
STATE OF UTAH<br />
Michael O. Leavitt, Governor<br />
DEPARTMENT OF NATURAL RESOURCES<br />
Kathleen Clarke, Executive Director<br />
UTAH GEOLOGICAL SURVEY<br />
Richard G. Allis, Director<br />
UGS Board<br />
Member<br />
Represent<strong>in</strong>g<br />
Craig Nelson (Chairman) ............................................................................................................... Civil Eng<strong>in</strong>eer<strong>in</strong>g<br />
D. Cary Smith .................................................................................................................................. M<strong>in</strong>eral Industry<br />
C. William Berge ............................................................................................................................ M<strong>in</strong>eral Industry<br />
E.H. Deedee O’Brien ........................................................................................................................ Public-at-Large<br />
Robert Robison ............................................................................................................................... M<strong>in</strong>eral Industry<br />
Charles Semborski .......................................................................................................................... M<strong>in</strong>eral Industry<br />
Richard R. Kennedy ................................................................................................. Economics-Bus<strong>in</strong>ess/Scientific<br />
David Terry, Director, Trust Lands Adm<strong>in</strong>istration ..................................................................... Ex <strong>of</strong>ficio member<br />
UTAH GEOLOGICAL SURVEY<br />
The UTAH GEOLOGICAL SURVEY is organized <strong>in</strong>to five geologic programs with Adm<strong>in</strong>istration, Editorial, and Computer<br />
Resources provid<strong>in</strong>g necessary support to the programs. The ECONOMIC GEOLOGY PROGRAM undertakes studies to identify coal,<br />
geothermal, uranium, hydrocarbon, and <strong>in</strong>dustrial and metallic resources; <strong>in</strong>itiates detailed studies <strong>of</strong> these resources <strong>in</strong>clud<strong>in</strong>g m<strong>in</strong><strong>in</strong>g district<br />
and field studies; develops computerized resource data bases, to answer state, federal, and <strong>in</strong>dustry requests <strong>for</strong> <strong>in</strong><strong>for</strong>mation; and<br />
encourages the prudent development <strong>of</strong> Utah’s geologic resources. The APPLIED GEOLOGY PROGRAM responds to requests from<br />
local and state governmental entities <strong>for</strong> eng<strong>in</strong>eer<strong>in</strong>g-geologic <strong>in</strong>vestigations; and identifies, documents, and <strong>in</strong>terprets Utah’s geologic hazards.<br />
The GEOLOGIC MAPPING PROGRAM maps the bedrock and surficial geology <strong>of</strong> the state at a regional scale by county and at<br />
a more detailed scale by quadrangle. The GEOLOGIC EXTENSION SERVICE answers <strong>in</strong>quiries from the public and provides <strong>in</strong><strong>for</strong>mation<br />
about Utah’s geology <strong>in</strong> a non-technical <strong>for</strong>mat. The ENVIRONMENTAL SCIENCES PROGRAM ma<strong>in</strong>ta<strong>in</strong>s and publishes<br />
records <strong>of</strong> Utah’s fossil resources, provides paleontological and archeological recovery services to state and local governments, conducts<br />
studies <strong>of</strong> env<strong>iron</strong>mental change to aid resource management, and evaluates the quantity and quality <strong>of</strong> Utah’s ground-water resources.<br />
The UGS Library is open to the public and conta<strong>in</strong>s many reference works on Utah geology and many unpublished documents on<br />
aspects <strong>of</strong> Utah geology by UGS staff and others. The UGS has several computer data bases with <strong>in</strong><strong>for</strong>mation on m<strong>in</strong>eral and energy<br />
resources, geologic hazards, stratigraphic sections, and bibliographic references. Most files may be viewed by us<strong>in</strong>g the UGS Library. The<br />
UGS also manages a sample library which conta<strong>in</strong>s core, cutt<strong>in</strong>gs, and soil samples from m<strong>in</strong>eral and petroleum drill holes and eng<strong>in</strong>eer<strong>in</strong>g<br />
geology <strong>in</strong>vestigations. Samples may be viewed at the Sample Library or requested as a loan <strong>for</strong> outside study.<br />
The UGS publishes the results <strong>of</strong> its <strong>in</strong>vestigations <strong>in</strong> the <strong>for</strong>m <strong>of</strong> maps, reports, and compilations <strong>of</strong> data that are accessible to the public.<br />
For <strong>in</strong><strong>for</strong>mation on UGS publications, contact the Natural Resources Map/Bookstore, 1594 W. North Temple, Salt Lake City, Utah<br />
84116, (801) 537-3320 or 1-888-UTAH MAP. E-mail: nrugs.geostore@state.ut.us and visit our web site at http://www.ugs.state.ut.us.<br />
UGS Editorial Staff<br />
J. Str<strong>in</strong>gfellow ....................................................................................................................................................Editor<br />
Vicky Clarke, Sharon Hamre...............................................................................................................Graphic Artists<br />
Patricia H. Speranza, James W. Parker, Lori Douglas..........................................................................Cartographers<br />
The Utah Department <strong>of</strong> Natural Resources receives federal aid and prohibits discrim<strong>in</strong>ation on the basis <strong>of</strong> race, color, sex, age, national orig<strong>in</strong>, or disability. For<br />
<strong>in</strong><strong>for</strong>mation or compla<strong>in</strong>ts regard<strong>in</strong>g discrim<strong>in</strong>ation, contact Executive Director, Utah Department <strong>of</strong> Natural Resources, 1594 West North Temple #3710, Box 145610,<br />
Salt Lake City, UT 84116-5610 or Equal Employment Opportunity Commission, 1801 L Street, NW, Wash<strong>in</strong>gton DC 20507.<br />
Pr<strong>in</strong>ted on recycled paper 10/00
TABLE OF CONTENTS<br />
ABSTRACT . . . . . . . . . . . . . . . . . . . . . . . . . . . . . . . . . . . . . . . . . . . . . . . . . . . . . . . . . . . . . . . . . . . . . . . . . . . . . . . . . . . . . . . . . . . 1<br />
INTRODUCTION . . . . . . . . . . . . . . . . . . . . . . . . . . . . . . . . . . . . . . . . . . . . . . . . . . . . . . . . . . . . . . . . . . . . . . . . . . . . . . . . . . . . . . 1<br />
Purpose and Scope . . . . . . . . . . . . . . . . . . . . . . . . . . . . . . . . . . . . . . . . . . . . . . . . . . . . . . . . . . . . . . . . . . . . . . . . . . . . . . . . . . 3<br />
Well Number<strong>in</strong>g System . . . . . . . . . . . . . . . . . . . . . . . . . . . . . . . . . . . . . . . . . . . . . . . . . . . . . . . . . . . . . . . . . . . . . . . . . . . . . . 3<br />
Location and Geography . . . . . . . . . . . . . . . . . . . . . . . . . . . . . . . . . . . . . . . . . . . . . . . . . . . . . . . . . . . . . . . . . . . . . . . . . . . . . . 3<br />
Population and Land Use . . . . . . . . . . . . . . . . . . . . . . . . . . . . . . . . . . . . . . . . . . . . . . . . . . . . . . . . . . . . . . . . . . . . . . . . . . . . . . 5<br />
Climate . . . . . . . . . . . . . . . . . . . . . . . . . . . . . . . . . . . . . . . . . . . . . . . . . . . . . . . . . . . . . . . . . . . . . . . . . . . . . . . . . . . . . . . . . . . 5<br />
PREVIOUS INVESTIGATIONS . . . . . . . . . . . . . . . . . . . . . . . . . . . . . . . . . . . . . . . . . . . . . . . . . . . . . . . . . . . . . . . . . . . . . . . . . . . 5<br />
GEOLOGIC SETTING . . . . . . . . . . . . . . . . . . . . . . . . . . . . . . . . . . . . . . . . . . . . . . . . . . . . . . . . . . . . . . . . . . . . . . . . . . . . . . . . . . 6<br />
GROUND-WATER CONDITIONS . . . . . . . . . . . . . . . . . . . . . . . . . . . . . . . . . . . . . . . . . . . . . . . . . . . . . . . . . . . . . . . . . . . . . . . . . 8<br />
Introduction . . . . . . . . . . . . . . . . . . . . . . . . . . . . . . . . . . . . . . . . . . . . . . . . . . . . . . . . . . . . . . . . . . . . . . . . . . . . . . . . . . . . . . . . 8<br />
Bas<strong>in</strong>-Fill Aquifer . . . . . . . . . . . . . . . . . . . . . . . . . . . . . . . . . . . . . . . . . . . . . . . . . . . . . . . . . . . . . . . . . . . . . . . . . . . . . . . . . . . 8<br />
Occurrence . . . . . . . . . . . . . . . . . . . . . . . . . . . . . . . . . . . . . . . . . . . . . . . . . . . . . . . . . . . . . . . . . . . . . . . . . . . . . . . . . . . . . 8<br />
Aquifer Characteristics . . . . . . . . . . . . . . . . . . . . . . . . . . . . . . . . . . . . . . . . . . . . . . . . . . . . . . . . . . . . . . . . . . . . . . . . . . . . 8<br />
Potentiometric Surface . . . . . . . . . . . . . . . . . . . . . . . . . . . . . . . . . . . . . . . . . . . . . . . . . . . . . . . . . . . . . . . . . . . . . . . . . . . . 9<br />
General . . . . . . . . . . . . . . . . . . . . . . . . . . . . . . . . . . . . . . . . . . . . . . . . . . . . . . . . . . . . . . . . . . . . . . . . . . . . . . . . . . . . 9<br />
Ground-water flow direction . . . . . . . . . . . . . . . . . . . . . . . . . . . . . . . . . . . . . . . . . . . . . . . . . . . . . . . . . . . . . . . . . . . 10<br />
Water levels <strong>in</strong> wells . . . . . . . . . . . . . . . . . . . . . . . . . . . . . . . . . . . . . . . . . . . . . . . . . . . . . . . . . . . . . . . . . . . . . . . . . 10<br />
Changes <strong>in</strong> water levels . . . . . . . . . . . . . . . . . . . . . . . . . . . . . . . . . . . . . . . . . . . . . . . . . . . . . . . . . . . . . . . . . . . . . . . 10<br />
Recharge . . . . . . . . . . . . . . . . . . . . . . . . . . . . . . . . . . . . . . . . . . . . . . . . . . . . . . . . . . . . . . . . . . . . . . . . . . . . . . . . . . . . . . . . . 10<br />
Discharge . . . . . . . . . . . . . . . . . . . . . . . . . . . . . . . . . . . . . . . . . . . . . . . . . . . . . . . . . . . . . . . . . . . . . . . . . . . . . . . . . . . . . . . . 11<br />
Water Quality . . . . . . . . . . . . . . . . . . . . . . . . . . . . . . . . . . . . . . . . . . . . . . . . . . . . . . . . . . . . . . . . . . . . . . . . . . . . . . . . . . . . . 11<br />
GROUND-WATER CONTAMINATION FROM SEPTIC-TANK SYSTEMS . . . . . . . . . . . . . . . . . . . . . . . . . . . . . . . . . . . . . . . . 13<br />
Pathogens . . . . . . . . . . . . . . . . . . . . . . . . . . . . . . . . . . . . . . . . . . . . . . . . . . . . . . . . . . . . . . . . . . . . . . . . . . . . . . . . . . . . . . . . 13<br />
Household and Industrial Chemicals . . . . . . . . . . . . . . . . . . . . . . . . . . . . . . . . . . . . . . . . . . . . . . . . . . . . . . . . . . . . . . . . . . . . 13<br />
Phosphate . . . . . . . . . . . . . . . . . . . . . . . . . . . . . . . . . . . . . . . . . . . . . . . . . . . . . . . . . . . . . . . . . . . . . . . . . . . . . . . . . . . . . . . . 13<br />
Nitrate . . . . . . . . . . . . . . . . . . . . . . . . . . . . . . . . . . . . . . . . . . . . . . . . . . . . . . . . . . . . . . . . . . . . . . . . . . . . . . . . . . . . . . . . . . . 13<br />
THE MASS-BALANCE APPROACH . . . . . . . . . . . . . . . . . . . . . . . . . . . . . . . . . . . . . . . . . . . . . . . . . . . . . . . . . . . . . . . . . . . . . . 14<br />
General Methods . . . . . . . . . . . . . . . . . . . . . . . . . . . . . . . . . . . . . . . . . . . . . . . . . . . . . . . . . . . . . . . . . . . . . . . . . . . . . . . . . . . 14<br />
Limitations . . . . . . . . . . . . . . . . . . . . . . . . . . . . . . . . . . . . . . . . . . . . . . . . . . . . . . . . . . . . . . . . . . . . . . . . . . . . . . . . . . . . . . . 14<br />
VALLEY-WIDE SEPTIC-SYSTEM DENSITY EVALUATION . . . . . . . . . . . . . . . . . . . . . . . . . . . . . . . . . . . . . . . . . . . . . . . . . . . 15<br />
SITE-SPECIFIC SEPTIC-SYSTEM DENSITY EVALUATIONS . . . . . . . . . . . . . . . . . . . . . . . . . . . . . . . . . . . . . . . . . . . . . . . . . . 16<br />
Areas . . . . . . . . . . . . . . . . . . . . . . . . . . . . . . . . . . . . . . . . . . . . . . . . . . . . . . . . . . . . . . . . . . . . . . . . . . . . . . . . . . . . . . . . . . . . 16<br />
Variables Considered . . . . . . . . . . . . . . . . . . . . . . . . . . . . . . . . . . . . . . . . . . . . . . . . . . . . . . . . . . . . . . . . . . . . . . . . . . . . . . . . 16<br />
Zone <strong>of</strong> Mix<strong>in</strong>g . . . . . . . . . . . . . . . . . . . . . . . . . . . . . . . . . . . . . . . . . . . . . . . . . . . . . . . . . . . . . . . . . . . . . . . . . . . . . . . . . . . . 16<br />
Hamiltons Fort Area . . . . . . . . . . . . . . . . . . . . . . . . . . . . . . . . . . . . . . . . . . . . . . . . . . . . . . . . . . . . . . . . . . . . . . . . . . . . . . . . 16<br />
Location and Area . . . . . . . . . . . . . . . . . . . . . . . . . . . . . . . . . . . . . . . . . . . . . . . . . . . . . . . . . . . . . . . . . . . . . . . . . . . . . . . 16<br />
Surficial Geology . . . . . . . . . . . . . . . . . . . . . . . . . . . . . . . . . . . . . . . . . . . . . . . . . . . . . . . . . . . . . . . . . . . . . . . . . . . . . . . 16<br />
Ground-Water Conditions . . . . . . . . . . . . . . . . . . . . . . . . . . . . . . . . . . . . . . . . . . . . . . . . . . . . . . . . . . . . . . . . . . . . . . . . . 16<br />
Occurrence . . . . . . . . . . . . . . . . . . . . . . . . . . . . . . . . . . . . . . . . . . . . . . . . . . . . . . . . . . . . . . . . . . . . . . . . . . . . . . . . 16<br />
Depth and transmissivity . . . . . . . . . . . . . . . . . . . . . . . . . . . . . . . . . . . . . . . . . . . . . . . . . . . . . . . . . . . . . . . . . . . . . . 17<br />
Ground-water flow . . . . . . . . . . . . . . . . . . . . . . . . . . . . . . . . . . . . . . . . . . . . . . . . . . . . . . . . . . . . . . . . . . . . . . . . . . . 17<br />
Exist<strong>in</strong>g Nitrate Concentrations . . . . . . . . . . . . . . . . . . . . . . . . . . . . . . . . . . . . . . . . . . . . . . . . . . . . . . . . . . . . . . . . . . . . 17<br />
Aquifer Test . . . . . . . . . . . . . . . . . . . . . . . . . . . . . . . . . . . . . . . . . . . . . . . . . . . . . . . . . . . . . . . . . . . . . . . . . . . . . . . . . . . 20<br />
General . . . . . . . . . . . . . . . . . . . . . . . . . . . . . . . . . . . . . . . . . . . . . . . . . . . . . . . . . . . . . . . . . . . . . . . . . . . . . . . . . . . 20<br />
Aquifer-test wells and pump . . . . . . . . . . . . . . . . . . . . . . . . . . . . . . . . . . . . . . . . . . . . . . . . . . . . . . . . . . . . . . . . . . . 20<br />
Analysis . . . . . . . . . . . . . . . . . . . . . . . . . . . . . . . . . . . . . . . . . . . . . . . . . . . . . . . . . . . . . . . . . . . . . . . . . . . . . . . . . . . 20<br />
Results . . . . . . . . . . . . . . . . . . . . . . . . . . . . . . . . . . . . . . . . . . . . . . . . . . . . . . . . . . . . . . . . . . . . . . . . . . . . . . . . . . . . . . . 21<br />
Recommendations <strong>for</strong> Land-Use Plann<strong>in</strong>g . . . . . . . . . . . . . . . . . . . . . . . . . . . . . . . . . . . . . . . . . . . . . . . . . . . . . . . . . . . . 21
Bauers Knoll Area . . . . . . . . . . . . . . . . . . . . . . . . . . . . . . . . . . . . . . . . . . . . . . . . . . . . . . . . . . . . . . . . . . . . . . . . . . . . . . . . . . 23<br />
Location and Area . . . . . . . . . . . . . . . . . . . . . . . . . . . . . . . . . . . . . . . . . . . . . . . . . . . . . . . . . . . . . . . . . . . . . . . . . . . . . . . 23<br />
Surficial Geology . . . . . . . . . . . . . . . . . . . . . . . . . . . . . . . . . . . . . . . . . . . . . . . . . . . . . . . . . . . . . . . . . . . . . . . . . . . . . . . 23<br />
Ground-Water Conditions . . . . . . . . . . . . . . . . . . . . . . . . . . . . . . . . . . . . . . . . . . . . . . . . . . . . . . . . . . . . . . . . . . . . . . . . . 23<br />
Occurrence . . . . . . . . . . . . . . . . . . . . . . . . . . . . . . . . . . . . . . . . . . . . . . . . . . . . . . . . . . . . . . . . . . . . . . . . . . . . . . . . 23<br />
Depth and transmissivity . . . . . . . . . . . . . . . . . . . . . . . . . . . . . . . . . . . . . . . . . . . . . . . . . . . . . . . . . . . . . . . . . . . . . . 23<br />
Ground-water flow . . . . . . . . . . . . . . . . . . . . . . . . . . . . . . . . . . . . . . . . . . . . . . . . . . . . . . . . . . . . . . . . . . . . . . . . . . . 23<br />
Exist<strong>in</strong>g Nitrate Concentrations . . . . . . . . . . . . . . . . . . . . . . . . . . . . . . . . . . . . . . . . . . . . . . . . . . . . . . . . . . . . . . . . . . . . 23<br />
Aquifer Test . . . . . . . . . . . . . . . . . . . . . . . . . . . . . . . . . . . . . . . . . . . . . . . . . . . . . . . . . . . . . . . . . . . . . . . . . . . . . . . . . . . 23<br />
General . . . . . . . . . . . . . . . . . . . . . . . . . . . . . . . . . . . . . . . . . . . . . . . . . . . . . . . . . . . . . . . . . . . . . . . . . . . . . . . . . . . 23<br />
Aquifer-test well and pump . . . . . . . . . . . . . . . . . . . . . . . . . . . . . . . . . . . . . . . . . . . . . . . . . . . . . . . . . . . . . . . . . . . . 25<br />
Analysis . . . . . . . . . . . . . . . . . . . . . . . . . . . . . . . . . . . . . . . . . . . . . . . . . . . . . . . . . . . . . . . . . . . . . . . . . . . . . . . . . . . 25<br />
Results . . . . . . . . . . . . . . . . . . . . . . . . . . . . . . . . . . . . . . . . . . . . . . . . . . . . . . . . . . . . . . . . . . . . . . . . . . . . . . . . . . . . . . . 25<br />
Recommendations For Land-Use Plann<strong>in</strong>g . . . . . . . . . . . . . . . . . . . . . . . . . . . . . . . . . . . . . . . . . . . . . . . . . . . . . . . . . . . . 28<br />
Mid Valley Estates Area . . . . . . . . . . . . . . . . . . . . . . . . . . . . . . . . . . . . . . . . . . . . . . . . . . . . . . . . . . . . . . . . . . . . . . . . . . . . . . 28<br />
Location and Area . . . . . . . . . . . . . . . . . . . . . . . . . . . . . . . . . . . . . . . . . . . . . . . . . . . . . . . . . . . . . . . . . . . . . . . . . . . . . . . 28<br />
Surficial Geology . . . . . . . . . . . . . . . . . . . . . . . . . . . . . . . . . . . . . . . . . . . . . . . . . . . . . . . . . . . . . . . . . . . . . . . . . . . . . . . 28<br />
Ground-Water Conditions . . . . . . . . . . . . . . . . . . . . . . . . . . . . . . . . . . . . . . . . . . . . . . . . . . . . . . . . . . . . . . . . . . . . . . . . . 29<br />
Occurrence . . . . . . . . . . . . . . . . . . . . . . . . . . . . . . . . . . . . . . . . . . . . . . . . . . . . . . . . . . . . . . . . . . . . . . . . . . . . . . . . 29<br />
Depth and transmissivity . . . . . . . . . . . . . . . . . . . . . . . . . . . . . . . . . . . . . . . . . . . . . . . . . . . . . . . . . . . . . . . . . . . . . . 29<br />
Ground-water flow . . . . . . . . . . . . . . . . . . . . . . . . . . . . . . . . . . . . . . . . . . . . . . . . . . . . . . . . . . . . . . . . . . . . . . . . . . . 29<br />
Exist<strong>in</strong>g Nitrate Concentrations . . . . . . . . . . . . . . . . . . . . . . . . . . . . . . . . . . . . . . . . . . . . . . . . . . . . . . . . . . . . . . . . . . . . 29<br />
Aquifer Test . . . . . . . . . . . . . . . . . . . . . . . . . . . . . . . . . . . . . . . . . . . . . . . . . . . . . . . . . . . . . . . . . . . . . . . . . . . . . . . . . . . .29<br />
General . . . . . . . . . . . . . . . . . . . . . . . . . . . . . . . . . . . . . . . . . . . . . . . . . . . . . . . . . . . . . . . . . . . . . . . . . . . . . . . . . . . 29<br />
Aquifer-test well . . . . . . . . . . . . . . . . . . . . . . . . . . . . . . . . . . . . . . . . . . . . . . . . . . . . . . . . . . . . . . . . . . . . . . . . . . . . 30<br />
Analysis . . . . . . . . . . . . . . . . . . . . . . . . . . . . . . . . . . . . . . . . . . . . . . . . . . . . . . . . . . . . . . . . . . . . . . . . . . . . . . . . . . . 30<br />
Results . . . . . . . . . . . . . . . . . . . . . . . . . . . . . . . . . . . . . . . . . . . . . . . . . . . . . . . . . . . . . . . . . . . . . . . . . . . . . . . . . . . . . . . 32<br />
Recommendations For Land-Use Plann<strong>in</strong>g . . . . . . . . . . . . . . . . . . . . . . . . . . . . . . . . . . . . . . . . . . . . . . . . . . . . . . . . . . . . 33<br />
Discussion . . . . . . . . . . . . . . . . . . . . . . . . . . . . . . . . . . . . . . . . . . . . . . . . . . . . . . . . . . . . . . . . . . . . . . . . . . . . . . . . . . . . . . . . 33<br />
SUMMARY AND CONCLUSIONS . . . . . . . . . . . . . . . . . . . . . . . . . . . . . . . . . . . . . . . . . . . . . . . . . . . . . . . . . . . . . . . . . . . . . . . 34<br />
ACKNOWLEDGMENTS . . . . . . . . . . . . . . . . . . . . . . . . . . . . . . . . . . . . . . . . . . . . . . . . . . . . . . . . . . . . . . . . . . . . . . . . . . . . . . . 35<br />
REFERENCES . . . . . . . . . . . . . . . . . . . . . . . . . . . . . . . . . . . . . . . . . . . . . . . . . . . . . . . . . . . . . . . . . . . . . . . . . . . . . . . . . . . . . . . . 36<br />
APPENDIX A: Drillers’ Logs <strong>of</strong> Sampled Wells . . . . . . . . . . . . . . . . . . . . . . . . . . . . . . . . . . . . . . . . . . . . . . . . . . . . . . . . . . . . . . . 39<br />
APPENDIX B: Drillers’ Logs <strong>of</strong> Aquifer Test Wells . . . . . . . . . . . . . . . . . . . . . . . . . . . . . . . . . . . . . . . . . . . . . . . . . . . . . . . . . . . . 61<br />
ILLUSTRATIONS<br />
Figure 1. Location map <strong>of</strong> Cedar Valley . . . . . . . . . . . . . . . . . . . . . . . . . . . . . . . . . . . . . . . . . . . . . . . . . . . . . . . . . . . . . . . . . . . . . 2<br />
Figure 2. Number<strong>in</strong>g system <strong>for</strong> wells <strong>in</strong> Utah . . . . . . . . . . . . . . . . . . . . . . . . . . . . . . . . . . . . . . . . . . . . . . . . . . . . . . . . . . . . . . . . . 4<br />
Figure 3. Sources <strong>of</strong> geologic mapp<strong>in</strong>g <strong>in</strong> Cedar Valley which were used <strong>for</strong> this study . . . . . . . . . . . . . . . . . . . . . . . . . . . . . . . . . . 6<br />
Figure 4. Simplified geologic map <strong>of</strong> Cedar Valley . . . . . . . . . . . . . . . . . . . . . . . . . . . . . . . . . . . . . . . . . . . . . . . . . . . . . . . . . . . . . 7<br />
Figure 5. Schematic block diagram show<strong>in</strong>g ground-water conditions <strong>in</strong> Cedar Valley . . . . . . . . . . . . . . . . . . . . . . . . . . . . . . . . . . 9<br />
Figure 6. Projected <strong>septic</strong>-<strong>tank</strong>-system <strong>density</strong> versus nitrate concentration <strong>for</strong> the pr<strong>in</strong>cipal <strong>valley</strong> fill aquifer<br />
<strong>in</strong> Cedar Valley . . . . . . . . . . . . . . . . . . . . . . . . . . . . . . . . . . . . . . . . . . . . . . . . . . . . . . . . . . . . . . . . . . . . . . . . . . . . . . . . . 15<br />
Figure 7. View <strong>of</strong> Hamiltons Fort area . . . . . . . . . . . . . . . . . . . . . . . . . . . . . . . . . . . . . . . . . . . . . . . . . . . . . . . . . . . . . . . . . . . . . . 17<br />
Figure 8. Geologic cross section <strong>of</strong> Hamiltons Fort area . . . . . . . . . . . . . . . . . . . . . . . . . . . . . . . . . . . . . . . . . . . . . . . . . . . . . . . . 18<br />
Figure 9. Nitrate concentrations <strong>for</strong> the water wells <strong>in</strong> the Hamiltons Fort area . . . . . . . . . . . . . . . . . . . . . . . . . . . . . . . . . . . . . . . 19<br />
Figure 10. Hamiltons Fort area, drawdown data plot . . . . . . . . . . . . . . . . . . . . . . . . . . . . . . . . . . . . . . . . . . . . . . . . . . . . . . . . . . . 21<br />
Figure 11. Projected <strong>septic</strong>-<strong>tank</strong>-system <strong>density</strong> versus nitrate concentration <strong>for</strong> the Hamiltons Fort area based on<br />
28 exist<strong>in</strong>g <strong>septic</strong> systems . . . . . . . . . . . . . . . . . . . . . . . . . . . . . . . . . . . . . . . . . . . . . . . . . . . . . . . . . . . . . . . . . . . . . . . . . 22
Figure 12. Projected <strong>septic</strong>-<strong>tank</strong>-system <strong>density</strong> versus nitrate concentration <strong>for</strong> the Hamiltons Fort area based on<br />
100 exist<strong>in</strong>g <strong>septic</strong> systems . . . . . . . . . . . . . . . . . . . . . . . . . . . . . . . . . . . . . . . . . . . . . . . . . . . . . . . . . . . . . . . . . . . . . . . . 22<br />
Figure 13. View <strong>of</strong> Bauers Knoll area . . . . . . . . . . . . . . . . . . . . . . . . . . . . . . . . . . . . . . . . . . . . . . . . . . . . . . . . . . . . . . . . . . . . . . 24<br />
Figure 14. Schematic geologic cross section <strong>of</strong> Bauers Knoll area . . . . . . . . . . . . . . . . . . . . . . . . . . . . . . . . . . . . . . . . . . . . . . . . 24<br />
Figure 15. Nitrate concentrations <strong>for</strong> the water wells <strong>in</strong> the Bauers Knoll area . . . . . . . . . . . . . . . . . . . . . . . . . . . . . . . . . . . . . . . . 26<br />
Figure 16. Bauers Knoll area, drawdown data plot . . . . . . . . . . . . . . . . . . . . . . . . . . . . . . . . . . . . . . . . . . . . . . . . . . . . . . . . . . . . . 27<br />
Figure 17. Projected <strong>septic</strong>-<strong>tank</strong>-system <strong>density</strong> versus nitrate concentration <strong>for</strong> the Bauers Knoll area based on<br />
10 exist<strong>in</strong>g <strong>septic</strong> systems . . . . . . . . . . . . . . . . . . . . . . . . . . . . . . . . . . . . . . . . . . . . . . . . . . . . . . . . . . . . . . . . . . . . . . . . . 27<br />
Figure 18. Projected <strong>septic</strong>-<strong>tank</strong>-system <strong>density</strong> versus nitrate concentration <strong>for</strong> the Bauers Knoll area based on<br />
50 exist<strong>in</strong>g <strong>septic</strong> systems . . . . . . . . . . . . . . . . . . . . . . . . . . . . . . . . . . . . . . . . . . . . . . . . . . . . . . . . . . . . . . . . . . . . . . . . . 28<br />
Figure 19. View <strong>of</strong> Mid Valley Estates area . . . . . . . . . . . . . . . . . . . . . . . . . . . . . . . . . . . . . . . . . . . . . . . . . . . . . . . . . . . . . . . . . . 29<br />
Figure 20. Geologic cross section <strong>of</strong> Mid Valley Estates area . . . . . . . . . . . . . . . . . . . . . . . . . . . . . . . . . . . . . . . . . . . . . . . . . . . . . 30<br />
Figure 21. Nitrate concentrations <strong>for</strong> the water wells <strong>in</strong> the Mid Valley Estates area . . . . . . . . . . . . . . . . . . . . . . . . . . . . . . . . . . . 31<br />
Figure 22. Mid Valley Estates area, drawdown data plot . . . . . . . . . . . . . . . . . . . . . . . . . . . . . . . . . . . . . . . . . . . . . . . . . . . . . . . . 32<br />
TABLES<br />
Table 1. Nitrate concentration <strong>in</strong> ground water <strong>for</strong> wells <strong>in</strong> Cedar Valley (data from Thomas and Taylor, 1946) . . . . . . . . . . . . . . . 12<br />
Table 2. Nitrate concentration <strong>in</strong> ground water <strong>for</strong> wells <strong>in</strong> Cedar Valley (data from Sandberg, 1966) . . . . . . . . . . . . . . . . . . . . . . 12<br />
Table 3. Nitrate concentration <strong>in</strong> ground water <strong>for</strong> wells <strong>in</strong> Cedar Valley (data from Bjorklund and others, 1978) . . . . . . . . . . . . . 13<br />
Table 4. Typical characteristics <strong>of</strong> wastewater from <strong>septic</strong>-<strong>tank</strong> systems (from Hansen, Allen, and Luce, Inc., 1994) . . . . . . . . . . . 14<br />
Table 5. Nitrate data <strong>for</strong> Hamiltons Fort area . . . . . . . . . . . . . . . . . . . . . . . . . . . . . . . . . . . . . . . . . . . . . . . . . . . . . . . . . . . . . . . . . 18<br />
Table 6. Parameters used to compute amount <strong>of</strong> ground water available <strong>for</strong> mix<strong>in</strong>g . . . . . . . . . . . . . . . . . . . . . . . . . . . . . . . . . . . . 23<br />
Table 7. Nitrate data <strong>for</strong> Bauers Knoll area . . . . . . . . . . . . . . . . . . . . . . . . . . . . . . . . . . . . . . . . . . . . . . . . . . . . . . . . . . . . . . . . . . 25<br />
Table 8. Nitrate data <strong>for</strong> Mid Valley Estates area . . . . . . . . . . . . . . . . . . . . . . . . . . . . . . . . . . . . . . . . . . . . . . . . . . . . . . . . . . . . . . 30<br />
Table 9. Ground-water flow available <strong>for</strong> mix<strong>in</strong>g verus amount <strong>of</strong> effluent from <strong>septic</strong> <strong>tank</strong>s <strong>in</strong> Cedar Valley . . . . . . . . . . . . . . . . 33<br />
Table 10. Results <strong>of</strong> <strong>septic</strong>-<strong>tank</strong> <strong>density</strong> calculations <strong>for</strong> Hamiltons Fort, Bauers Knoll, and Mid Valley Estates study <strong>areas</strong> . . . . . 34
ANALYSIS OF SEPTIC-TANK DENSITY FOR THREE AREAS<br />
IN CEDAR VALLEY, IRON COUNTY, UTAH – A CASE STUDY<br />
FOR EVALUATIONS OF PROPOSED SUBDIVISIONS IN<br />
CEDAR VALLEY<br />
by<br />
Mike Lowe, Janae Wallace, and Charles E. Bishop<br />
Utah Geological Survey<br />
ABSTRACT<br />
Cedar Valley, Iron County, is experienc<strong>in</strong>g an <strong>in</strong>crease <strong>in</strong><br />
residential development, much <strong>of</strong> which uses <strong>septic</strong> <strong>tank</strong><br />
soil-absorption systems <strong>for</strong> wastewater disposal. Septic <strong>tank</strong><br />
soil-absorption systems are considered one <strong>of</strong> the major<br />
potential sources <strong>of</strong> water-quality degradation, and public<br />
<strong>of</strong>ficials would like to have a scientific basis <strong>for</strong> determ<strong>in</strong><strong>in</strong>g<br />
recommended densities/lot sizes <strong>for</strong> <strong>septic</strong>-<strong>tank</strong> systems as a<br />
land-use plann<strong>in</strong>g tool. We per<strong>for</strong>med site-specific mass balance-approach<br />
evaluations <strong>for</strong> <strong>three</strong> <strong>areas</strong> <strong>in</strong> Cedar Valley,<br />
situated on unconsolidated deposits <strong>of</strong> the pr<strong>in</strong>cipal <strong>valley</strong>fill<br />
aquifer, as part <strong>of</strong> a U.S. Env<strong>iron</strong>mental Protection<br />
Agency Regional Geographic Initiative grant; these evaluations<br />
can be used as models <strong>for</strong> evaluations <strong>of</strong> proposed subdivisions<br />
<strong>in</strong> Cedar Valley.<br />
We applied a mass-balance equation to <strong>three</strong> <strong>areas</strong> <strong>in</strong><br />
southern Cedar Valley (the Hamiltons Fort, Bauers Knoll,<br />
and Mid Valley Estates <strong>areas</strong>) us<strong>in</strong>g site-specific groundwater<br />
flow available <strong>for</strong> mix<strong>in</strong>g and site-specific groundwater-quality<br />
data to help with determ<strong>in</strong><strong>in</strong>g recommended<br />
<strong>septic</strong>-system <strong>density</strong>/lot size. We used an allowable degradation<br />
<strong>in</strong> water quality <strong>of</strong> 1 mg/L with respect to nitrate, but<br />
provided an additional <strong>analysis</strong> <strong>for</strong> the Bauers Knoll area to<br />
show the level to which <strong>septic</strong>-system <strong>density</strong> could be<br />
<strong>in</strong>creased if higher levels <strong>of</strong> water-quality degradation were<br />
deemed acceptable. We used a mix<strong>in</strong>g zone thickness <strong>of</strong> 60<br />
feet (18 m) <strong>for</strong> all <strong>three</strong> <strong>areas</strong>.<br />
The results <strong>of</strong> the mass-balance analyses varied considerably<br />
from one area to another, as did the applicability <strong>of</strong> the<br />
approach as a land-use management tool. For the Hamiltons<br />
Fort area to ma<strong>in</strong>ta<strong>in</strong> an overall nitrate concentration <strong>of</strong> 3.15<br />
mg/L, the total number <strong>of</strong> homes us<strong>in</strong>g <strong>septic</strong> <strong>tank</strong> soilabsorption<br />
systems should not exceed about 760; this corresponds<br />
to a total <strong>in</strong>crease <strong>of</strong> approximately 660 new <strong>septic</strong><br />
systems and a recommended average <strong>septic</strong>-system <strong>density</strong><br />
<strong>of</strong> about 5.6 acres/system (0.02 km 2 /system) <strong>in</strong> the area. For<br />
the Bauers Knoll area to ma<strong>in</strong>ta<strong>in</strong> an overall nitrate concentration<br />
<strong>of</strong> 1.49 mg/L, the number <strong>of</strong> homes us<strong>in</strong>g <strong>septic</strong> <strong>tank</strong><br />
soil-absorption systems should not exceed about 70; this corresponds<br />
to a total <strong>in</strong>crease <strong>of</strong> approximately 20 <strong>septic</strong> systems<br />
and an average <strong>septic</strong>-system <strong>density</strong> <strong>of</strong> about 54<br />
acres/system (0.2 km 2 /system) <strong>in</strong> the area. We do not consider<br />
the mass-balance approach to be the best land-use management<br />
tool <strong>for</strong> the Mid Valley Estates area, where the<br />
amount <strong>of</strong> water from <strong>septic</strong>-<strong>tank</strong> effluent is <strong>three</strong> times more<br />
than the ground-water flow available <strong>for</strong> mix<strong>in</strong>g, and there is<br />
an apparent upward vertical-head gradient <strong>in</strong> the aquifer. A<br />
public, <strong>valley</strong>-wide sewer system is a better alternative <strong>for</strong><br />
domestic wastewater disposal <strong>in</strong> most <strong>areas</strong> <strong>in</strong> Cedar Valley,<br />
especially the Mid Valley Estates area.<br />
INTRODUCTION<br />
Cedar Valley, Iron County, is a rural area <strong>in</strong> Utah (figure<br />
1) experienc<strong>in</strong>g an <strong>in</strong>crease <strong>in</strong> residential development.<br />
Most <strong>of</strong> this development, much <strong>of</strong> which uses <strong>septic</strong> <strong>tank</strong><br />
soil-absorption systems <strong>for</strong> wastewater disposal, is situated<br />
on unconsolidated deposits <strong>of</strong> the pr<strong>in</strong>cipal <strong>valley</strong>-fill<br />
aquifer. Nitrate is the pr<strong>in</strong>cipal ground-water contam<strong>in</strong>ant<br />
identified <strong>in</strong> previous studies <strong>in</strong> Cedar Valley (Joe Mell<strong>in</strong>g,<br />
Cedar City Manager, verbal communication, 1997). Nitrate<br />
is a useful <strong>in</strong>dicator <strong>of</strong> human impact on ground-water quality<br />
and thus can aid <strong>in</strong> determ<strong>in</strong><strong>in</strong>g any deleterious effects <strong>of</strong><br />
development.<br />
Ground water provides almost all <strong>of</strong> the dr<strong>in</strong>k<strong>in</strong>g-water<br />
supply <strong>in</strong> Cedar Valley. Preservation <strong>of</strong> ground-water quality<br />
and the potential <strong>for</strong> ground-water-quality degradation are<br />
critical issues that should be considered <strong>in</strong> determ<strong>in</strong><strong>in</strong>g the<br />
extent and nature <strong>of</strong> future development <strong>in</strong> Cedar Valley.<br />
Local government <strong>of</strong>ficials <strong>in</strong> Iron County have expressed<br />
concern about the potential impact that development may<br />
have on ground-water quality. Septic <strong>tank</strong> soil-absorption<br />
systems are considered one <strong>of</strong> the major potential sources <strong>of</strong><br />
water-quality degradation, and public <strong>of</strong>ficials would like to<br />
have a scientific basis <strong>for</strong> determ<strong>in</strong><strong>in</strong>g recommended densities/lot<br />
sizes <strong>for</strong> <strong>septic</strong>-<strong>tank</strong> systems as a land-use plann<strong>in</strong>g<br />
tool.<br />
Land-use planners have long used <strong>septic</strong>-<strong>tank</strong>-suitability<br />
maps to determ<strong>in</strong>e where these systems will likely percolate<br />
with<strong>in</strong> an acceptable range. However, they are only now<br />
becom<strong>in</strong>g aware that percolation alone does not remove<br />
many constituents found <strong>in</strong> wastewater, <strong>in</strong>clud<strong>in</strong>g nitrate.
2 Utah Geological Survey<br />
113° 00′ 00″<br />
112° 52′ 30″<br />
130<br />
State <strong>of</strong> Utah<br />
38° 00′ 00″<br />
Rush<br />
Lake<br />
CEDAR VALLEY<br />
38° 00′ 00″<br />
N<br />
37° 45′ 00″<br />
Mid Valley<br />
Estates<br />
15<br />
Enoch<br />
37° 45′ 00″<br />
56<br />
Bauers<br />
Knoll<br />
Shirts<br />
Coal<br />
130<br />
Cedar<br />
City<br />
Creek<br />
37° 37′ 30″<br />
Quichapa<br />
Lake<br />
Harmony<br />
Mounta<strong>in</strong>s<br />
Hamiltons<br />
Fort<br />
Cross Hollow<br />
Hills<br />
Creek<br />
Markagunt<br />
Plateau<br />
37° 37′ 30″<br />
113° 15′ 00″<br />
113° 00′ 00″<br />
4 0 4 8 Miles<br />
Figure 1. Location map <strong>of</strong> Cedar Valley, Iron County, Utah. The <strong>three</strong> study <strong>areas</strong> are shaded.
Analysis <strong>of</strong> <strong>septic</strong>-<strong>tank</strong> <strong>density</strong>, Cedar Valley, Iron County, Utah<br />
Ammonium from <strong>septic</strong>-<strong>tank</strong> effluent under aerobic conditions<br />
can convert to nitrate, contam<strong>in</strong>at<strong>in</strong>g ground water and<br />
pos<strong>in</strong>g potential health risks to humans (primarily very<br />
young <strong>in</strong>fants). The U.S. Env<strong>iron</strong>mental Protection Agency’s<br />
maximum contam<strong>in</strong>ant level <strong>for</strong> dr<strong>in</strong>k<strong>in</strong>g water (Utah<br />
ground-water-quality standard) <strong>for</strong> nitrate is 10 mg/L (<strong>for</strong> the<br />
ranges <strong>of</strong> nitrate and total-dissolved-solids concentrations<br />
used <strong>in</strong> this report, mg/L equals parts per million). With cont<strong>in</strong>ued<br />
growth and <strong>in</strong>stallation <strong>of</strong> <strong>septic</strong> <strong>tank</strong> soil-absorption<br />
systems <strong>in</strong> new developments, the potential <strong>for</strong> nitrate contam<strong>in</strong>ation<br />
will <strong>in</strong>crease. One way to evaluate the potential<br />
impact <strong>of</strong> <strong>septic</strong>-<strong>tank</strong> systems on ground-water quality is to<br />
per<strong>for</strong>m a mass-balance calculation (Hansen, Allen, and<br />
Luce, Inc., 1994; Zhan and McKay, 1998). This type <strong>of</strong><br />
<strong>analysis</strong> may be used as a gross model <strong>for</strong> evaluat<strong>in</strong>g the possible<br />
impact <strong>of</strong> proposed developments us<strong>in</strong>g <strong>septic</strong>-<strong>tank</strong> systems<br />
<strong>for</strong> wastewater disposal on ground-water quality and<br />
allow<strong>in</strong>g planners to more effectively determ<strong>in</strong>e appropriate<br />
average development densities (lot sizes).<br />
The results <strong>of</strong> this project, funded primarily by the U.S.<br />
Env<strong>iron</strong>mental Protection Agency through a Regional Geographic<br />
Initiative grant, provide a site-specific evaluation <strong>of</strong><br />
acceptable build<strong>in</strong>g <strong>density</strong> <strong>for</strong> <strong>three</strong> <strong>areas</strong> <strong>in</strong> Cedar Valley<br />
utiliz<strong>in</strong>g <strong>in</strong>dividual wastewater systems. This study will provide<br />
a model <strong>for</strong> others conduct<strong>in</strong>g similar evaluations. It<br />
also helps underscore the need to protect ground-water quality<br />
<strong>in</strong> <strong>areas</strong> experienc<strong>in</strong>g population growth.<br />
Purpose and Scope<br />
The purpose <strong>of</strong> this study is to assess the impact <strong>of</strong> <strong>septic</strong><br />
<strong>tank</strong> soil-absorption systems on ground-water quality <strong>for</strong><br />
<strong>three</strong> <strong>areas</strong> <strong>in</strong> Cedar Valley where <strong>septic</strong> <strong>tank</strong> soil-absorption<br />
systems are typically used <strong>for</strong> wastewater disposal. These<br />
<strong>areas</strong> have some exist<strong>in</strong>g development, but we anticipate that<br />
there will be additional development <strong>in</strong> the future. The Utah<br />
Geological Survey (UGS) evaluated the potential impact <strong>of</strong><br />
the projected potential development on ground-water quality<br />
based on <strong>septic</strong>-<strong>tank</strong>-system densities us<strong>in</strong>g a mass-balance<br />
approach similar to an <strong>analysis</strong> conducted by Hansen, Allen,<br />
and Luce (1994) <strong>for</strong> Heber and Round Valleys, Wasatch<br />
County, Utah. The selection <strong>of</strong> the evaluated <strong>areas</strong> was made<br />
<strong>in</strong> consultation with local government <strong>of</strong>ficials. This study<br />
may be used as a model <strong>for</strong> other evaluations <strong>of</strong> the impact<br />
<strong>of</strong> proposed subdivision site(s) on ground-water quality and<br />
allow planners to more effectively determ<strong>in</strong>e appropriate<br />
development densities (lot sizes).<br />
To evaluate the effects <strong>of</strong> <strong>in</strong>creased numbers <strong>of</strong> <strong>septic</strong><br />
systems on ground-water quality <strong>for</strong> subdivision sites, we<br />
obta<strong>in</strong>ed local aquifer parameters <strong>for</strong> <strong>for</strong>mulat<strong>in</strong>g a more<br />
accurate mass-balance equation. The steps required to apply<br />
this approach <strong>in</strong>cluded: (1) determ<strong>in</strong><strong>in</strong>g ground-water-flow<br />
transect-area acreage and aquifer mix<strong>in</strong>g zone volume; (2)<br />
obta<strong>in</strong><strong>in</strong>g the number <strong>of</strong> exist<strong>in</strong>g <strong>septic</strong>-<strong>tank</strong> systems <strong>in</strong> the<br />
area; (3) determ<strong>in</strong><strong>in</strong>g ambient (background) nitrate concentration;<br />
(4) calculat<strong>in</strong>g, us<strong>in</strong>g the appropriate amount <strong>of</strong><br />
wastewater and accompany<strong>in</strong>g nitrogen load <strong>in</strong>troduced per<br />
system (based on the literature search <strong>of</strong> Hansen, Allen, and<br />
Luce [1994]), projected nitrogen load<strong>in</strong>gs based on the projected<br />
number <strong>of</strong> <strong>septic</strong> <strong>tank</strong> soil-absorption systems to be<br />
used <strong>in</strong> the proposed subdivisions; and (5) determ<strong>in</strong><strong>in</strong>g the<br />
volume <strong>of</strong> ground water available <strong>for</strong> mix<strong>in</strong>g along the proposed<br />
ground-water-flow transect us<strong>in</strong>g the appropriate<br />
equations.<br />
For each area, the scope <strong>of</strong> work <strong>in</strong>cluded:<br />
1. compil<strong>in</strong>g exist<strong>in</strong>g topographic and geologic<br />
maps and drillers’ logs,<br />
2. determ<strong>in</strong><strong>in</strong>g local area acreage,<br />
3. analyz<strong>in</strong>g water-well drillers’ logs to determ<strong>in</strong>e<br />
the nature, thickness, and extent <strong>of</strong> the aquifer<br />
and the likely mix<strong>in</strong>g zone,<br />
4. select<strong>in</strong>g wells to be sampled and analyz<strong>in</strong>g<br />
water samples <strong>for</strong> nitrate <strong>in</strong> order to calculate<br />
background nitrate concentration <strong>for</strong> the area,<br />
5. measur<strong>in</strong>g water levels <strong>in</strong> exist<strong>in</strong>g wells, where<br />
possible, or us<strong>in</strong>g exist<strong>in</strong>g potentiometric surface<br />
maps to determ<strong>in</strong>e hydraulic gradient and<br />
ground-water-flow direction,<br />
6. select<strong>in</strong>g observation wells and pump<strong>in</strong>g wells<br />
and conduct<strong>in</strong>g aquifer tests over 24-hour periods,<br />
7. comput<strong>in</strong>g volume <strong>of</strong> water available <strong>for</strong> mix<strong>in</strong>g<br />
us<strong>in</strong>g specific-capacity and transmissivity data<br />
from drillers’ logs, and adjust<strong>in</strong>g transmissivities<br />
calculated from specific capacity by compar<strong>in</strong>g<br />
values to measured transmissivities<br />
obta<strong>in</strong>ed from aquifer tests,<br />
8. comput<strong>in</strong>g projected site-specific nitrate concentration<br />
us<strong>in</strong>g the Hansen, Allen, and Luce<br />
(1994) mass-balance approach, but us<strong>in</strong>g the<br />
site-specific parameters obta<strong>in</strong>ed from steps 1<br />
through 6 above to determ<strong>in</strong>e the exist<strong>in</strong>g<br />
nitrogen load and the amount <strong>of</strong> ground water<br />
available <strong>for</strong> mix<strong>in</strong>g, and<br />
9. prepar<strong>in</strong>g this report summariz<strong>in</strong>g f<strong>in</strong>d<strong>in</strong>gs.<br />
Well Number<strong>in</strong>g System<br />
The number<strong>in</strong>g system <strong>for</strong> wells <strong>in</strong> this study is based on<br />
the Federal Government cadastral land-survey system that<br />
divides Utah <strong>in</strong>to four quadrants (A-D) separated by the Salt<br />
Lake Base L<strong>in</strong>e and Meridian (figure 2). The study area is<br />
entirely with<strong>in</strong> the southwestern quadrant (C). The wells are<br />
numbered with this quadrant letter C, followed by township<br />
and range, enclosed <strong>in</strong> parentheses. The next set <strong>of</strong> characters<br />
<strong>in</strong>dicates the section, quarter section, quarter-quarter section,<br />
and quarter-quarter-quarter section, designated by the<br />
letters a through d, <strong>in</strong>dicat<strong>in</strong>g the northeastern, northwestern,<br />
southwestern, and southeastern quadrants, respectively. A<br />
number after the hyphen corresponds to an <strong>in</strong>dividual well<br />
with<strong>in</strong> a quarter-quarter-quarter section. For example, the<br />
well (C-36-12)2adb-1 would be the first well <strong>in</strong> the northwestern<br />
quarter <strong>of</strong> the southeastern quarter <strong>of</strong> the northeastern<br />
quarter <strong>of</strong> section 2, Township 36 South, Range 12 West<br />
(NW1/4SE1/4NE1/4 section 2, T. 36 S., R. 12 W.).<br />
Location and Geography<br />
Cedar Valley is <strong>in</strong> eastern Iron County, southwestern<br />
Utah, between 38°07'15" and 37°32'15" north latitude and<br />
113°23'15" and 112°49' west longitude (figure 1). It is a<br />
northeast to southwest-trend<strong>in</strong>g, elongate <strong>valley</strong> bordered by<br />
3
4 Utah Geological Survey<br />
Sections with<strong>in</strong> a township<br />
Tracts with<strong>in</strong> a section<br />
R. 12 W.<br />
Section 2<br />
Well<br />
6 5 4 3 2 1<br />
b<br />
a<br />
T. 36 S.<br />
7 8 9 10 11 12<br />
18 17 16 15 14 13<br />
b<br />
c<br />
a<br />
Well<br />
b a<br />
d<br />
c d<br />
19 20 21 22 23 24<br />
30 29 28 27 26 25<br />
c<br />
d<br />
31 32 33 34 35 36<br />
6 miles<br />
9.7 kilometers<br />
1 mile<br />
1.6 kilometers<br />
(C-36-12) 2adb-1<br />
B<br />
A<br />
SALT LAKE BASE LINE<br />
Salt Lake City<br />
C<br />
SALT LAKE MERIDIAN<br />
T. 36 S. R. 12 W.<br />
D<br />
Figure 2. Number<strong>in</strong>g system <strong>for</strong> wells <strong>in</strong> Utah (see text <strong>for</strong> additional explanation).
Analysis <strong>of</strong> <strong>septic</strong>-<strong>tank</strong> <strong>density</strong>, Cedar Valley, Iron County, Utah<br />
the Black Mounta<strong>in</strong>s to the north, the Markagunt Plateau to<br />
the east, low-ly<strong>in</strong>g mounta<strong>in</strong>s and hills to the west, and the<br />
Harmony Mounta<strong>in</strong>s to the southwest. The floor <strong>of</strong> Cedar<br />
Valley is approximately 32 miles (51 km) long and ranges<br />
from 8 miles (13 km) wide at its northern boundary to less<br />
than 1 mile (1.6 km) wide <strong>in</strong> the south. The floor <strong>of</strong> Cedar<br />
Valley covers 170 square miles (440 km 2 ); its dra<strong>in</strong>age bas<strong>in</strong><br />
encompasses more than 580 square miles (1,502 km 2 ). Elevations<br />
range from 11,307 feet (3,446 m) at Brian Head <strong>in</strong><br />
the Markagunt Plateau to about 5,350 feet (1,631 m) at the<br />
outlet at Mud Spr<strong>in</strong>gs Wash <strong>in</strong> the northwest part <strong>of</strong> the <strong>valley</strong><br />
(Bjorklund and others, 1978).<br />
Coal Creek, the pr<strong>in</strong>cipal perennial stream <strong>in</strong> Cedar Valley,<br />
flows westward from the Markagunt Plateau and has<br />
deposited a large alluvial fan <strong>in</strong> the Cedar City area (Bjorklund<br />
and others, 1978). Shirts Creek, a smaller perennial<br />
stream dra<strong>in</strong><strong>in</strong>g the Markagunt Plateau, enters Cedar Valley<br />
near Hamiltons Fort. Fiddlers Canyon Creek, one <strong>of</strong> the<br />
larger <strong>of</strong> the many smaller <strong>in</strong>termittent and ephemeral<br />
streams flow<strong>in</strong>g westward from the Markagunt Plateau,<br />
enters Cedar Valley between Cedar City and Enoch. Quichapa<br />
Creek is a perennial stream flow<strong>in</strong>g northeastward <strong>in</strong>to the<br />
<strong>valley</strong> from the Harmony Mounta<strong>in</strong>s. Surface water flows<br />
westward out <strong>of</strong> Cedar Valley via Mud Spr<strong>in</strong>gs Wash and<br />
Iron Spr<strong>in</strong>gs Gap only dur<strong>in</strong>g rare flash floods follow<strong>in</strong>g<br />
excessive local precipitation (Bjorklund and others, 1978).<br />
Some spr<strong>in</strong>g run<strong>of</strong>f accumulates <strong>in</strong> Quichapa and Rush<br />
Lakes which are shallow playa lakes.<br />
Population and Land Use<br />
Iron County has the fourth-highest county growth rate <strong>in</strong><br />
the state. Iron County’s population <strong>in</strong>creased from 17,349 <strong>in</strong><br />
1980 to 30,477 <strong>in</strong> 1998 (Utah Division <strong>of</strong> Water Rights,<br />
1980, 1995; Demographic and Economic Analysis Section,<br />
1999). Population is projected to grow another 2.6 percent<br />
annually over the next 22 years; by 2020 the population <strong>of</strong><br />
Iron County is expected to be over 54,149 (Demographic and<br />
Economic Analysis Section, 1998).<br />
Government and trade have provided the most employment<br />
<strong>in</strong> Iron County <strong>for</strong> more than a decade; these sectors are<br />
expected to cont<strong>in</strong>ue to provide the most jobs, but employment<br />
<strong>in</strong> the service <strong>in</strong>dustry is expected to <strong>in</strong>crease significantly<br />
(Utah Division <strong>of</strong> Water Resources, 1995, table 4-4).<br />
Although employment <strong>in</strong> agriculture is grow<strong>in</strong>g at a much<br />
lower rate, agricultural commodity production, mostly beef,<br />
dairy, and irrigated crops, will likely cont<strong>in</strong>ue to be an important<br />
part <strong>of</strong> Cedar Valley’s economy (Utah Division <strong>of</strong> Water<br />
Resources, 1995).<br />
Climate<br />
The climate <strong>of</strong> Cedar Valley is characterized by large<br />
daily temperature variations, moderately cold w<strong>in</strong>ters, and<br />
warm, dry summers. Temperatures <strong>in</strong> the <strong>valley</strong> range from<br />
a maximum <strong>of</strong> about 100°F (38°C) to a m<strong>in</strong>imum <strong>of</strong> about 0°<br />
F (-18°C); the maximum daily temperature variation is greatest<br />
<strong>in</strong> the summer when fluctuations can be as much as 40°F<br />
(about 22°C) (Ashcr<strong>of</strong>t and others, 1992). Mean annual temperature<br />
at the Cedar City Airport was 49°F (9°C) from 1961<br />
to 1990 (Utah Division <strong>of</strong> Water Resources, 1995). The<br />
grow<strong>in</strong>g season (the number <strong>of</strong> consecutive frost-free days)<br />
<strong>in</strong> Cedar Valley averages 135 days (Ashcr<strong>of</strong>t and others,<br />
1992; Utah Division <strong>of</strong> Water Resources, 1995).<br />
The Markagunt Plateau receives between 16 and 40<br />
<strong>in</strong>ches (41 and 102 cm) <strong>of</strong> precipitation annually (Utah Division<br />
<strong>of</strong> Water Resources, 1995), mostly as snow dur<strong>in</strong>g the<br />
w<strong>in</strong>ter. Annual precipitation <strong>in</strong> Cedar Valley ranges from<br />
about 8 to 14 <strong>in</strong>ches (20-36 cm) (Bjorklund and others,<br />
1978). At the Cedar City Airport, mean annual precipitation<br />
was 11.5 <strong>in</strong>ches (29.2 cm) and mean annual evapotranspiration<br />
was 34.4 <strong>in</strong>ches (87.4 cm) from 1961 to 1990 (Utah<br />
Division <strong>of</strong> Water Resources, 1995). Most <strong>of</strong> the precipitation<br />
is generated <strong>in</strong> the w<strong>in</strong>ter and spr<strong>in</strong>g by humid air masses<br />
mov<strong>in</strong>g southeastward from the north Pacific (Bjorklund<br />
and others, 1978). Precipitation by snowfall is common <strong>in</strong><br />
Cedar Valley dur<strong>in</strong>g the months <strong>of</strong> December through March,<br />
but snowstorms have been reported and are not uncommon<br />
dur<strong>in</strong>g April and even May (Bjorklund and others, 1978).<br />
PREVIOUS INVESTIGATIONS<br />
Early reconnaissance studies <strong>of</strong> the geology and physiography<br />
<strong>of</strong> southwestern Utah, <strong>in</strong>clud<strong>in</strong>g descriptions <strong>of</strong> the<br />
Cedar Valley area, were conducted by Gilbert (1875), Howell<br />
(1875), Powell (1879), and Dutton (1880). Research on<br />
the coal and ore deposits <strong>of</strong> the Cedar Valley region early <strong>in</strong><br />
the 1900s was conducted by Lee (1907), Leith and Harder<br />
(1908), and Richardson (1909). Figure 3 shows the sources<br />
<strong>of</strong> modern geologic mapp<strong>in</strong>g <strong>in</strong>vestigations which were used<br />
<strong>for</strong> this study. Averitt (1962, 1967), Averitt and Threet<br />
(1973), Rowley (1975, 1976), Mack<strong>in</strong> and others (1976),<br />
Mack<strong>in</strong> and Rowley (1976), Rowley and Threet (1976), Maldonado<br />
and Moore (1993), Maldonado and Williams (1993a,<br />
b), and Moore and Nealey (1993) produced 7.5′ geologic<br />
quadrangle maps <strong>of</strong> the Cedar Valley area; the geologic maps<br />
<strong>of</strong> the Cedar City Northwest and Kanaraville quadrangles by<br />
Mack<strong>in</strong> and others (1976) and Averitt (1967), respectively,<br />
are particularly relevant to our study. Rowley (1978)<br />
mapped the geology <strong>of</strong> the Thermo 15′ quadrangle. Steven<br />
and others (1990) mapped the geology <strong>of</strong> the Richfield 1° x<br />
2° quadrangle which <strong>in</strong>cludes the northern part <strong>of</strong> the study<br />
area. Averitt (1962), Threet (1963), Stewart and others<br />
(1972a, b), and Maldonado and others (1997) studied the<br />
structure <strong>of</strong> the Cedar Valley region. Hunt<strong>in</strong>gton and Goldwait<br />
(1904), Mack<strong>in</strong> (1960), Averitt (1962), Hambl<strong>in</strong> (1970,<br />
1984), Rowley and others (1978), Anderson and Mehnert<br />
(1979), Anderson (1980), and Anderson and Christenson<br />
(1989) studied the Hurricane fault zone and discussed its significance<br />
as a possible boundary between the Bas<strong>in</strong> and<br />
Range and Colorado Plateau physiographic prov<strong>in</strong>ces.<br />
Blank and Mack<strong>in</strong> (1967) made a geologic <strong>in</strong>terpretation <strong>of</strong><br />
an aeromagnetic survey <strong>of</strong> the southwest part <strong>of</strong> the study<br />
area. Epp<strong>in</strong>ger and others (1990) assessed the m<strong>in</strong>eral<br />
resources <strong>of</strong> the Cedar City 1° x 2° quadrangle.<br />
Me<strong>in</strong>zer (1911) conducted an early reconnaissance<br />
<strong>in</strong>vestigation <strong>of</strong> water resources <strong>in</strong> western Utah, <strong>in</strong>clud<strong>in</strong>g<br />
Cedar Valley which he called Rush Lake Valley. Thomas and<br />
Taylor (1946) completed the first comprehensive <strong>in</strong>vestigation<br />
<strong>of</strong> ground-water conditions <strong>in</strong> Cedar Valley. Subsequent<br />
ground-water <strong>in</strong>vestigations were conducted by Thomas and<br />
others (1952) and Sandberg (1963, 1966). Barnett and Mayo<br />
5
6 Utah Geological Survey<br />
113°00'<br />
USGS GQ-1493<br />
(Thermo 15')<br />
(Rowley, 1978)<br />
USGS I-1901<br />
Richfield 1°x2°<br />
(Steven and others,1990)<br />
38°00'<br />
38°00'<br />
USGS GQ-1713<br />
(Maldonado and<br />
Williams, 1993a)<br />
USGS GQ-1302<br />
(Rowley, 1976)<br />
USGS<br />
GQ-1301<br />
(Rowley, 1975)<br />
USGS GQ-1712<br />
(Maldonado and<br />
Williams, 1993b)<br />
USGS GQ-1297<br />
(Mack<strong>in</strong> and<br />
Rowley, 1976)<br />
USGS GQ-1296<br />
(Rowley and<br />
Threet, 1976)<br />
Surface-<br />
Dra<strong>in</strong>age<br />
Boundary<br />
UTAH<br />
37°45'<br />
37°45'<br />
USGS<br />
Pr<strong>of</strong>. Pap. 516B<br />
(Blank and<br />
Mack<strong>in</strong>, 1967)<br />
UGMS Map<br />
(H<strong>in</strong>tze, 1963)<br />
113°15' 113°15'<br />
USGS GQ-1295<br />
(Mack<strong>in</strong> and<br />
others, 1976)<br />
USGS GQ-694<br />
(Averitt, 1967)<br />
USGS GQ-1120<br />
(Averitt and<br />
Threet, 1973)<br />
USGS<br />
Pr<strong>of</strong>. Pap. 389<br />
(Averitt, 1962)<br />
113°00'<br />
USGS<br />
Bullet<strong>in</strong> 2153<br />
(Maldonado and<br />
others, 1997)<br />
0 5 10 miles<br />
0 10 20 30 kilometers<br />
Figure 3. Sources <strong>of</strong> geologic mapp<strong>in</strong>g <strong>in</strong> Cedar Valley, Iron County, Utah, which were used <strong>for</strong> this study.<br />
(1966) made recommendations regard<strong>in</strong>g ground-water management<br />
and warned <strong>of</strong> a potential water-resources crisis <strong>in</strong><br />
Cedar Valley. Bjorklund and others (1977, 1978) conducted<br />
the most recently completed study <strong>of</strong> ground-water conditions<br />
<strong>in</strong> Cedar Valley. S<strong>in</strong>ce then, the Utah Division <strong>of</strong> Water<br />
Resources, the Utah Division <strong>of</strong> Water Quality, and the U.S.<br />
Geological Survey have collected ground-water data periodically<br />
as part <strong>of</strong> an established monitor<strong>in</strong>g network. Previous<br />
work on recommended <strong>septic</strong>-<strong>tank</strong>-system <strong>density</strong>/lot size <strong>in</strong><br />
Cedar Valley <strong>in</strong>cludes Wallace and Lowe (1998a, 1999),<br />
Lowe and Wallace (1999a), and Lowe and others (1999).<br />
GEOLOGIC SETTING<br />
The Cedar Valley dra<strong>in</strong>age bas<strong>in</strong> lies <strong>in</strong> the transition<br />
zone between the Bas<strong>in</strong> and Range and Colorado Plateau<br />
physiographic prov<strong>in</strong>ces (Stokes, 1977). Many geologists<br />
consider the Hurricane fault zone (figure 4), which probably<br />
first <strong>for</strong>med <strong>in</strong> the Pliocene, to be the boundary between the<br />
prov<strong>in</strong>ces (Anderson and Mehnert, 1979). The general location<br />
<strong>of</strong> the Hurricane fault zone is marked by the sheer Hurricane<br />
Cliffs which are up to 2,000 feet (610 m) high (Hambl<strong>in</strong>,<br />
1970). The actual width <strong>of</strong> the fault zone, located at the
Analysis <strong>of</strong> <strong>septic</strong>-<strong>tank</strong> <strong>density</strong>, Cedar Valley, Iron County, Utah<br />
7<br />
Figure 4. Simplified geologic map <strong>of</strong> Cedar Valley, Iron County, Utah. See figure 3<br />
<strong>for</strong> sources <strong>of</strong> mapp<strong>in</strong>g. The <strong>three</strong> study <strong>areas</strong> are shaded.
8 Utah Geological Survey<br />
base <strong>of</strong> the cliffs, is quite variable, but locally up to several<br />
miles wide (Averitt, 1962). South <strong>of</strong> Cedar City, <strong>in</strong> the Cedar<br />
Mounta<strong>in</strong> quadrangle, <strong>for</strong> example, the Hurricane fault zone<br />
is about 3 miles (5 km) wide (Averitt, 1962). Although the<br />
Hurricane fault zone is considered seismically active and<br />
potentially capable <strong>of</strong> produc<strong>in</strong>g future surface-fault<strong>in</strong>g<br />
earthquakes, most movement occurred dur<strong>in</strong>g the Pliocene<br />
and Pleistocene; the elapsed time s<strong>in</strong>ce the last surface-fault<strong>in</strong>g<br />
event is likely between 5,000 and 10,000 years (Pear<strong>three</strong><br />
and others, 1998). Total vertical displacement along the Hurricane<br />
fault zone is estimated as between 1,500 and 4,000<br />
feet (457 and 1,220 m) (Kurie, 1966; Anderson and Mehnert,<br />
1979).<br />
The Markagunt Plateau, east <strong>of</strong> the Hurricane Cliffs, has<br />
some features characteristic <strong>of</strong> the Colorado Plateau physiographic<br />
prov<strong>in</strong>ce, such as high elevation and relief dom<strong>in</strong>ated<br />
by gently dipp<strong>in</strong>g sedimentary rocks that are locally disrupted<br />
by folds and faults. However, the aligned volcanic<br />
cones and prevalent northeast-trend<strong>in</strong>g block faults <strong>of</strong> the<br />
Markagunt Plateau are more typical <strong>of</strong> the Bas<strong>in</strong> and Range<br />
physiographic prov<strong>in</strong>ce. Geomorphic features <strong>of</strong> the Markagunt<br />
Plateau <strong>in</strong>clude: (1) narrow, predom<strong>in</strong>antly westward<br />
slop<strong>in</strong>g, V-shaped <strong>valley</strong>s, (2) steep-sided sharp-crested<br />
ridges, (3) structurally controlled dra<strong>in</strong>age alignments, (4)<br />
elongated closed bas<strong>in</strong>s, and (5) hillside trenches or depressions<br />
(Anderson and Christenson, 1989).<br />
Cedar Valley to the west <strong>of</strong> the Hurricane Cliffs is characterized<br />
by geomorphic features typical <strong>of</strong> other closed<br />
bas<strong>in</strong>s <strong>in</strong> the Bas<strong>in</strong> and Range physiographic prov<strong>in</strong>ce. The<br />
bas<strong>in</strong> marg<strong>in</strong>s consist <strong>of</strong> broad alluvial-fan slopes that grade<br />
bas<strong>in</strong>ward <strong>in</strong>to slightly undulat<strong>in</strong>g pla<strong>in</strong>s, the lowest depressions<br />
<strong>of</strong> which conta<strong>in</strong> lakes, swamps, and dry alkali flats<br />
(Me<strong>in</strong>zer, 1911). A low divide, created by the alluvial fan<br />
deposited by Coal Creek, separates Cedar Valley <strong>in</strong>to two<br />
bas<strong>in</strong>s. The south bas<strong>in</strong> dra<strong>in</strong>s <strong>in</strong>to sal<strong>in</strong>e Quichapa Lake;<br />
the north bas<strong>in</strong> partly dra<strong>in</strong>s <strong>in</strong>to Rush Lake, and water from<br />
Coal Creek may also dra<strong>in</strong> to depressions farther south<br />
(Me<strong>in</strong>zer, 1911).<br />
GROUND-WATER CONDITIONS<br />
Introduction<br />
Ground water <strong>in</strong> the Cedar Valley area occurs <strong>in</strong> two<br />
types <strong>of</strong> aquifers: fractured bedrock and unconsolidated deposits.<br />
Bjorklund and others (1978) report that the Upper<br />
Cretaceous bedrock units yield water to spr<strong>in</strong>gs and a few<br />
wells, and Montgomery (1980) reports on the potential <strong>for</strong><br />
water exploration <strong>in</strong> the Navajo Sandstone, but fractured<br />
bedrock aquifers are relatively unused <strong>in</strong> the Cedar Valley<br />
area. Ground water <strong>in</strong> the Cedar Valley area is obta<strong>in</strong>ed pr<strong>in</strong>cipally<br />
from unconsolidated deposits <strong>of</strong> the bas<strong>in</strong>-fill aquifer<br />
(Thomas and Taylor, 1946; Sandberg, 1966; Bjorklund and<br />
others, 1978).<br />
Occurrence<br />
Bas<strong>in</strong>-Fill Aquifer<br />
Ground water <strong>in</strong> the Cedar Valley bas<strong>in</strong>-fill aquifer<br />
occurs under conf<strong>in</strong>ed, unconf<strong>in</strong>ed, and perched conditions<br />
<strong>in</strong> unconsolidated bas<strong>in</strong>-fill deposits (figure 5) (Bjorklund<br />
and others, 1978). Based on water-well data, the thickness <strong>of</strong><br />
Quaternary bas<strong>in</strong> fill is estimated to be at least 1,000 feet<br />
(300 m) (Thomas and Taylor, 1946; Anderson and Mehnert,<br />
1979), but a gravity survey <strong>in</strong>dicates bas<strong>in</strong> fill may be as<br />
much as 3,900 feet (1,200 m) thick <strong>in</strong> the eastern part <strong>of</strong> the<br />
complexly faulted Cedar Valley graben (Cook and Hardman,<br />
1967). The unconsolidated bas<strong>in</strong> fill consists primarily <strong>of</strong><br />
Quaternary alluvial sediments, composed <strong>of</strong> discont<strong>in</strong>uous,<br />
lenticular, commonly elongated, poorly to well-sorted bodies<br />
<strong>of</strong> sand, clay, gravel, and boulders (Thomas and Taylor,<br />
1946), <strong>in</strong>terbedded with lava flows and conta<strong>in</strong><strong>in</strong>g some<br />
lacustr<strong>in</strong>e and eolian deposits (Bjorklund and others, 1978).<br />
The bas<strong>in</strong>-fill aquifer is generally under unconf<strong>in</strong>ed conditions<br />
along the higher elevation marg<strong>in</strong>s <strong>of</strong> Cedar Valley<br />
where it typically consists <strong>of</strong> coarse, granular, permeable<br />
sediments (Bjorklund and others, 1978) deposited primarily<br />
<strong>in</strong> alluvial fans (Thomas and Taylor, 1946).<br />
The bas<strong>in</strong>-fill aquifer is generally under leaky conf<strong>in</strong>ed<br />
conditions <strong>in</strong> the central, lower elevation <strong>areas</strong> <strong>of</strong> the <strong>valley</strong><br />
(figure 5) (Sandberg, 1966; Bjorklund and others, 1978)<br />
where water yield<strong>in</strong>g coarser-gra<strong>in</strong>ed deposits are capped by<br />
or conta<strong>in</strong> <strong>in</strong>terven<strong>in</strong>g beds <strong>of</strong> low-permeability silt and clay<br />
(Bjorklund and others, 1978). The low-permeability sediments<br />
are extensive enough to locally <strong>for</strong>m effective conf<strong>in</strong><strong>in</strong>g<br />
beds or layers, but they are not cont<strong>in</strong>uous enough to<br />
<strong>for</strong>m major separations <strong>in</strong> the bas<strong>in</strong> fill where the groundwater<br />
system acts as a s<strong>in</strong>gle, complex aquifer (Thomas and<br />
Taylor, 1946). The boundary between conf<strong>in</strong>ed and unconf<strong>in</strong>ed<br />
conditions is <strong>in</strong>def<strong>in</strong>ite and gradational, and shifts as<br />
the potentiometric surface <strong>of</strong> the bas<strong>in</strong>-fill aquifer system<br />
rises and falls with changes <strong>in</strong> recharge and discharge (Bjorklund<br />
and others, 1978). Upward ground-water gradients <strong>in</strong><br />
the central, lower elevation <strong>areas</strong> <strong>of</strong> Cedar Valley were once<br />
sufficient to supply flow<strong>in</strong>g (artesian) wells that covered an<br />
approximate area <strong>of</strong> 50 square miles (130 km 2 ) <strong>in</strong> 1939<br />
(Thomas and Taylor, 1946, plate 18), <strong>in</strong>clud<strong>in</strong>g the Bauers<br />
Knoll and Mid Valley Estates subdivision <strong>areas</strong>, but no flow<strong>in</strong>g<br />
wells have existed <strong>in</strong> Cedar Valley s<strong>in</strong>ce 1975 (Bjorklund<br />
and others, 1978). Primary ground-water recharge <strong>areas</strong>,<br />
where the bas<strong>in</strong> fill is coarse and lacks thick f<strong>in</strong>e-gra<strong>in</strong>ed layers,<br />
occupy the marg<strong>in</strong>s <strong>of</strong> Cedar Valley. The central part <strong>of</strong><br />
the <strong>valley</strong> is a secondary ground-water recharge area, conta<strong>in</strong><strong>in</strong>g<br />
thick f<strong>in</strong>e-gra<strong>in</strong>ed layers, with an overall downward<br />
ground-water flow gradient (figure 5). Discharge <strong>areas</strong>,<br />
where ground-water flow has an upward gradient, are present<br />
near Quichapa Lake, Rush Lake, and <strong>in</strong> an area just west<br />
<strong>of</strong> the town <strong>of</strong> Enoch (Bjorklund and others, 1978). The discharge<br />
<strong>areas</strong> near Quichapa and Rush Lakes are manifested<br />
as ephemeral surface water.<br />
Aquifer Characteristics<br />
The alluvial deposits yield water at rates rang<strong>in</strong>g from 1<br />
to 4,000 gallons/m<strong>in</strong>ute (4-15,100 L/m<strong>in</strong>) (Bjorklund and<br />
others, 1978). The most productive aquifers consist <strong>of</strong> beds<br />
<strong>of</strong> coarse, clean, well-sorted gravel and sand that readily<br />
yield large quantities <strong>of</strong> water to wells (Bjorklund and others,<br />
1978). Sandberg (1966), based on data from 10 wells <strong>in</strong> the<br />
Cedar Valley bas<strong>in</strong>-fill aquifer, calculated a range <strong>for</strong> specific<br />
capacity <strong>of</strong> 10 to 50 gallons/m<strong>in</strong>ute per foot <strong>of</strong> drawdown<br />
(12-58 L/m<strong>in</strong> per m <strong>of</strong> drawdown) with an average <strong>of</strong> 28 gallons/m<strong>in</strong>ute<br />
per foot <strong>of</strong> drawdown (32 L/m<strong>in</strong> per m <strong>of</strong> draw-
Analysis <strong>of</strong> <strong>septic</strong>-<strong>tank</strong> <strong>density</strong>, Cedar Valley, Iron County, Utah<br />
9<br />
N<br />
Mud Spr<strong>in</strong>gs<br />
Wash<br />
Rush<br />
Lake<br />
Iron<br />
Spr<strong>in</strong>gs<br />
Gap<br />
Potentiometric surface<br />
<strong>of</strong> pr<strong>in</strong>cipal aquifer<br />
Primary Recharge<br />
Secondary Recharge<br />
Coal<br />
Creek<br />
CEDAR VALLEY<br />
15<br />
CEDAR<br />
CITY<br />
Hurricane Cliffs<br />
Parowan<br />
Valley<br />
Conf<strong>in</strong><strong>in</strong>g layers<br />
Unconsolidated deposits<br />
(Pr<strong>in</strong>cipal aquifer)<br />
Figure 5. Schematic block diagram show<strong>in</strong>g ground-water conditions <strong>in</strong> Cedar Valley, Iron County, Utah.<br />
down). Bjorklund and others (1978) compiled data from six<br />
multiple-well aquifer tests completed <strong>in</strong> gravelly aquifer<br />
material <strong>in</strong> Cedar Valley and calculated a range <strong>for</strong> average<br />
hydraulic conductivity values <strong>of</strong> 13 to 251 feet/day (4-77<br />
m/d), a transmissivity range <strong>of</strong> 2,540 to 52,000 square feet<br />
per day (230-4,830 m 2 /d), and a storage coefficient range <strong>of</strong><br />
0.0005 to 0.2.<br />
The Coal Creek alluvial fan, about 3 miles (5 km) north<br />
and northwest <strong>of</strong> Cedar City where the bas<strong>in</strong>-fill aquifer is<br />
under leaky conf<strong>in</strong>ed conditions, consists <strong>of</strong> coarse, wellsorted<br />
alluvium and has some <strong>of</strong> the highest transmissivities<br />
<strong>in</strong> Cedar Valley, estimated at about 20,000 square feet per<br />
day (2,000 m 2 /d) (Bjorklund and others, 1978). Transmissivities<br />
<strong>in</strong> the Coal Creek alluvial fan decrease northward and<br />
westward to about 5,000 square feet per day (460 m 2 /d) as<br />
the alluvial deposits become f<strong>in</strong>er gra<strong>in</strong>ed (Bjorklund and<br />
others, 1978). Near Enoch, Bjorklund and others (1978) estimated<br />
a transmissivity <strong>of</strong> 5,200 square feet per day (480<br />
m 2 /d) <strong>for</strong> an aquifer test on a well completed <strong>in</strong> the unconf<strong>in</strong>ed<br />
portion <strong>of</strong> the bas<strong>in</strong>-fill aquifer.<br />
Other <strong>areas</strong> with high transmissivities <strong>in</strong>clude the area<br />
just southwest <strong>of</strong> Quichapa Lake, where the bas<strong>in</strong> fill is<br />
derived from Tertiary volcanic rocks <strong>in</strong> the mounta<strong>in</strong>s on the<br />
southwest side <strong>of</strong> Cedar Valley, and <strong>areas</strong> near and northeast<br />
<strong>of</strong> Rush Lake, where the bas<strong>in</strong> fill conta<strong>in</strong>s permeable volcanic<br />
rock layers (Bjorklund and others, 1978). West <strong>of</strong><br />
Quichapa Lake, Bjorklund and others (1978) estimated a<br />
transmissivity <strong>of</strong> about 42,000 square feet per day (3,900<br />
m 2 /d) <strong>for</strong> an aquifer test on a well completed <strong>in</strong> the leaky<br />
conf<strong>in</strong>ed portion <strong>of</strong> the bas<strong>in</strong>-fill aquifer. Transmissivities <strong>in</strong><br />
the leaky conf<strong>in</strong>ed aquifer <strong>in</strong> the Rush lake area range from<br />
5,000 to 20,000 square feet per day (500-2,000 m 2 /d) (Bjorklund<br />
and others, 1978).<br />
Transmissivities are somewhat lower <strong>in</strong> southern Cedar<br />
Valley. Based on two aquifer tests and estimates from specific<br />
capacity data, Bjorklund and others (1978) calculated<br />
transmissivities rang<strong>in</strong>g from 2,000 to 10,000 square feet per<br />
day (200-900 m 2 /d) <strong>in</strong> the Hamiltons Fort/Kanarraville area.<br />
The f<strong>in</strong>er-gra<strong>in</strong>ed silt and clay layers store large quantities<br />
<strong>of</strong> water, but have low transmissivities and do not readily<br />
yield water to wells. Of the estimated 20 million acre-feet<br />
(25 km 3 ) <strong>of</strong> water stored <strong>in</strong> Cedar Valley’s bas<strong>in</strong>-fill aquifer<br />
system (Bjorklund and others, 1978), only 20 percent, or 4<br />
million acre-feet (4.9 km 3 ), are considered recoverable.<br />
Potentiometric Surface<br />
General: The potentiometric surface <strong>of</strong> ground water <strong>in</strong> the<br />
Cedar Valley bas<strong>in</strong>-fill aquifer is irregular and depends on<br />
the well depth, season, and year when water-level measurements<br />
are made (Thomas and Taylor, 1946). In unconf<strong>in</strong>ed<br />
parts <strong>of</strong> the aquifer, the potentiometric surface corresponds to<br />
the water table; <strong>in</strong> the conf<strong>in</strong>ed parts <strong>of</strong> the aquifer, the potentiometric<br />
surface represents the hydrostatic pressure, or head,<br />
a parameter controll<strong>in</strong>g the elevation to which water will rise<br />
<strong>in</strong> wells. The potentiometric surface <strong>in</strong>dicates horizontal ground-
10 Utah Geological Survey<br />
water flow direction, hydraulic gradient, and a predictable<br />
depth to water <strong>in</strong> wells <strong>in</strong> the unconf<strong>in</strong>ed portion <strong>of</strong> the<br />
aquifer.<br />
Ground-water flow direction: Ground-water flow is generally<br />
from the higher elevation recharge <strong>areas</strong> to lower elevation<br />
discharge <strong>areas</strong>. In southern Cedar Valley, ground<br />
water flows northward from the Kanarraville area, northeastward<br />
from the Harmony Mounta<strong>in</strong>s, southeastward from the<br />
Eightmile Hills and west-northwestward from the North<br />
Hills toward Quichapa Lake (Bjorklund and others, 1978,<br />
plate 5). Ground water <strong>in</strong> the vic<strong>in</strong>ity <strong>of</strong> the Coal Creek alluvial<br />
fan moves northward and northwestward from the apex<br />
<strong>of</strong> the fan and then either moves southward toward Quichapa<br />
Lake or westward toward Iron Spr<strong>in</strong>gs Gap (Thomas and<br />
Taylor, 1946). Ground water <strong>in</strong> northern Cedar Valley generally<br />
moves northwestward toward Rush Lake and then cont<strong>in</strong>ues<br />
toward Mud Spr<strong>in</strong>gs Wash (Bjorklund and others,<br />
1978). Hydraulic gradients are generally flat <strong>in</strong> the central,<br />
lower elevation <strong>areas</strong> <strong>of</strong> Cedar Valley, such as near Quichapa<br />
Lake. Hydraulic gradients are estimated to be about 25<br />
feet/mile (5 m/km) at Iron Spr<strong>in</strong>gs Gap and 50 feet/mile (9<br />
m/km) at Mud Spr<strong>in</strong>gs Wash (Sandberg, 1966).<br />
Water levels <strong>in</strong> wells: Depth to ground water <strong>in</strong> wells<br />
ranges from near the ground surface <strong>in</strong> the central portion <strong>of</strong><br />
the <strong>valley</strong> to about 250 feet (76 m) below the surface along<br />
the <strong>valley</strong> marg<strong>in</strong>s (Bjorklund and others, 1978). Most wells<br />
record static-water levels less than 100 feet (30 m) below the<br />
land surface. Depths to ground water <strong>in</strong> wells <strong>in</strong> the Coal<br />
Creek alluvial-fan area range from about 200 feet (60 m)<br />
near Cedar City to about 10 feet (3 m) <strong>in</strong> the distal portions<br />
<strong>of</strong> the fan (Bjorklund and others, 1978). Depths to ground<br />
water range from about 150 feet (46 m) along the mounta<strong>in</strong><br />
front to about 10 feet (3 m) <strong>in</strong> the lower portions <strong>of</strong> the <strong>valley</strong><br />
<strong>in</strong> the Hamiltons Fort/Kanarraville area, from about 10<br />
feet (3 m) near Quichapa Lake to about 100 feet (30 m) along<br />
the mounta<strong>in</strong> front to the southwest, and from about 10 feet<br />
(3 m) near Rush Lake to about 50 feet (15 m) a few miles<br />
northeast <strong>of</strong> Rush Lake (Bjorklund and others, 1978).<br />
Changes <strong>in</strong> water levels: The level at which water stands <strong>in</strong><br />
wells <strong>in</strong> the Cedar Valley bas<strong>in</strong>-fill aquifer varies <strong>in</strong> response<br />
to changes <strong>in</strong> the hydrostatic pressure <strong>of</strong> the ground water,<br />
which varies due to changes <strong>in</strong> the amount <strong>of</strong> water (1) withdrawn<br />
from pump<strong>in</strong>g wells, (2) discharg<strong>in</strong>g by evapotranspiration,<br />
and (3) <strong>in</strong>filtrat<strong>in</strong>g and recharg<strong>in</strong>g the system from<br />
ra<strong>in</strong>fall, irrigated lands, stream channels, and irrigation ditches<br />
(Thomas and Taylor, 1946). The changes <strong>in</strong> hydrostatic<br />
pressure can be either seasonal or long term.<br />
The withdrawal <strong>of</strong> large amounts <strong>of</strong> ground water dur<strong>in</strong>g<br />
the irrigation season causes seasonal changes <strong>in</strong> water levels<br />
(Sandberg, 1966), as does seasonal variation <strong>in</strong> precipitation<br />
and streamflow (Thomas and Taylor, 1946). There is a general<br />
pattern <strong>of</strong> decl<strong>in</strong><strong>in</strong>g water levels dur<strong>in</strong>g the irrigation<br />
season, typically from May through September, and ris<strong>in</strong>g<br />
water levels from October through May (Bjorklund and others,<br />
1978). Seasonal changes <strong>in</strong> ground-water levels exceed<strong>in</strong>g<br />
30 feet (9 m) were observed <strong>in</strong> 1974 <strong>in</strong> the center <strong>of</strong> the<br />
<strong>valley</strong> northwest <strong>of</strong> Cedar City, but water levels decl<strong>in</strong>ed less<br />
than 5 feet <strong>in</strong> most <strong>areas</strong> along the western side <strong>of</strong> the <strong>valley</strong><br />
dur<strong>in</strong>g the same year (Bjorklund and others, 1978, figure 6).<br />
Long-term changes <strong>in</strong> water level depend on annual<br />
average precipitation and evapotranspiration, and on average<br />
annual well pumpage. Between 1940 and 1974, the amount<br />
<strong>of</strong> ground-water discharge from wells, spr<strong>in</strong>gs, and evapotranspiration<br />
exceeded recharge to the ground-water system<br />
which resulted <strong>in</strong> an overall decl<strong>in</strong>e <strong>in</strong> ground-water levels <strong>in</strong><br />
the bas<strong>in</strong>-fill aquifer. Due to concerns caused by decl<strong>in</strong><strong>in</strong>g<br />
water levels, the Utah State Eng<strong>in</strong>eer closed Cedar Valley’s<br />
entire sub-bas<strong>in</strong> to new appropriations <strong>of</strong> water rights <strong>in</strong><br />
1966; portions <strong>of</strong> Cedar Valley had already been closed to<br />
new appropriations s<strong>in</strong>ce the 1940s (Utah Division <strong>of</strong> Water<br />
Resources, 1995). Average annual ground-water levels had<br />
decl<strong>in</strong>ed as much as 30 feet (9 m) <strong>in</strong> some <strong>areas</strong> <strong>of</strong> Cedar Valley<br />
between 1940 and 1974, which was attributed primarily<br />
to withdrawal by wells (Bjorklund and others, 1978, figure<br />
11). Between 1963 and 1993, water-level decl<strong>in</strong>es greater<br />
than 10 feet (3 m) were limited to the area west <strong>of</strong> Quichapa<br />
Lake (Barnett and Mayo, 1966), <strong>in</strong>dicat<strong>in</strong>g long-term<br />
recharge and discharge are relatively <strong>in</strong> balance (Utah Division<br />
<strong>of</strong> Water Resources, 1995).<br />
Recharge<br />
Most recharge to the bas<strong>in</strong>-fill aquifer comes directly or<br />
<strong>in</strong>directly from precipitation with<strong>in</strong> the Cedar Valley<br />
dra<strong>in</strong>age bas<strong>in</strong> (Sandberg, 1966). However, <strong>of</strong> the average<br />
452,000 acre-feet (557 hm 3 ) <strong>of</strong> average annual precipitation<br />
that falls with<strong>in</strong> the dra<strong>in</strong>age bas<strong>in</strong>, recharge to the bas<strong>in</strong>-fill<br />
aquifer is estimated to be only about 40,000 acre-feet/year<br />
(49 hm 3 /yr) as most <strong>of</strong> the precipitation is consumed by<br />
evapotranspiration be<strong>for</strong>e enter<strong>in</strong>g the aquifer system<br />
(Bjorklund and others, 1978). Negligible recharge to the<br />
bas<strong>in</strong>-fill aquifer likely comes from direct precipitation on<br />
the <strong>valley</strong> floor, and is related to soil-moisture deficiencies <strong>in</strong><br />
the unsaturated zone. Uptake by plants/phreatophytes typically<br />
utilizes the available amount <strong>of</strong> moisture from precipitation<br />
at the surface provid<strong>in</strong>g only a m<strong>in</strong>or, if any, amount to<br />
percolate below the root zone to the zone <strong>of</strong> saturation<br />
(Thomas and Taylor, 1946).<br />
Streams are the ma<strong>in</strong> source <strong>of</strong> recharge to the bas<strong>in</strong>-fill<br />
aquifer, with the majority occurr<strong>in</strong>g <strong>in</strong> the upper portions <strong>of</strong><br />
the highly permeable alluvial-fan deposits along the marg<strong>in</strong>s<br />
<strong>of</strong> the <strong>valley</strong> (Bjorklund and others, 1978). Although many<br />
smaller dra<strong>in</strong>ages enter<strong>in</strong>g Cedar Valley likely contribute<br />
some <strong>in</strong>termittent recharge, especially after snowmelt or dur<strong>in</strong>g<br />
major precipitation events, Coal Creek supplies the greatest<br />
amount <strong>of</strong> recharge <strong>in</strong> Cedar Valley (Thomas and Taylor,<br />
1946). Bjorklund and others (1978) identified ground-water<br />
mounds with water-table slopes radiat<strong>in</strong>g away from the fan<br />
axes under several alluvial fans. Urbanization and the<br />
accompany<strong>in</strong>g <strong>in</strong>troduction <strong>of</strong> impermeable materials (<strong>for</strong><br />
example, pavement) may result <strong>in</strong> less recharge along alluvial<br />
fans, eventually alter<strong>in</strong>g flows <strong>in</strong> dra<strong>in</strong>ages and re-channel<strong>in</strong>g<br />
water courses toward the <strong>valley</strong> where less favorable<br />
recharge <strong>areas</strong> exist (Utah Division <strong>of</strong> Water Resources,<br />
1995).<br />
Excess irrigation water, either diverted from streams or<br />
pumped from wells, is also an important source <strong>of</strong> recharge<br />
to the bas<strong>in</strong>-fill aquifer, especially along the <strong>valley</strong> marg<strong>in</strong>s<br />
where unconsolidated deposits are most permeable (Thomas<br />
and Taylor, 1946). Most <strong>of</strong> the average annual flow <strong>of</strong> Coal<br />
Creek, about 24,000 acre-feet/year (30 hm 3 /yr) is diverted<br />
<strong>for</strong> irrigation (Bjorklund and others, 1978).<br />
Subsurface <strong>in</strong>flow from Parowan Bas<strong>in</strong> <strong>in</strong> the north and
Analysis <strong>of</strong> <strong>septic</strong>-<strong>tank</strong> <strong>density</strong>, Cedar Valley, Iron County, Utah<br />
the surround<strong>in</strong>g adjacent mounta<strong>in</strong> blocks may contribute a<br />
relatively small amount <strong>of</strong> recharge to the bas<strong>in</strong>-fill aquifer<br />
<strong>in</strong> Cedar Valley. Subsurface <strong>in</strong>flow from consolidated rock<br />
is likely greatest at the contacts between the bas<strong>in</strong> fill and the<br />
Tertiary Wasatch Formation, Tertiary and Quaternary volcanic<br />
rocks, and the Jurassic Navajo Sandstone (Bjorklund<br />
and others, 1978).<br />
Discharge<br />
Ground water is discharged from the bas<strong>in</strong>-fill aquifer by<br />
spr<strong>in</strong>gs and seeps, evapotranspiration, wells, and subsurface<br />
outflow from the area (Sandberg, 1966). The average annual<br />
discharge <strong>in</strong> Cedar Valley is about 44,000 acre-ft (54 hm 3 )<br />
(Bjorklund and others, 1978).<br />
Spr<strong>in</strong>gs and seeps <strong>in</strong> Cedar Valley issue from <strong>three</strong> ma<strong>in</strong><br />
<strong>areas</strong>: (1) the Enoch/Rush Lake area near the contact<br />
between consolidated rock and unconsolidated deposits, (2)<br />
the area west <strong>of</strong> Rush Lake, and (3) the area near Quichapa<br />
Lake (Sandberg, 1966). However, spr<strong>in</strong>gs and seeps account<br />
<strong>for</strong> only m<strong>in</strong>or discharge <strong>in</strong> the bas<strong>in</strong>-fill aquifer (Bjorklund<br />
and others, 1978). Thomas and Taylor (1946) estimated a<br />
total average annual natural discharge with<strong>in</strong> Cedar Valley <strong>of</strong><br />
about 4,700 acre-feet/year (6 hm 3 /yr), but many <strong>of</strong> the<br />
spr<strong>in</strong>gs and seeps that emanated <strong>in</strong> the Rush Lake and Enoch<br />
area <strong>in</strong> 1940 were dry by 1974 (Bjorklund and others, 1978).<br />
Evapotranspiration represents about 3,600 acre-feet/year<br />
(4.4 hm 3 /yr) <strong>of</strong> annual average discharge: about 2,000 acrefeet/year<br />
(2.5 hm 3 /yr) by evapotranspiration by phreatophytes<br />
<strong>in</strong> Cedar Valley and by evaporation from the playas at<br />
Rush and Quichapa Lakes, and about 1,600 acre-feet/year (2<br />
hm 3 /yr) from <strong>areas</strong> where the potentiometric surface <strong>of</strong> the<br />
bas<strong>in</strong>-fill aquifer is with<strong>in</strong> 10 feet (3 m) <strong>of</strong> the ground surface<br />
(Bjorklund and others, 1978). Although estimated dur<strong>in</strong>g the<br />
1970s, the numbers likely reflect the current evapotranspiration<br />
rates (Utah Division <strong>of</strong> Water Resources, 1995).<br />
Subsurface outflow from Cedar Valley is possible at<br />
<strong>three</strong> locations: Iron Spr<strong>in</strong>gs Gap, Mud Spr<strong>in</strong>gs Wash, and<br />
Kanarraville Creek Valley (Thomas and Taylor, 1946).<br />
Bjorklund and others (1978) estimated an average annual<br />
subsurface discharge from Cedar Valley <strong>of</strong> about 500 acrefeet/year<br />
(0.6 hm 3 /yr) at Iron Spr<strong>in</strong>gs Gap and 20 acrefeet/year<br />
(0.025 hm 3 /yr) at Mud Spr<strong>in</strong>gs Wash; they estimated<br />
subsurface discharge to Kanarraville Creek Valley as negligible.<br />
Withdrawal from wells currently represents the greatest<br />
amount <strong>of</strong> ground-water discharge from the bas<strong>in</strong>-fill aquifer<br />
(Utah Division <strong>of</strong> Water Resources, 1997). In 1975, almost<br />
43,000 acre-feet (53 hm 3 ) <strong>of</strong> ground water was pumped <strong>for</strong><br />
irrigation, municipal supply, domestic, and stock use (Bjorklund<br />
and others, 1978). By 1993, the annual pumpage had<br />
decreased to about 35,000 acre-feet (43 hm 3 ) (Utah Division<br />
<strong>of</strong> Water Resources, 1997). Annual pumpage varies considerably<br />
depend<strong>in</strong>g on cumulative departure from average<br />
annual precipitation and is considerably higher dur<strong>in</strong>g<br />
drought years (Thomas and Taylor, 1946).<br />
Water Quality<br />
Ground-water quality <strong>in</strong> Cedar Valley is generally good<br />
and, although classified as hard, is suitable <strong>for</strong> most uses<br />
(Utah Division <strong>of</strong> Water Resources, 1995). Ground water <strong>in</strong><br />
the bas<strong>in</strong>-fill aquifer is generally classified as calcium- or<br />
magnesium-sulfate type. Sodium-chloride-type ground<br />
water is present near Rush Lake and calcium-bicarbonatetype<br />
ground water is present southwest <strong>of</strong> Quichapa Lake<br />
(Bjorklund and others, 1978). Thomas and Taylor (1946)<br />
reported total-dissolved-solids concentrations rang<strong>in</strong>g from<br />
about 150 mg/L, just west <strong>of</strong> Quichapa Lake, to more than<br />
1,700 mg/L <strong>for</strong> certa<strong>in</strong> wells on the Coal Creek alluvial fan.<br />
Bjorklund and others (1978, table 5) reported total-dissolved-solids<br />
concentrations <strong>in</strong> ground water rang<strong>in</strong>g from<br />
166 to 2,752 mg/L. Sandberg (1966) reported total-dissolved-solids<br />
concentrations <strong>in</strong> ground water rang<strong>in</strong>g from<br />
281 to 3,750 mg/L.<br />
The type <strong>of</strong> water and quantity <strong>of</strong> dissolved solids is<br />
largely <strong>in</strong>fluenced by local geology. Ground water with high<br />
total-dissolved-solids concentrations and high calcium and<br />
sulfate concentrations exists <strong>in</strong> the Coal Creek and Fiddlers<br />
Canyon alluvial-fan <strong>areas</strong> because Mesozoic-age rocks <strong>in</strong> the<br />
dra<strong>in</strong>age bas<strong>in</strong> conta<strong>in</strong> abundant gypsum (Thomas and Taylor,<br />
1946). Ground water with high total-dissolved-solids<br />
concentrations and high sodium and chloride concentrations<br />
exists near the playa <strong>areas</strong> <strong>of</strong> Rush and Quichapa Lakes<br />
(Bjorklund and others, 1978). Ground water <strong>in</strong> the area<br />
recharged by Quichapa Creek has low total-dissolved-solids<br />
concentrations and is the s<strong>of</strong>test water <strong>in</strong> the bas<strong>in</strong>-fill<br />
aquifer, because its dra<strong>in</strong>age bas<strong>in</strong> is underla<strong>in</strong> almost exclusively<br />
by Tertiary volcanic rocks which conta<strong>in</strong> few soluble<br />
m<strong>in</strong>erals.<br />
In addition to calcium, sulfate, and chloride, another<br />
chemical constituent, nitrate, typically associated with<br />
human activities, has been identified <strong>in</strong> Cedar Valley. Nitrate<br />
concentrations <strong>in</strong> ground water have been analyzed and<br />
reported <strong>in</strong> two different ways <strong>in</strong> the literature <strong>for</strong> Cedar Valley:<br />
nitrate as nitrogen and nitrate as nitrate. The values <strong>for</strong><br />
nitrate as nitrate are much higher than the correspond<strong>in</strong>g values<br />
<strong>for</strong> nitrate as nitrogen. The Utah ground-water-quality<br />
(health) standard <strong>for</strong> nitrate as nitrogen is 10 mg/L, and 45<br />
mg/L as <strong>for</strong> nitrate as nitrate.<br />
Thomas and Taylor (1946, p. 107) reported nitrate-asnitrate<br />
concentrations rang<strong>in</strong>g from 0.0 to 260 mg/L <strong>for</strong> wells<br />
<strong>in</strong> Cedar Valley (table 1); they noted that the highest nitrate<br />
concentration <strong>in</strong> ground water was found <strong>in</strong> the Fiddlers<br />
Canyon alluvial-fan area, and that this high-nitrate ground<br />
water also conta<strong>in</strong>ed high chloride and sulfate concentrations.<br />
Some <strong>of</strong> the wells <strong>in</strong> the Coal Creek alluvial-fan area<br />
were also high <strong>in</strong> nitrate and sulfate, but not high <strong>in</strong> chloride<br />
concentrations (Thomas and Taylor, 1946, p. 107). Sandberg<br />
(1966) reported nitrate-as-nitrate concentrations <strong>in</strong> Cedar<br />
Valley rang<strong>in</strong>g from 1.0 to 109 mg/L (table 2). Bjorklund<br />
and others (1978) reported nitrate-as-nitrogen concentrations<br />
<strong>in</strong> Cedar Valley rang<strong>in</strong>g from 0.0 to 14 mg/L (table 3).<br />
Thomas and Taylor (1946) noted that nitrate concentrations<br />
over a few mg/L <strong>in</strong> shallow ground water is considered<br />
an <strong>in</strong>dication <strong>of</strong> water-quality degradation typically associated<br />
with human-related activities. However, they noted<br />
(Thomas and Taylor, 1946, p. 110) that depths <strong>for</strong> most <strong>of</strong> the<br />
wells hav<strong>in</strong>g high nitrate concentration <strong>in</strong> Cedar Valley<br />
exceed 100 feet (30 m), suggest<strong>in</strong>g a geologic source <strong>of</strong><br />
nitrate possibly associated with soluble salts <strong>in</strong> the <strong>valley</strong> fill<br />
rather than an anthropogenic orig<strong>in</strong>.<br />
11
12 Utah Geological Survey<br />
Table 1. Nitrate concentration <strong>in</strong> ground water <strong>for</strong> water wells <strong>in</strong> Cedar Valley, Iron County, Utah (data from Thomas and Taylor, 1946).<br />
Well location Well depth (feet) Nitrate (as NO 3 ) ppm<br />
(C-34-11)36adc 200 2.8<br />
(C-35-10)7cad 101 0.9<br />
(C-35-11)1acc 150 4.2<br />
(C-35-11)1ccd 156 2.5<br />
(C-35-11)12ddd 250 2.7<br />
(C-35-11)14ddd 158 125<br />
(C-35-11)23bdc 100 260<br />
(C-35-11)26bbb 140 144<br />
(C-35-11)21dcc 180 10<br />
(C-35-11)22dcc 61 17<br />
(C-35-11)27aca 108 56<br />
(C-35-11)27acc 113 13<br />
(C-35-11)27adc 148 44<br />
(C-35-11)32aca 175 11<br />
(C-35-11)33aac 138 16<br />
(C-35-11)19bda 175 0.0<br />
(C-35-11)29abd 100 4.7<br />
(C-36-11)5baa 132 10<br />
(C-36-11)8aab 103 58<br />
(C-36-11)8cab 200 18<br />
(C-36-11)8cbb 60 21<br />
(C-36-11)10bcc 195 8.5<br />
(C-36-11)18ada 230 29<br />
(C-36-11)7baa 167 12<br />
(C-36-12)1aaa 366 0.5<br />
(C-36-12)10ada 389 1.0<br />
(C-36-12)9aaa 257 0.8<br />
(C-36-12)12dac 200 0.8<br />
(C-34-11)36cbc 60 0.0<br />
(C-35-11)2ddd 40 0.0<br />
(C-35-11)8ddd 178 0.9<br />
(C-35-11)9add 151 1.3<br />
(C-35-11)10dbd 90 22<br />
(C-35-11)15dba 84 49<br />
(C-35-11)16dba 104 13<br />
(C-35-11)17dad 270 8<br />
(C-33-11)29ccb 72 1.0<br />
(C-33-11)30bca 60 0.0<br />
(C-34-11)13bab 200+ 1.2<br />
Table 2. Nitrate concentration <strong>in</strong> ground water <strong>for</strong> water wells <strong>in</strong> Cedar Valley, Iron County, Utah (data from Sandberg, 1966).<br />
Well location<br />
Nitrate (as NO 3 ) ppm<br />
(C-33-10)29adc 109<br />
(C-33-12)11aaa 1.3<br />
(C-34-11)36cdd 1.8<br />
(C-35-11)13dda 20<br />
(C-35-11)33aac 1.1<br />
(C-35-12)34dcd 2.9<br />
(C-36-11)18ada 27<br />
(C-36-11)18bdc 6<br />
(C-36-12)12dba 7.8<br />
(C-36-12)20acc 2.4<br />
(C-36-12)33bdc 0.8<br />
(C-37-12)11aab 3.0<br />
(C-37-12)23acb 1.0<br />
(C-37-12)23bbd 66<br />
(C-37-12)34abb 15
Analysis <strong>of</strong> <strong>septic</strong>-<strong>tank</strong> <strong>density</strong>, Cedar Valley, Iron County, Utah<br />
13<br />
Table 3. Nitrate concentration <strong>in</strong> ground water <strong>for</strong> water wells <strong>in</strong> Cedar Valley, Iron County, Utah (data from Bjorklund and others, 1978).<br />
Well location Well depth (feet) Nitrate (as N) ppm<br />
(C-33-11)30bca 80 0.3<br />
(C-34-10)31caa 365 2.6<br />
(C-34-11)1daa 120 1.2<br />
(C-34-11)9ccd 130 0.22<br />
(C-34-11)23bdd 302 1.1<br />
(C-34-12)36abb — 0.35<br />
(C-35-10)18cca 285 0.99<br />
(C-35-11)26acd 700 14.0<br />
(C-35-11)33aac 236 4.0<br />
(C-35-12)20abc — 0.5<br />
(C-35-12)27bcd 255 0.26<br />
(C-36-10)18bcd 147 0.69<br />
(C-36-11)11bac 670 8.4<br />
(C-36-12)32ccb 697 0.0<br />
(C-37-12)11aaa 365 0.9<br />
GROUND-WATER CONTAMINATION FROM<br />
SEPTIC-TANK SYSTEMS<br />
Pathogens<br />
As the effluent from a <strong>septic</strong> <strong>tank</strong> soil-absorption system<br />
leaves the dra<strong>in</strong> field and percolates <strong>in</strong>to the underly<strong>in</strong>g soil,<br />
it can have high concentrations <strong>of</strong> pathogens, such as viruses<br />
and bacteria. Organisms such as bacteria can be mechanically<br />
filtered by f<strong>in</strong>e-gra<strong>in</strong>ed soils and are typically removed<br />
after travel<strong>in</strong>g a relatively short distance <strong>in</strong> the unsaturated<br />
zone. However, <strong>in</strong> coarse-gra<strong>in</strong>ed soils, or soils conta<strong>in</strong><strong>in</strong>g<br />
preferential flow paths like cracks, worm burrows, or root<br />
holes, these pathogens can reach the water table. Pathogens<br />
can travel up to 40 feet (12 m) <strong>in</strong> the unsaturated zone <strong>in</strong><br />
some soils (Franks, 1972). Some viruses can survive up to<br />
250 days (U.S. Env<strong>iron</strong>mental Protection Agency, 1987),<br />
which is the m<strong>in</strong>imum ground-water time <strong>of</strong> travel <strong>for</strong> public<br />
water-supply wells or spr<strong>in</strong>gs to be separated from potential<br />
biological contam<strong>in</strong>ation sources.<br />
Household and Industrial Chemicals<br />
Many household and <strong>in</strong>dustrial chemicals (table 4) are<br />
commonly disposed <strong>of</strong> through <strong>septic</strong> systems and, unless<br />
they volatilize easily, are not removed by percolation through<br />
soils <strong>in</strong> the unsaturated zone. Contam<strong>in</strong>ation from these<br />
chemicals can be m<strong>in</strong>imized by reduc<strong>in</strong>g their disposal via<br />
<strong>septic</strong>-<strong>tank</strong> systems, maximiz<strong>in</strong>g the potential <strong>for</strong> dilution <strong>of</strong><br />
those chemicals that do reach ground water (Lowe and Wallace,<br />
1999b).<br />
Phosphate<br />
Phosphate, typically derived from organic material or<br />
some detergents, is discharged from <strong>septic</strong>-<strong>tank</strong> systems<br />
(Fetter, 1980). While phosphate (and phosphorus) is a major<br />
factor <strong>in</strong> caus<strong>in</strong>g eutrophication <strong>of</strong> surface waters (Fetter,<br />
1980), it is generally not associated with water-quality degradation<br />
due to the use <strong>of</strong> <strong>septic</strong>-<strong>tank</strong> systems (Lowe and Wallace,<br />
1999b). Phosphates are removed from <strong>septic</strong>-<strong>tank</strong> system<br />
effluent by absorption onto f<strong>in</strong>e-gra<strong>in</strong>ed soil particles<br />
and by precipitation with calcium and <strong>iron</strong> (Fetter, 1980). In<br />
most soils, complete removal <strong>of</strong> phosphate is common<br />
(Franks, 1972).<br />
Nitrate<br />
Ammonia and organic nitrogen are commonly present <strong>in</strong><br />
effluent from <strong>septic</strong>-<strong>tank</strong> systems (table 4), mostly from the<br />
human ur<strong>in</strong>ary system. Typically, almost all ammonia is converted<br />
<strong>in</strong>to nitrate be<strong>for</strong>e leav<strong>in</strong>g the <strong>septic</strong> <strong>tank</strong> soil-absorption<br />
system dra<strong>in</strong> field. Once nitrate passes below the zone<br />
<strong>of</strong> aerobic bacteria and the roots <strong>of</strong> plants, there is negligible<br />
attenuation as it travels farther through the soil (Franks,<br />
1972). Once <strong>in</strong> ground water, nitrate becomes mobile and<br />
can persist <strong>in</strong> the env<strong>iron</strong>ment <strong>for</strong> long periods <strong>of</strong> time.<br />
Areas hav<strong>in</strong>g high densities <strong>of</strong> <strong>septic</strong>-<strong>tank</strong> systems risk elevated<br />
nitrate concentrations reach<strong>in</strong>g unacceptable levels. In<br />
the early phases <strong>of</strong> ground-water-quality degradation associated<br />
with <strong>septic</strong>-<strong>tank</strong> systems, nitrate is likely to be the only<br />
pollutant detected (Deese, 1986). Regional nitrate contam<strong>in</strong>ation<br />
from <strong>septic</strong>-<strong>tank</strong> discharge has been documented on<br />
Long Island, New York, where many densely populated <strong>areas</strong><br />
without sewer systems exist (Fetter, 1980).<br />
A typical s<strong>in</strong>gle-family <strong>septic</strong>-<strong>tank</strong> system discharges<br />
about 400 gallons (1,500 L) <strong>of</strong> effluent per day conta<strong>in</strong><strong>in</strong>g<br />
nitrate concentrations rang<strong>in</strong>g from 30 to 80 mg/L (Hansen,<br />
Allen, and Luce, Inc., 1994). The U.S. Env<strong>iron</strong>mental Protection<br />
Agency maximum contam<strong>in</strong>ant level <strong>for</strong> dr<strong>in</strong>k<strong>in</strong>g<br />
water (Utah ground-water-quality standard) <strong>for</strong> nitrate is 10<br />
mg/L. There<strong>for</strong>e, distances between <strong>septic</strong> <strong>tank</strong> soil-absorption<br />
system dra<strong>in</strong> fields and sources <strong>of</strong> cul<strong>in</strong>ary water must<br />
be sufficient <strong>for</strong> dilution <strong>of</strong> nitrate <strong>in</strong> the effluent to levels<br />
below the standard <strong>for</strong> ground-water quality.<br />
We consider nitrate to be the key contam<strong>in</strong>ant <strong>for</strong> use <strong>in</strong><br />
determ<strong>in</strong><strong>in</strong>g the number or <strong>density</strong> <strong>of</strong> <strong>septic</strong>-<strong>tank</strong> systems<br />
that should be allowed <strong>in</strong> Cedar Valley. Projected nitrate<br />
concentrations <strong>in</strong> all or parts <strong>of</strong> aquifers can be estimated <strong>for</strong><br />
<strong>in</strong>creas<strong>in</strong>g <strong>septic</strong>-<strong>tank</strong>-system densities us<strong>in</strong>g a mass-balance<br />
approach.
14 Utah Geological Survey<br />
Table 4. Typical characteristics <strong>of</strong> wastewater from <strong>septic</strong>-<strong>tank</strong> systems (from Hansen, Allen, and Luce, Inc., 1994).<br />
Parameter Units Quantity<br />
Total Solids mg/L 680 - 1000<br />
Volatile Solids mg/L 380 - 500<br />
Suspended Solids mg/L 200 - 290<br />
Volatile Suspended Solids mg/L 150 - 240<br />
BOD (Biological Oxygen Demand) mg/L 200 - 290<br />
Chemical Oxygen Demand mg/L 680 - 730<br />
Total Nitrogen mg/L 35 - 170<br />
Ammonia mg/L 6 - 160<br />
Nitrites and Nitrates mg/L
Analysis <strong>of</strong> <strong>septic</strong>-<strong>tank</strong> <strong>density</strong>, Cedar Valley, Iron County, Utah<br />
mass-balance approach and elaborate on several <strong>of</strong> the limitations<br />
<strong>in</strong> a subsequent discussion section.<br />
1. Calculations are typically based on a short-term<br />
hydrologic budget, s<strong>in</strong>gle aquifer test, and limited<br />
water-gradient data.<br />
2. Background nitrate concentration is attributed to<br />
natural sources, agricultural practices, and use<br />
<strong>of</strong> <strong>septic</strong>-<strong>tank</strong> systems, but projected nitrate<br />
concentrations are based on <strong>septic</strong>-<strong>tank</strong> systems<br />
only and do not <strong>in</strong>clude nitrate from other<br />
potential sources (such as lawn and garden fertilizer).<br />
3. Calculations do not account <strong>for</strong> localized, highconcentration<br />
nitrate plumes associated with<br />
<strong>in</strong>dividual or clustered <strong>septic</strong>-<strong>tank</strong> systems, and<br />
also assumes that the <strong>septic</strong> <strong>tank</strong> effluent from<br />
exist<strong>in</strong>g homes is <strong>in</strong> a steady-state condition<br />
with the aquifer.<br />
4. The approach assumes negligible denitrification.<br />
5. The approach assumes uni<strong>for</strong>m, <strong>in</strong>stantaneous<br />
ground-water mix<strong>in</strong>g <strong>for</strong> the entire aquifer or<br />
entire mix<strong>in</strong>g zone below the site.<br />
6. Calculations do not account <strong>for</strong> changes <strong>in</strong><br />
ground-water conditions due to ground water<br />
withdrawal from wells (see ground-water discharge<br />
section above).<br />
7. Calculations are based on aquifer parameters<br />
that must be extrapolated to larger <strong>areas</strong> where<br />
they may not be entirely representative.<br />
8. Calculations may be based on exist<strong>in</strong>g data that<br />
don’t represent the entire <strong>valley</strong>.<br />
Although there are many caveats to apply<strong>in</strong>g this massbalance<br />
approach, we th<strong>in</strong>k it is useful <strong>in</strong> land-use plann<strong>in</strong>g<br />
because it provides a general basis <strong>for</strong> mak<strong>in</strong>g recommendations<br />
<strong>for</strong> <strong>septic</strong>-<strong>tank</strong>-system densities. In addition, the<br />
approach is cost-effective and easily applied with limited<br />
<strong>in</strong><strong>for</strong>mation.<br />
VALLEY-WIDE SEPTIC-SYSTEM DENSITY<br />
EVALUATION<br />
Wallace and Lowe (1998a, 1999) applied a mass-balance<br />
equation to all <strong>of</strong> Cedar Valley us<strong>in</strong>g published reports conta<strong>in</strong><strong>in</strong>g<br />
ground-water budgets and ground-water-quality data<br />
to help with overall, gross, <strong>valley</strong>-wide plann<strong>in</strong>g. Figure 6<br />
shows a plot <strong>of</strong> projected nitrate concentration <strong>in</strong> Cedar Valley’s<br />
aquifer versus <strong>septic</strong>-<strong>tank</strong> <strong>density</strong> and number <strong>of</strong> <strong>septic</strong><strong>tank</strong><br />
systems. Background nitrate concentration <strong>for</strong> Cedar<br />
Valley, based on limited data, is 5.5 mg/L (Conner and others,<br />
1958; Joe Mell<strong>in</strong>g, Cedar City Manager, unpublished<br />
data, 1977-79; Quilter, 1996). Approximately 1,406 <strong>septic</strong><strong>tank</strong><br />
systems exist <strong>in</strong> Cedar Valley (Joe Mell<strong>in</strong>g, verbal communication,<br />
July 29, 1997). Cedar Valley has an area <strong>of</strong><br />
approximately 108,800 acres (440 km 2 ), so the average <strong>septic</strong>-<strong>tank</strong>-system<br />
<strong>density</strong> is about 77 acres/system (109<br />
km 2 /system). Based on Bjorklund and others’ (1978, p. 17)<br />
estimated hydrologic budget, ground-water flow available<br />
<strong>for</strong> mix<strong>in</strong>g <strong>in</strong> Cedar Valley is 52.5 cubic feet per second (1.49<br />
m 3 /s). For Cedar Valley to ma<strong>in</strong>ta<strong>in</strong> an overall nitrate concentration<br />
<strong>of</strong> 6.5 mg/L (which allows 1 mg/L <strong>of</strong> degradation,<br />
a level <strong>of</strong> degradation determ<strong>in</strong>ed to be acceptable <strong>in</strong><br />
15<br />
Aquifer nitrate concentrations (mg/L)<br />
13<br />
12.5<br />
12<br />
11.5<br />
11<br />
10.5<br />
10<br />
9.5<br />
9<br />
8.5<br />
8<br />
7.5<br />
7<br />
6.5<br />
6<br />
5.5<br />
5<br />
4.5<br />
4<br />
3.5<br />
3<br />
2.5<br />
2<br />
1.5<br />
1<br />
0.5<br />
0<br />
Cedar Valley<br />
Septic-<strong>tank</strong> <strong>density</strong> (acres/system)<br />
77 27<br />
background = 5.5 mg/L<br />
best estimate<br />
1 mg/L above background<br />
0 1000 2000 3000 4000 5000 6000 7000 8000 9000 10000<br />
N load 30<br />
N load 40<br />
N load 80<br />
Number <strong>of</strong> <strong>septic</strong> <strong>tank</strong>s<br />
Figure 6. Projected <strong>septic</strong>-<strong>tank</strong>-system <strong>density</strong> versus nitrate concentraion <strong>for</strong> the pr<strong>in</strong>cipal <strong>valley</strong>-fill aquifer <strong>in</strong> Cedar Valley, Iron County, Utah. N<br />
load 30, N load 40, and N load 80 refer to the low, best estimate, and high nitrogen load<strong>in</strong>gs per liter <strong>of</strong> wastewater from <strong>septic</strong>-<strong>tank</strong> systems (Hansen,<br />
Allen, and Luce, Inc., 1994).
16 Utah Geological Survey<br />
Wasatch County, Utah [Hansen, Allen, and Luce, Inc.,<br />
1994]), the number <strong>of</strong> new homes us<strong>in</strong>g <strong>septic</strong> <strong>tank</strong> soilabsorption<br />
systems should not exceed 2,600 based on the<br />
best-estimate nitrogen load <strong>of</strong> 40 mg/L per <strong>septic</strong>-<strong>tank</strong> system<br />
(figure 6) (Wallace and Lowe, 1998a). This corresponds<br />
to a <strong>valley</strong>-wide maximum <strong>of</strong> 4,000 <strong>septic</strong>-<strong>tank</strong> systems and<br />
an average <strong>septic</strong>-<strong>tank</strong>-system <strong>density</strong> <strong>of</strong> about 27 acres/system<br />
(0.109 km 2 /system) (Wallace and Lowe, 1998a).<br />
SITE-SPECIFIC SEPTIC-SYSTEM DENSITY<br />
EVALUATIONS<br />
Areas<br />
As part <strong>of</strong> this study, we applied a mass-balance equation<br />
to <strong>three</strong> <strong>areas</strong> <strong>in</strong> southwestern Cedar Valley us<strong>in</strong>g site-specific<br />
ground-water flow available <strong>for</strong> mix<strong>in</strong>g and site-specific<br />
ground-water-quality data to aid <strong>in</strong> determ<strong>in</strong><strong>in</strong>g recommended<br />
<strong>septic</strong>-system <strong>density</strong>/lot size. One area is located near<br />
Hamiltons Fort (figure 1) on the Shirts Creek (<strong>for</strong>merly<br />
known as Schurtz Creek) alluvial fan; Shirts Creek dra<strong>in</strong>s the<br />
Markagunt Plateau to the east <strong>of</strong> Cedar Valley. A second<br />
area, the Bauers Knoll area, is located <strong>in</strong> west-central Cedar<br />
Valley (figure 1) just east <strong>of</strong> the Eightmile Hills on the west<br />
side <strong>of</strong> Cedar Valley. The third area, the Mid Valley Estates<br />
area, is located <strong>in</strong> central Cedar Valley, just southwest <strong>of</strong><br />
Enoch (figure 1). All <strong>three</strong> <strong>areas</strong> have some exist<strong>in</strong>g development,<br />
mostly s<strong>in</strong>gle-family dwell<strong>in</strong>gs us<strong>in</strong>g <strong>septic</strong>-<strong>tank</strong><br />
systems <strong>for</strong> wastewater disposal, but have the potential <strong>for</strong><br />
additional development.<br />
Variables Considered<br />
We calculated <strong>septic</strong>-<strong>tank</strong>-system <strong>density</strong> versus waterquality<br />
degradation <strong>for</strong> each site based on an array <strong>of</strong> parameters<br />
that affect the amount <strong>of</strong> ground water available <strong>for</strong><br />
dilution and based on a variable number <strong>of</strong> <strong>septic</strong>-<strong>tank</strong> systems<br />
reported <strong>in</strong> each area. Accord<strong>in</strong>g to the Southwest Utah<br />
Public Health Department (oral communication, 1999), the<br />
number <strong>of</strong> <strong>septic</strong> <strong>tank</strong>s <strong>in</strong> their database may not be current.<br />
They record 28 <strong>septic</strong> <strong>tank</strong>s <strong>in</strong> the Hamiltons Fort area, about<br />
10 <strong>for</strong> the Bauers Knoll area, and about 195 <strong>in</strong> the Mid Valley<br />
Estates subdivision. We use these numbers <strong>for</strong> our computations,<br />
but compute additional scenarios by <strong>in</strong>creas<strong>in</strong>g the<br />
number <strong>of</strong> <strong>septic</strong> systems that are likely present based on the<br />
number <strong>of</strong> homes that exist <strong>in</strong> each area.<br />
Zone <strong>of</strong> Mix<strong>in</strong>g<br />
Nitrates <strong>in</strong> <strong>septic</strong>-<strong>tank</strong> effluent have a limited vertical<br />
depth through which they disperse; much <strong>of</strong> an aquifer may<br />
rema<strong>in</strong> relatively isolated from <strong>septic</strong>-<strong>tank</strong> effluent. Thus, a<br />
greater dilution <strong>of</strong> nitrate may be erroneously calculated if an<br />
actual aquifer thickness is used. A mix<strong>in</strong>g zone, <strong>of</strong> some<br />
assumed thickness, at the top <strong>of</strong> an aquifer is a more useful<br />
concept than the actual aquifer thickness. Stratified mix<strong>in</strong>g<br />
zones <strong>in</strong> the upper portions <strong>of</strong> aquifers have been documented<br />
<strong>in</strong> aquifer systems <strong>in</strong> Utah, <strong>in</strong>clud<strong>in</strong>g Tooele Valley<br />
(Steiger and Lowe, 1997).<br />
Complete mix<strong>in</strong>g with<strong>in</strong> this mix<strong>in</strong>g zone is assumed <strong>in</strong><br />
the mass-balance approach used <strong>in</strong> this study; however, due<br />
to the lam<strong>in</strong>ar nature <strong>of</strong> ground-water flow <strong>in</strong> most aquifer<br />
systems, complete mix<strong>in</strong>g is unlikely. Bauman and Schafer<br />
(1984) found that nitrate concentrations <strong>in</strong> aquifer systems<br />
with relatively low ground-water velocities, such as the<br />
Cedar Valley bas<strong>in</strong>-fill aquifer, are not overly sensitive to the<br />
thickness <strong>of</strong> the mix<strong>in</strong>g zone. The Montana Department <strong>of</strong><br />
Env<strong>iron</strong>mental Quality (1996) set their mix<strong>in</strong>g zone thickness<br />
to 16.4 feet (5 m). The aquifer systems <strong>in</strong> Montana are<br />
generally th<strong>in</strong>ner than the systems we exam<strong>in</strong>e <strong>in</strong> this study.<br />
To reflect the relatively thick aquifer systems <strong>in</strong> Cedar Valley,<br />
we used a mix<strong>in</strong>g zone thickness <strong>of</strong> 60 feet (18 m).<br />
Location and Area<br />
Hamiltons Fort Area<br />
The Hamiltons Fort area is located about 5.5 miles (8.8<br />
km) south <strong>of</strong> Cedar City, just southwest <strong>of</strong> Cross Hollow<br />
Hills (figure 1). It consists <strong>of</strong> approximately 4,200 acres<br />
(16.9 km 2 ) ma<strong>in</strong>ly centered around section 25, T. 36 S., R. 12<br />
W., Salt Lake Base L<strong>in</strong>e and Meridian. The land surface<br />
slopes gently to the west-northwest. Currently the area is<br />
mostly undeveloped (figure 7), although many developed<br />
lots exist just to the southeast <strong>of</strong> the area.<br />
Surficial Geology<br />
The Hamiltons Fort area is located on the distal portion<br />
<strong>of</strong> the Shirts Creek alluvial fan. Shirts Creek dra<strong>in</strong>s the faulted<br />
and folded Cedar Mounta<strong>in</strong> portion <strong>of</strong> the Markagunt<br />
Plateau which has been uplifted along the Hurricane fault<br />
zone. Upgradient geologic units <strong>in</strong>clude from west to east:<br />
poorly consolidated Quaternary and Tertiary sediments; Quaternary<br />
pediment deposits; the Triassic Moenkopi and Ch<strong>in</strong>le<br />
Formations; the Jurassic Moenave, Kayenta, Navajo, and<br />
Carmel (which <strong>in</strong>cludes the Entrada, Curtis, and W<strong>in</strong>sor Formations<br />
<strong>of</strong> Averitt, 1962) Formations; and the Cretaceous<br />
Dakota, Tropic, and Straight Cliffs Formations (figure 4)<br />
(Averitt, 1962; Mack<strong>in</strong> and others, 1976). The Quaternary<br />
units are the most relevant to this study.<br />
Pleistocene and Holocene alluvial-fan and pediment<br />
deposits consist predom<strong>in</strong>antly <strong>of</strong> unconsolidated silt, sand,<br />
and m<strong>in</strong>or pebble gravel (Rowley, 1975; Mack<strong>in</strong> and others,<br />
1976), and, locally, colluvium, landslide deposits, and bouldery<br />
debris-flow deposits.<br />
The Tertiary and Quaternary sediments consist mostly <strong>of</strong><br />
Miocene, Pliocene, and Pleistocene poorly consolidated light<br />
gray, tan or red, sandy f<strong>in</strong>e-pebble to boulder conglomerate<br />
or, less commonly, coarse-gra<strong>in</strong>ed sandstone or colluvium<br />
(Rowley, 1975, 1976; Mack<strong>in</strong> and others, 1976; Rowley and<br />
Threet, 1976). These sediments mantle hilly <strong>areas</strong> around<br />
the <strong>valley</strong> marg<strong>in</strong>s, are likely mostly alluvial <strong>in</strong> orig<strong>in</strong>, and<br />
are locally <strong>in</strong>terbedded with Quaternary-Tertiary basalt lava<br />
flows (Rowley, 1975, 1976; Mack<strong>in</strong> and others, 1976; Rowley<br />
and Threet, 1976).<br />
Ground-Water Conditions<br />
Occurrence: Ground water <strong>in</strong> the Hamiltons Fort area<br />
occurs under mostly leaky conf<strong>in</strong>ed conditions <strong>in</strong> unconsoli-
Analysis <strong>of</strong> <strong>septic</strong>-<strong>tank</strong> <strong>density</strong>, Cedar Valley, Iron County, Utah<br />
17<br />
Figure 7. View <strong>of</strong> Hamiltons Fort area, Cedar Valley, Iron County, Utah (view to the east).<br />
dated bas<strong>in</strong>-fill deposits. Based on water-well data, the Quaternary<br />
bas<strong>in</strong>-fill deposits consist primarily <strong>of</strong> discont<strong>in</strong>uous<br />
bodies <strong>of</strong> f<strong>in</strong>er gra<strong>in</strong>ed clay, silt, and gravel and coarser<br />
gra<strong>in</strong>ed sand and gravel; f<strong>in</strong>er gra<strong>in</strong>ed deposits are predom<strong>in</strong>ant<br />
<strong>in</strong> the upper layers and coarser gra<strong>in</strong>ed deposits<br />
are predom<strong>in</strong>ant at depth (figure 8). These unconsolidated<br />
bas<strong>in</strong>-fill deposits were primarily deposited as alluvial-fan<br />
sediments. The bas<strong>in</strong> fill is coarser <strong>in</strong> the proximal parts <strong>of</strong><br />
the fan and becomes f<strong>in</strong>er <strong>in</strong> the distal parts.<br />
Depth and transmissivity: Depth to ground water <strong>in</strong> wells<br />
is variable. Well depths range from 200 to 610 feet (61-185<br />
m). Water levels, reported from drillers’ logs <strong>of</strong> water wells<br />
and measured over many different years and seasons, range<br />
from 18 to 176 feet (5.5-54 m). Most wells have a static<br />
water level that is less than 100 feet (30 m) below the land<br />
surface. Transmissivities are somewhat lower <strong>in</strong> this part <strong>of</strong><br />
the <strong>valley</strong>, relative to northeastern Cedar Valley. Based on<br />
two aquifer tests and estimates from specific capacity data,<br />
Bjorklund and others (1978) calculated transmissivities rang<strong>in</strong>g<br />
from 2,000 to 10,000 square feet per day (200-900 m 2 /d)<br />
<strong>in</strong> the Hamiltons Fort/Kanarraville area.<br />
Ground-water flow: Ground-water flow is generally from<br />
the higher elevation recharge <strong>areas</strong> to lower elevation <strong>areas</strong>.<br />
In southern Cedar Valley, ground water flows northward<br />
from the Kanarra area (Bjorklund and others, 1978, plate 5)<br />
and eventually westward towards Iron Spr<strong>in</strong>gs Gap (Thomas<br />
and Taylor, 1946). Ground-water-flow direction <strong>in</strong> the<br />
Hamiltons Fort area is generally to the west, toward Quichapa<br />
Lake. Recharge is likely from Cedar Mounta<strong>in</strong> situated<br />
southeast <strong>of</strong> the Shirts Creek alluvial fan.<br />
Exist<strong>in</strong>g Nitrate Concentrations<br />
Ground water from 14 water wells near the Hamiltons<br />
Fort area was sampled and analyzed <strong>for</strong> nitrate concentration<br />
dur<strong>in</strong>g March 1999. Drillers’ logs are available <strong>for</strong> 9 <strong>of</strong> the<br />
14 wells (appendix A). Depth <strong>of</strong> the completed wells ranges<br />
from 200 feet to 610 feet (61-186 m), and the sediment penetrated<br />
by the wells is dom<strong>in</strong>ated by gravel with m<strong>in</strong>or clay<br />
and sand. Nitrate concentration values (table 5, figure 9)<br />
range from 0.1 to 7.46 mg/L, with an average nitrate concentration<br />
<strong>of</strong> 2.15 mg/L. Three wells, all located <strong>in</strong> section<br />
31, T. 36 S., R. 11 W., Salt Lake Base L<strong>in</strong>e and Meridian,<br />
have nitrate concentrations that exceed 7 mg/L.<br />
No evident correlation exists between nitrate concentration<br />
and well depth or sediment type. For example, the well<br />
hav<strong>in</strong>g the highest nitrate concentration <strong>of</strong> 7.46 mg/L is 400<br />
feet (122 m) deep and penetrates an upper 25-foot-thick (8<br />
m) clay layer underla<strong>in</strong> by gravel. The well hav<strong>in</strong>g the second-highest<br />
nitrate concentration <strong>of</strong> 7.2 mg/L (7.2 ppm) is<br />
located less than 1/2 mile (0.8 km) to the south, is 290 feet (88<br />
m) deep, and penetrates an upper 5-foot-thick (1.5 m) clay<br />
layer underla<strong>in</strong> by gravel. Located less than 100 feet (30 m)<br />
to the east is a 370-foot-deep (113 m) well which penetrates<br />
an upper 28-foot-thick (8.5 m) clay layer and has a nitrate<br />
concentration <strong>of</strong> 0.567 mg/L. All <strong>of</strong> the wells on the more<br />
distal portion <strong>of</strong> the Shirts Creek alluvial fan have nitrate<br />
concentrations below 1 mg/L.<br />
The variable distribution <strong>of</strong> nitrate concentration <strong>for</strong><br />
wells <strong>in</strong> such close proximity and similar depth <strong>in</strong>dicates that<br />
a nitrate plume <strong>in</strong> ground water is unlikely <strong>in</strong> section 31. The
18 Utah Geological Survey<br />
A’<br />
meters<br />
1750<br />
9B<br />
8B<br />
6B<br />
7B<br />
1725<br />
5B<br />
A<br />
feet<br />
5500<br />
1B<br />
2B<br />
3B<br />
4B<br />
1700<br />
1675<br />
5400<br />
1650<br />
EXPLANATION<br />
5300<br />
5200<br />
1625<br />
1600<br />
1575<br />
F<strong>in</strong>e-gra<strong>in</strong>ed<br />
deposit<br />
Medium- and<br />
coarse-gra<strong>in</strong>ed<br />
deposit<br />
Approximate<br />
potentiometric<br />
surface<br />
4B<br />
Water well<br />
5100<br />
1550<br />
5000<br />
1525<br />
0<br />
0<br />
1<br />
1 mile<br />
2 kilometers<br />
Vertical Exaggeration 18x<br />
Figure 8. Schematic geologic cross section <strong>of</strong> Hamiltons Fort area, Cedar Valley, Iron County, Utah. A-A′ shown on figure 9.<br />
Table 5. Nitrate data <strong>for</strong> Hamiltons Fort area, Cedar Valley, Iron County, Utah.<br />
Well location Well depth (feet) Nitrate (mg/L)<br />
(C-36-12) 24cbb 400 0.99<br />
(C-36-11) 30dbb-1 400 1.1<br />
(C36-12) 23bdc 228 0.1<br />
(C-36-11) 31acd 290 7.2<br />
(C-36-11) 30dbb-2 610 1.13<br />
(C-36-12) 24abd 300 1.0<br />
(C-36-11) 31adb 210 (no log) 0.57<br />
(C-36-11) 31aab 400 7.46<br />
(C-36-11) 19ccd 200 0.64<br />
(C-36-12) 31bad no log 0.1<br />
(C-36-11) 31ada no log 7.12<br />
(C-36-11) 31daa 400 0.64<br />
(C-36-12) 25bdd-1 300 1.6<br />
(C-36-12) 24acc 500 (no log) 0.4
Analysis <strong>of</strong> <strong>septic</strong>-<strong>tank</strong> <strong>density</strong>, Cedar Valley, Iron County, Utah<br />
19<br />
1.0<br />
0.4<br />
A<br />
0.99<br />
T. 36 S.<br />
Transect l<strong>in</strong>e<br />
1.6<br />
0.64<br />
1.13<br />
1.1<br />
0.1<br />
7.46<br />
0.57<br />
7.12<br />
7.2<br />
A'<br />
0.64<br />
R. 12 W. R. 11 W.<br />
0 .5 1 mile<br />
N<br />
0 .5 1 kilometer<br />
EXPLANATION<br />
Study area boundary<br />
Transect l<strong>in</strong>e (refer to text <strong>for</strong> explanation)<br />
A A' Cross section (refer to figure 8)<br />
Wells<br />
pump<strong>in</strong>g well<br />
aquifer test well<br />
Nitrate concentrations<br />
0.1-0.5 mg/L<br />
0.51-1.0 mg/L<br />
1.1-5.0 mg/L<br />
5.1-10.0 mg/L<br />
Figure 9. Nitrate concentrations <strong>for</strong> the water wells <strong>in</strong> the Hamiltons Fort area, Cedar Valley, Iron County, Utah.
20 Utah Geological Survey<br />
most likely cause <strong>of</strong> elevated nitrate <strong>in</strong> one well is its proximity<br />
to a corral; <strong>for</strong> another, the most likely cause is its proximity<br />
to a <strong>septic</strong>-<strong>tank</strong> system. There is no obvious nitrate<br />
source associated with the third well which has a nitrate concentration<br />
above 7 mg/L. Naturally occurr<strong>in</strong>g nitrate <strong>in</strong> the<br />
Straight Cliffs Formation, which outcrops <strong>in</strong> the upper portion<br />
<strong>of</strong> the surface dra<strong>in</strong>age bas<strong>in</strong>, could also be responsible<br />
<strong>for</strong> some <strong>of</strong> the nitrate found <strong>in</strong> ground water <strong>in</strong> the Hamiltons<br />
Fort area.<br />
Aquifer Test<br />
General: To obta<strong>in</strong> transmissivity and other <strong>in</strong><strong>for</strong>mation<br />
about the aquifer <strong>in</strong> the Hamiltons Fort area, we conducted a<br />
48-hour, multiple-well, constant-discharge-rate aquifer test<br />
between May 26 and May 28, 1999. This test was done <strong>in</strong><br />
cooperation with Jim Mason <strong>of</strong> the U.S. Geological Survey.<br />
The test used two wells, a pump<strong>in</strong>g well and an observation<br />
well. We orig<strong>in</strong>ally planned to monitor both wells dur<strong>in</strong>g the<br />
aquifer test; however, we could not <strong>in</strong>stall a probe to measure<br />
water levels <strong>in</strong> the pump<strong>in</strong>g well. We monitored water<br />
levels <strong>in</strong> the observation well dur<strong>in</strong>g the drawdown phase <strong>of</strong><br />
the test us<strong>in</strong>g both a pressure transducer and data logger and<br />
an electric tape. Dur<strong>in</strong>g the recovery phase only the pressure<br />
transducer and data logger were used to monitor water levels.<br />
We compared these two data sources dur<strong>in</strong>g the <strong>analysis</strong> <strong>of</strong><br />
the drawdown data. The pressure transducer measured water<br />
levels <strong>in</strong> the observation well <strong>for</strong> four days be<strong>for</strong>e the start <strong>of</strong><br />
the aquifer test and <strong>for</strong> four days after the recovery period.<br />
Regional water-level trends were determ<strong>in</strong>ed us<strong>in</strong>g these<br />
data. A static (<strong>in</strong>itial) water or piezometric level <strong>of</strong> 105.25<br />
feet (32 m) below the top <strong>of</strong> the observation well’s cas<strong>in</strong>g<br />
was measured be<strong>for</strong>e start<strong>in</strong>g the aquifer test.<br />
The test was conducted us<strong>in</strong>g the exist<strong>in</strong>g pump <strong>in</strong> the<br />
pump<strong>in</strong>g well runn<strong>in</strong>g at its maximum capacity. Discharge<br />
rates dur<strong>in</strong>g the aquifer test were measured us<strong>in</strong>g a Controlotron<br />
clamp-on portable multi-function flow meter and were<br />
approximately constant at 890 gallons per m<strong>in</strong>ute (56 L/s).<br />
Pumped water was conducted away and down gradient from<br />
the well <strong>in</strong> an 8-<strong>in</strong>ch (20 cm) pipe <strong>for</strong> about 100 feet (30 m)<br />
and then <strong>in</strong> a cement-l<strong>in</strong>ed ditch <strong>for</strong> about another 1,000 feet<br />
(305 m), where it was discharged onto the ground surface.<br />
Aquifer-test wells and pump: An exam<strong>in</strong>ation <strong>of</strong> the drillers’<br />
logs (appendix B) and an onsite <strong>in</strong>vestigation provided<br />
the follow<strong>in</strong>g <strong>in</strong><strong>for</strong>mation regard<strong>in</strong>g the two wells used <strong>for</strong><br />
the Hamiltons Fort area aquifer test. The pump<strong>in</strong>g well is <strong>in</strong><br />
the SW1/4SW1/4NE1/4 and the observation well is <strong>in</strong> the<br />
NW1/4SW1/4SE1/4 section 25, T. 36 S., R. 12 W., Salt Lake<br />
Base L<strong>in</strong>e and Meridian (figure 9). The observation well is<br />
approximately 1,700 feet (517 m) southeast <strong>of</strong> the pump<strong>in</strong>g<br />
well. Both wells were completed <strong>for</strong> agricultural use; however,<br />
the observation well has not been operable <strong>for</strong> about a<br />
decade. The pump<strong>in</strong>g well is shallower (300 feet [91 m]<br />
deep) and located northwest <strong>of</strong> the observation well, which is<br />
600 feet (183 m) deep; however, the per<strong>for</strong>ated <strong>in</strong>tervals<br />
overlap. The annular spac<strong>in</strong>g between the discharge tube and<br />
the well cas<strong>in</strong>g prevented a probe from reach<strong>in</strong>g the water<br />
level <strong>in</strong> the pump<strong>in</strong>g well; there<strong>for</strong>e, water levels were not<br />
measured <strong>in</strong> the pump<strong>in</strong>g well.<br />
The pump<strong>in</strong>g well was cable-tool drilled at an approximate<br />
surface elevation <strong>of</strong> 5,540 feet (1,689 m) with a 16- or<br />
18-<strong>in</strong>ch (41 or 46 cm) bit. The well was completed <strong>in</strong><br />
November 1956 to a depth <strong>of</strong> 300 feet (91 m). The well’s<br />
cas<strong>in</strong>g is 14 <strong>in</strong>ches (36 cm) <strong>in</strong> diameter and is 1/4-<strong>in</strong>ch (0.64<br />
cm) steel with welded jo<strong>in</strong>ts. The per<strong>for</strong>ated <strong>in</strong>terval is<br />
between 90 and 300 feet (27-91 m). The per<strong>for</strong>ation size is<br />
unknown. The top <strong>of</strong> the well cas<strong>in</strong>g is about 2 <strong>in</strong>ches (5 cm)<br />
above the ground surface. No completion <strong>in</strong><strong>for</strong>mation is<br />
available <strong>for</strong> the well, but we assume that a seal was not constructed.<br />
The pump<strong>in</strong>g well was equipped with a reliable<br />
power source and a gate valve placed about 3 feet (1 m) from<br />
the well <strong>for</strong> controll<strong>in</strong>g discharge from the well.<br />
The observation well was rotary drilled at an approximate<br />
surface elevation <strong>of</strong> 5,552 feet (1,692 m) with an 18- or<br />
20-<strong>in</strong>ch (46 or 51 cm) bit. The well was completed <strong>in</strong> April<br />
1971 to a depth <strong>of</strong> 600 feet (183 m). The well’s cas<strong>in</strong>g diameter<br />
is 16 <strong>in</strong>ches (41 cm) from the surface to 370 feet (113<br />
m); the well is uncased below 370 feet (113 m). The well<br />
cas<strong>in</strong>g is 1/4-<strong>in</strong>ch (0.64 cm) steel with welded jo<strong>in</strong>ts. Per<strong>for</strong>ated<br />
<strong>in</strong>tervals are between 120 and 370 feet (37-113 m). The<br />
per<strong>for</strong>ations are 3/16 x 3 <strong>in</strong>ches (0.48 x 8 cm) and were done<br />
by mills knife. The well was gravel packed with 3/4-<strong>in</strong>ch<br />
gravel from the surface to 370 feet (0-113 m) and no surface<br />
seal was constructed. The top <strong>of</strong> the well cas<strong>in</strong>g is about 8<br />
<strong>in</strong>ches (20 cm) above a cement collar. The observation well<br />
is equipped with a plug <strong>in</strong> the well-pump cas<strong>in</strong>g that allows<br />
a probe to be <strong>in</strong>serted between the discharge tube and the<br />
well cas<strong>in</strong>g <strong>for</strong> water-level measurements.<br />
The pump used <strong>in</strong> the pump<strong>in</strong>g well is a Kemble pump<br />
(vertical turb<strong>in</strong>e) with a 50 horsepower, <strong>three</strong>-phase, 220/440<br />
volts U.S. electrical motor. The maximum projected pump<strong>in</strong>g<br />
rate is probably about 1,500 gallons per m<strong>in</strong>ute (95 L/s).<br />
The pump bowls are set at an unknown depth <strong>in</strong> the well.<br />
Analysis: Data from early water-level measurements <strong>in</strong> the<br />
observation well, dur<strong>in</strong>g the drawdown phase <strong>of</strong> the aquifer<br />
test (first 100 m<strong>in</strong>utes), probably reflect some wellbore storage<br />
effects, result<strong>in</strong>g <strong>in</strong> a more gradual slope than expected<br />
(figure 10). A temporary problem with the pump at about<br />
1,200 m<strong>in</strong>utes <strong>in</strong>to the drawdown phase <strong>of</strong> the test resulted <strong>in</strong><br />
a decrease <strong>in</strong> flow rate and allowed partial recovery <strong>of</strong> the<br />
water level. The aquifer-test duration was not sufficient to<br />
<strong>in</strong>clude the longer-term drawdown data that would have<br />
helped <strong>in</strong> curve match<strong>in</strong>g. We used water level measurements<br />
taken after 100 m<strong>in</strong>utes <strong>in</strong> determ<strong>in</strong><strong>in</strong>g the transmissivity<br />
<strong>of</strong> the aquifer. Drawdown was about 1.5 feet (0.5 m)<br />
based on water-level measurements <strong>in</strong> the observation well<br />
dur<strong>in</strong>g the test. The observed water-level changes were corrected<br />
<strong>for</strong> prepump<strong>in</strong>g trends. Barometric effects on the<br />
water level were negligible, there<strong>for</strong>e no corrections were<br />
made <strong>in</strong> comput<strong>in</strong>g ground-water levels.<br />
Curve match<strong>in</strong>g us<strong>in</strong>g Neuman, Theis, and Hantush type<br />
curves and the Cooper-Jacob semilogarithmic approximation<br />
method were used to analyze drawdown data from the<br />
aquifer test (Theis, 1935; Cooper and Jacob, 1946, Hantush,<br />
1960, Neuman, 1974). We used the computer program<br />
AQTESOLV <strong>for</strong> W<strong>in</strong>dows (Hydrosolve, 1996) <strong>in</strong> these evaluations.<br />
This program generates “best fit” matches <strong>for</strong> a chosen<br />
analytical technique after a specified number <strong>of</strong> iterations,<br />
or can numerically fit aquifer test data to specific type<br />
curves. Calculated values from the different methods <strong>of</strong><br />
<strong>analysis</strong> are very similar. Us<strong>in</strong>g the Hantush type curves,<br />
which we believe are more characteristic <strong>of</strong> the aquifer, we<br />
calculated a transmissivity <strong>of</strong> about 20,900 square feet per<br />
day (1,940 m 2 /d). The drawdown data, corrected <strong>for</strong> the pre-
Analysis <strong>of</strong> <strong>septic</strong>-<strong>tank</strong> <strong>density</strong>, Cedar Valley, Iron County, Utah<br />
21<br />
Aquifer Model: Leaky<br />
Solution Method: Hantush<br />
Transmissivity = 20,894 square feet per day<br />
Hantush type curve<br />
Figure 10. Hamiltons Fort area, drawdown data plot, Cedar Valley, Iron County, Utah.<br />
pump<strong>in</strong>g trends, are plotted aga<strong>in</strong>st time <strong>in</strong> figure 10. The<br />
recovery phase test data compared favorably to the drawdown<br />
data.<br />
Results<br />
Figure 11 shows a plot <strong>of</strong> projected nitrate concentration<br />
<strong>in</strong> the Hamiltons Fort area <strong>of</strong> the Cedar Valley aquifer versus<br />
<strong>septic</strong>-<strong>tank</strong> <strong>density</strong> and number <strong>of</strong> <strong>septic</strong>-<strong>tank</strong> systems.<br />
Us<strong>in</strong>g the data presented <strong>in</strong> table 5, an average background<br />
nitrate concentration <strong>for</strong> the Hamiltons Fort area is calculated<br />
to be 2.15 mg/L. Based on public record documents,<br />
approximately 28 <strong>septic</strong> systems exist <strong>in</strong> the Hamiltons Fort<br />
area (Southwest Utah Public Health Department, written<br />
communication, 1999). The Hamiltons Fort area is approximately<br />
4,200 acres (16.9 km 2 ), so the average <strong>septic</strong>-system<br />
<strong>density</strong> is about 150 acres/system (0.61 km 2 /system). Based<br />
on the transmissivity obta<strong>in</strong>ed from the aquifer test described<br />
above, estimated ground-water flow available <strong>for</strong> mix<strong>in</strong>g <strong>in</strong><br />
the Hamiltons Fort area through a 3.5-mile (5.6 km) transect<br />
(figure 9) is 15 cubic feet per second (0.42 m 3 /s) (table 6).<br />
For the Hamiltons Fort subdivision area to ma<strong>in</strong>ta<strong>in</strong> an overall<br />
nitrate concentration <strong>of</strong> 3.15 mg/L (which allows 1 mg/L<br />
<strong>of</strong> degradation, a value adopted by Wasatch and Weber<br />
Counties as an acceptable level <strong>of</strong> degradation), the total<br />
number <strong>of</strong> homes us<strong>in</strong>g <strong>septic</strong> <strong>tank</strong> soil-absorption systems<br />
should not exceed 690 based on the best estimate nitrogen<br />
load <strong>of</strong> 40 mg/L (40 ppm) per <strong>septic</strong>-<strong>tank</strong> system (figure 11).<br />
This corresponds to an <strong>in</strong>crease <strong>of</strong> approximately 660 new<br />
<strong>septic</strong> systems and an average <strong>septic</strong>-system <strong>density</strong> <strong>of</strong> about<br />
5.5 acres/system (0.022 km 2 /system) <strong>in</strong> the Hamiltons Fort<br />
area.<br />
Figure 12 shows a plot <strong>of</strong> projected nitrate concentration<br />
<strong>in</strong> the Hamilton Fort area’s aquifer versus <strong>septic</strong>-<strong>tank</strong> <strong>density</strong><br />
and number <strong>of</strong> <strong>septic</strong>-<strong>tank</strong> systems assum<strong>in</strong>g an exist<strong>in</strong>g<br />
number <strong>of</strong> 100 <strong>septic</strong> systems. We believe 100 <strong>septic</strong> <strong>tank</strong>s<br />
to be a more realistic estimate <strong>of</strong> the total number <strong>of</strong> systems<br />
<strong>in</strong> the Hamiltons Fort area based on a w<strong>in</strong>dshield survey. As<br />
above, us<strong>in</strong>g an average background concentration <strong>for</strong> the<br />
Hamiltons Fort area <strong>of</strong> 2.15 mg/L and an area <strong>of</strong> approximately<br />
4,200 acres (16.9 km 2 ), the average <strong>septic</strong>-system<br />
<strong>density</strong> <strong>in</strong> this scenario is about 42 acres/system (0.17<br />
km 2 /system). Estimated ground-water flow available <strong>for</strong><br />
mix<strong>in</strong>g <strong>in</strong> the Hamiltons Fort area through a 3.5-mile (5.6<br />
km) transect <strong>in</strong> the lower reaches <strong>of</strong> the alluvial fan <strong>in</strong> the<br />
subdivision area (figure 9) is 15 cubic feet per second (0.42<br />
m 3 /s). For the Hamiltons Fort area to ma<strong>in</strong>ta<strong>in</strong> an overall<br />
nitrate concentration <strong>of</strong> 3.15 mg/L, the total number <strong>of</strong><br />
homes us<strong>in</strong>g <strong>septic</strong> <strong>tank</strong> soil absorption systems should not<br />
exceed about 760 based on the best estimate nitrogen load <strong>of</strong><br />
40 mg/L per <strong>septic</strong>-<strong>tank</strong> system (figure 12). This corresponds<br />
to an <strong>in</strong>crease <strong>of</strong> approximately 660 new <strong>septic</strong> systems<br />
and an average <strong>septic</strong>-system <strong>density</strong> <strong>of</strong> about 5.6<br />
acres/system (0.02 km 2 /system) <strong>in</strong> the Hamiltons Fort area.<br />
Recommendations <strong>for</strong> Land-Use Plann<strong>in</strong>g<br />
We believe the second scenario presented above is the<br />
most appropriate one to be applied to the Hamiltons Fort<br />
area. In this part <strong>of</strong> Cedar Valley, lots us<strong>in</strong>g <strong>septic</strong>-<strong>tank</strong> systems<br />
<strong>for</strong> wastewater disposal should be no smaller than 5.6<br />
acres (0.02 km 2 ). The area could be served by an exist<strong>in</strong>g<br />
<strong>valley</strong>-wide public sanitary sewer system; this is the most<br />
appropriate option <strong>for</strong> domestic wastewater disposal.
22 Utah Geological Survey<br />
150<br />
Hamiltons Fort<br />
Septic-<strong>tank</strong> <strong>density</strong> (acres/system)<br />
5.5<br />
10<br />
9.5<br />
9<br />
8.5<br />
N load 30<br />
Nitrate concentration (mg/L)<br />
8<br />
7.5<br />
7<br />
6.5<br />
6<br />
5.5<br />
5<br />
4.5<br />
4<br />
3.5<br />
3<br />
2.5<br />
2<br />
1.5<br />
1<br />
0.5<br />
0<br />
1 mg/L above background<br />
background = 2.15 mg/L<br />
best estimate<br />
0 100 200 300 400 500 600 700 800<br />
N load 40<br />
N load 80<br />
Number <strong>of</strong> <strong>septic</strong> <strong>tank</strong>s<br />
Figure 11. Projected <strong>septic</strong>-<strong>tank</strong>-system <strong>density</strong> versus nitrate concentration <strong>for</strong> the Hamiltons Fort area <strong>in</strong> Cedar Valley, Iron County, Utah based<br />
on 28 exist<strong>in</strong>g <strong>septic</strong> systems and ground-water flow through a 3.5-mile transect. N load 30, N load 40, and N load 80 refer to the low, best estimate,<br />
and high nitrogen load<strong>in</strong>gs per liter <strong>of</strong> wastewater from <strong>septic</strong>-<strong>tank</strong> systems (Hansen, Allen, and Luce, Inc., 1994).<br />
10<br />
9.5<br />
9<br />
8.5<br />
8<br />
7.5<br />
6.5 7<br />
6<br />
5.5<br />
5<br />
4.5<br />
4<br />
3.5<br />
3<br />
2.5<br />
2<br />
1.5<br />
1<br />
0.5<br />
0<br />
42<br />
1 mg/L above background<br />
background = 2.15 mg/L<br />
Hamiltons Fort<br />
Septic-<strong>tank</strong> <strong>density</strong> (acres/system)<br />
0 100 200 300 400 500 600 700 800<br />
Number <strong>of</strong> <strong>septic</strong> <strong>tank</strong>s<br />
5.6<br />
best estimate<br />
N load 30<br />
N load 40<br />
N load 80<br />
Figure 12. Projected <strong>septic</strong>-<strong>tank</strong>-system <strong>density</strong> versus nitrate concentration <strong>for</strong> the Hamiltons Fort area <strong>in</strong> Cedar Valley, Iron County, Utah based<br />
on 100 exist<strong>in</strong>g <strong>septic</strong> systems. N load 30, N load 40, and N load 80 refer to the low, best estimate, and high nitrogen load<strong>in</strong>gs per liter <strong>of</strong> wastewater<br />
from <strong>septic</strong>-<strong>tank</strong> systems (Hansen, Allen, and Luce, Inc., 1994).
Analysis <strong>of</strong> <strong>septic</strong>-<strong>tank</strong> <strong>density</strong>, Cedar Valley, Iron County, Utah<br />
23<br />
Table 6. Parameters used to compute amount <strong>of</strong> ground water available <strong>for</strong> mix<strong>in</strong>g, Cedar Valley, Iron County, Utah.<br />
PARAMETER HAMILTONS BAUERS MID VALLEY<br />
FORT KNOLL ESTATES<br />
hydraulic conductivity (K) 0.058 ft/m<strong>in</strong> 0.013 ft/m<strong>in</strong> 0.0025 ft/m<strong>in</strong><br />
thickness <strong>of</strong> mix<strong>in</strong>g zone (b) 60 ft 60 ft 60 ft<br />
length <strong>of</strong> area (L) 18,480 ft 13,200 ft 5,280 ft<br />
hydraulic gradient* (I) 0.014 0.00236 0.0038<br />
volume <strong>of</strong> water available <strong>for</strong> 900 ft 3 /m<strong>in</strong>; 24.2 ft 3 /m<strong>in</strong>; 2.71 ft 3 /m<strong>in</strong>;<br />
mix<strong>in</strong>g (Q) 15 ft 3 /sec 0.4 ft 3 /sec 0.045 ft 3 /sec<br />
*calculated from potentiometric surface contours shown <strong>in</strong> Bjorklund and others, 1978, plate 6.<br />
Location and Area<br />
Bauers Knoll Area<br />
The Bauers Knoll area is located around the topographic<br />
high designated Bauers Knoll, just southeast <strong>of</strong> Iron<br />
Spr<strong>in</strong>gs Gap and east <strong>of</strong> the Eightmile Hills (figures 1 and<br />
13). It consists <strong>of</strong> approximately 3,800 acres (15.5 km 2 )<br />
ma<strong>in</strong>ly centered <strong>in</strong> section 3, T. 36 S., R. 12 W., Salt Lake<br />
Base L<strong>in</strong>e and Meridian. The land surface slopes very gently<br />
to the east.<br />
Surficial Geology<br />
The Bauers Knoll area is located on Pleistocene to<br />
Holocene bas<strong>in</strong>-fill deposits. Sediments are derived predom<strong>in</strong>antly<br />
from the complexly faulted Eightmile Hills to the<br />
west, and periodically from major flood events from the<br />
Markagunt Plateau to the east. Upgradient geologic units primarily<br />
<strong>in</strong>clude, from east to west, Quaternary fan and pediment<br />
deposits and Tertiary volcanic rocks (figure 4) (Mack<strong>in</strong><br />
and others, 1976).<br />
Pleistocene and Holocene bas<strong>in</strong>-fill deposits consist <strong>of</strong><br />
unconsolidated clay, silt, and sand, predom<strong>in</strong>antly alluvial <strong>in</strong><br />
orig<strong>in</strong>. These deposits <strong>in</strong>clude sediments <strong>of</strong> a fairly extensive<br />
Pleistocene lake (Mack<strong>in</strong> and others, 1976). Pleistocene<br />
and Holocene alluvial-fan and pediment deposits consist predom<strong>in</strong>antly<br />
<strong>of</strong> unconsolidated silt, sand, and m<strong>in</strong>or pebble<br />
gravel (Rowley, 1975; Mack<strong>in</strong> and others, 1976), and, locally,<br />
colluvium, landslide deposits, and bouldery debris-flow<br />
deposits.<br />
Ground-Water Conditions<br />
Occurrence: Ground water <strong>in</strong> the Bauers Knoll area <strong>in</strong><br />
Cedar Valley occurs primarily under conf<strong>in</strong>ed conditions <strong>in</strong><br />
unconsolidated bas<strong>in</strong>-fill deposits (Bjorklund and others,<br />
1978). Based on water-well data, the Quaternary bas<strong>in</strong> fill<br />
consists primarily <strong>of</strong> clay and silt <strong>in</strong> the upper layers and<br />
clay, silt, and sand with m<strong>in</strong>or coarser gravel at depth.<br />
Lacustr<strong>in</strong>e silts and clays are common predom<strong>in</strong>antly near<br />
the surface at depths less than 100 feet (30 m). Below 100<br />
feet, the sediments generally consist <strong>of</strong> Quaternary alluvialfan<br />
sediments <strong>in</strong> the <strong>for</strong>m <strong>of</strong> discont<strong>in</strong>uous bodies <strong>of</strong> clay,<br />
silt, and m<strong>in</strong>or sand and gravel. Sand and gravel layers are<br />
th<strong>in</strong> and more common at greater depths (>200 feet [61 m])<br />
(figure 14). The alluvial sediments on the east side <strong>of</strong> the<br />
Bauers Knoll area were likely derived from the Markagunt<br />
Plateau to the east.<br />
Depth and transmissivity: Depth to ground water <strong>in</strong> wells<br />
is variable. Well depths range from 132 to 820 feet (40-250<br />
m). Water levels, reported from drillers’ logs <strong>of</strong> water wells<br />
and measured over many different years and seasons, range<br />
from 15 to 210 feet (4.5-64 m) and average about 40 feet (12<br />
m). Most wells have a static water level that is less than 100<br />
feet (30 m) below the land surface. West <strong>of</strong> Quichapa Lake,<br />
Bjorklund and others (1978) estimated a transmissivity <strong>of</strong><br />
about 42,000 square feet per day (3,900 m 2 /d) <strong>for</strong> an aquifer<br />
test on a well completed <strong>in</strong> the leaky conf<strong>in</strong>ed portion <strong>of</strong> the<br />
bas<strong>in</strong>-fill aquifer.<br />
Ground-water flow: Ground-water flow is generally from<br />
the higher elevation recharge <strong>areas</strong> to lower elevation <strong>areas</strong>.<br />
Recharge is likely primarily from the south end <strong>of</strong> the <strong>valley</strong><br />
and a m<strong>in</strong>or amount from the Eightmile Hills situated due<br />
west <strong>of</strong> the Bauers Knoll area. However, ground water flow<br />
direction <strong>in</strong> the Bauers Knoll area is generally to the north,<br />
toward Iron Spr<strong>in</strong>gs Gap where ground water discharges out<br />
<strong>of</strong> the <strong>valley</strong>. Hydraulic gradients are generally flat <strong>in</strong> the<br />
central, lower elevation <strong>areas</strong> <strong>of</strong> Cedar Valley, such as near<br />
Quichapa Lake, and northwest <strong>of</strong> Quichapa Lake <strong>in</strong> the<br />
Bauers Knoll area.<br />
Exist<strong>in</strong>g Nitrate Concentrations<br />
Ground water from 10 water wells <strong>in</strong> the vic<strong>in</strong>ity <strong>of</strong> the<br />
Bauers Knoll area was sampled and analyzed <strong>for</strong> nitrate concentration<br />
dur<strong>in</strong>g June 1999. Drillers’ well logs are available<br />
<strong>for</strong> 7 <strong>of</strong> the 10 wells (appendix A). Depths <strong>of</strong> the completed<br />
wells range from 132 to 538 feet (40-64 m), and the sediment<br />
penetrated by the wells generally consists <strong>of</strong> mixed clay, silt,<br />
and sand layers with m<strong>in</strong>or sand and gravel horizons. Nitrate<br />
values range from 0.2 to 0.8 mg/L (0.2-0.8 ppm) (table 7, figure<br />
15), with an average nitrate concentration <strong>of</strong> 0.49 mg/L.<br />
No wells have nitrate concentrations that exceed the Utah<br />
dr<strong>in</strong>k<strong>in</strong>g water standard <strong>of</strong> 10 mg/L. The uni<strong>for</strong>m distribution<br />
and low concentration <strong>of</strong> nitrate <strong>in</strong> wells may be attributed<br />
to the presence <strong>of</strong> a mostly cont<strong>in</strong>uous, relatively thick<br />
(typically greater than 50 feet [15 m] <strong>in</strong> all wells) conf<strong>in</strong><strong>in</strong>g<br />
layer.<br />
Aquifer Test<br />
General: To obta<strong>in</strong> transmissivity and other <strong>in</strong><strong>for</strong>mation<br />
about the aquifer <strong>in</strong> the Bauers Knoll area, we used a 24-
24 Utah Geological Survey<br />
Figure 13. View <strong>of</strong> Bauers Knoll area look<strong>in</strong>g toward the east.<br />
A A’<br />
feet<br />
meters<br />
9A<br />
5500 1A<br />
4A 5A 6A 7A 8A<br />
3A<br />
2A<br />
1675<br />
5400<br />
1650<br />
5300<br />
1625<br />
EXPLANATION<br />
1600<br />
F<strong>in</strong>e-gra<strong>in</strong>ed<br />
deposit<br />
5200<br />
5100<br />
<br />
<br />
<br />
1575<br />
1550<br />
4A<br />
Medium- and<br />
coarse-gra<strong>in</strong>ed<br />
deposit<br />
Approximate<br />
potentiometric<br />
surface<br />
Water well<br />
5000<br />
1525<br />
0<br />
1<br />
2 kilometers<br />
0<br />
1 mile<br />
Vertical Exaggeration 16x<br />
Figure 14. Schematic geologic cross section <strong>of</strong> Bauers Knoll area, Cedar Valley, Iron County, Utah. Location <strong>of</strong> A-A′ shown on figure 15.<br />
hour, s<strong>in</strong>gle-well, constant-discharge-rate aquifer test conducted<br />
from January 7 to January 8, 1999, by Sue F<strong>in</strong>stick,<br />
Bulloch Eng<strong>in</strong>eer<strong>in</strong>g. Bulloch Eng<strong>in</strong>eer<strong>in</strong>g also measured<br />
recovery <strong>of</strong> the well <strong>for</strong> an additional 24 hours from January<br />
8 to January 9, 1999. The test used the exist<strong>in</strong>g pump <strong>in</strong> the<br />
well runn<strong>in</strong>g at its maximum capacity. They measured discharge<br />
rates dur<strong>in</strong>g the aquifer test us<strong>in</strong>g an <strong>in</strong>-l<strong>in</strong>e flow<br />
meter; rates were approximately constant at 165 gallons per
Analysis <strong>of</strong> <strong>septic</strong>-<strong>tank</strong> <strong>density</strong>, Cedar Valley, Iron County, Utah<br />
Table 7. Nitrate data <strong>for</strong> Bauers Knoll area, Cedar<br />
Valley, Iron County, Utah.<br />
Well location Well depth (feet) Nitrate (mg/L)<br />
(C-36-12)3aab 132 0.6<br />
(C-36-12)9aaa 208 0.8<br />
(C-36-12)3abb no log 0.6<br />
(C-36-12)2dbc 450 0.4<br />
(C-36-12)11bcb 400 0.3<br />
(C-36-12)10ada 389 (no log) 0.4<br />
(C-36-12)11bda 304 0.2<br />
(C-36-12)3ccd 538 0.8<br />
(C-36-12)11aca no log 0.3<br />
(C-36-12)3dbb 517 0.5<br />
m<strong>in</strong>ute (10.4 L/s). Bulloch Eng<strong>in</strong>eer<strong>in</strong>g monitored water<br />
levels <strong>in</strong> the well dur<strong>in</strong>g the test us<strong>in</strong>g an electric tape. They<br />
measured a static (<strong>in</strong>itial) water or piezometric level <strong>of</strong> 33.42<br />
feet (10 m) below the top <strong>of</strong> the well cas<strong>in</strong>g be<strong>for</strong>e start<strong>in</strong>g<br />
the aquifer test. We assumed that this water or piezometric<br />
level was horizontal and used this level <strong>for</strong> aquifer-test<br />
<strong>analysis</strong>.<br />
Aquifer-test well and pump: The driller’s log <strong>of</strong> the Mounta<strong>in</strong><br />
View Special Service District public water-supply well<br />
(appendix B), which was used <strong>for</strong> the s<strong>in</strong>gle-well aquifer test,<br />
provided the follow<strong>in</strong>g <strong>in</strong><strong>for</strong>mation. The well is located <strong>in</strong><br />
the center <strong>of</strong> section 3, T. 36 S. R. 12 W., Salt Lake Base L<strong>in</strong>e<br />
and Meridian (figure 15). The well was rotary drilled at an<br />
approximate surface elevation <strong>of</strong> 5,475 feet (1,669 m), with<br />
a 10- or 12-<strong>in</strong>ch (25 or 30 cm) bit. The well was completed<br />
<strong>in</strong> November 1985 to a total depth <strong>of</strong> 517 feet (158 m). The<br />
well cas<strong>in</strong>g is 250 gage steel, welded at jo<strong>in</strong>ts, and has a<br />
diameter <strong>of</strong> 8 <strong>in</strong>ches (20 cm) from the surface to 517 feet<br />
(158 m). The cas<strong>in</strong>g was per<strong>for</strong>ated from 375 to 571 feet<br />
(114-158 m) by mills knife. Per<strong>for</strong>ation size is 3/16 x 21/2<br />
<strong>in</strong>ches (0.5 x 6 cm). The well was gravel packed with 3/8<br />
<strong>in</strong>ch gravel from 200 to 517 feet (61-158 m) and grouted<br />
(surface seal) from the surface to 200 feet (0-61 m) with cement.<br />
The pump <strong>in</strong> the Mounta<strong>in</strong> View Special Service District<br />
well is a 10-horsepower, <strong>three</strong> phase Grundfos brand sta<strong>in</strong>less<br />
steel submersible pump. The pump is set at a depth <strong>of</strong><br />
130 feet (40 m). The maximum projected pump<strong>in</strong>g rate is<br />
probably about 225 gallons per m<strong>in</strong>ute (14 L/sec).<br />
Analysis: When the pump was turned on <strong>for</strong> the drawdown<br />
phase <strong>of</strong> the aquifer test, water was released down the well<br />
column. This prevented accurate water-level measurement<br />
dur<strong>in</strong>g the early drawdown phase <strong>of</strong> the aquifer test (first<br />
m<strong>in</strong>ute); additionally, wellbore storage effects probably<br />
<strong>in</strong>fluenced the first two m<strong>in</strong>utes <strong>of</strong> the test, result<strong>in</strong>g <strong>in</strong> a<br />
steeper slope than expected. After two m<strong>in</strong>utes, this waterlevel<br />
problem ended. There<strong>for</strong>e, we used water-level measurements<br />
taken dur<strong>in</strong>g the rest <strong>of</strong> the drawdown phase <strong>of</strong> the<br />
aquifer test to calculate the transmissivity <strong>of</strong> the aquifer near<br />
the pump<strong>in</strong>g well. Observed fluctuations or erratic behavior<br />
<strong>of</strong> the data was possibly caused by some water leak<strong>in</strong>g out <strong>of</strong><br />
the conf<strong>in</strong><strong>in</strong>g beds. The observed water-level change <strong>in</strong> the<br />
well was 16.08 feet (5 m) dur<strong>in</strong>g the drawdown phase <strong>of</strong> the<br />
aquifer test.<br />
We analyzed drawdown data from this aquifer test <strong>for</strong><br />
hydrologic characteristics us<strong>in</strong>g standard techniques, <strong>in</strong>clud<strong>in</strong>g<br />
type-curve match<strong>in</strong>g with Theis type curves, and a Cooper-Jacob<br />
semilogarithmic approximation method (Theis,<br />
1935; Cooper and Jacob, 1946). We used the computer program<br />
AQTESOLV <strong>for</strong> W<strong>in</strong>dows (Hydrosolve, 1996) <strong>in</strong> these<br />
evaluations. The Theis type curve and Cooper-Jacob semilogarithmic<br />
approximation method were <strong>for</strong> conf<strong>in</strong>ed aquifer<br />
conditions. If the conf<strong>in</strong><strong>in</strong>g unit only leaks small amounts <strong>of</strong><br />
water <strong>in</strong>to the aquifer, the Theis method should produce reliable<br />
results. The Cooper-Jacob semilogarithmic approximation<br />
method is particularly applicable to data from production<br />
wells because drawdown <strong>in</strong> the well is heavily dependent<br />
on the pump<strong>in</strong>g rate, and other factors used to calculate<br />
transmissivity thus quickly become less significant (Walton,<br />
1988). Us<strong>in</strong>g these methods, we calculated a transmissivity<br />
<strong>of</strong> approximately 3,200 square feet per day (297 m 2 /d) with<br />
both the Theis and Cooper-Jacob methods (figure 16). The<br />
recovery phase test data compared favorably to the drawdown<br />
data.<br />
Results<br />
Figure 17 shows a plot <strong>of</strong> projected nitrate concentration<br />
<strong>in</strong> the Bauers Knoll area <strong>of</strong> the Cedar Valley aquifer versus<br />
<strong>septic</strong>-<strong>tank</strong> <strong>density</strong> and number <strong>of</strong> <strong>septic</strong>-<strong>tank</strong> units. Average<br />
background nitrate concentration <strong>for</strong> the Bauers Knoll area is<br />
0.49 mg/L (table 7, figure 15). Public records show approximately<br />
10 <strong>septic</strong> systems exist <strong>in</strong> the Bauers Knoll area<br />
(Southwest Utah Public Health Department, written communication,<br />
1999). The Bauers Knoll area is approximately<br />
3,800 acres (15.5 km 2 ), so the average <strong>septic</strong>-system <strong>density</strong><br />
is about 380 acres/system (1.5 km 2 /system). Based on transmissivity<br />
calculations from the s<strong>in</strong>gle-well aquifer test<br />
described above (Bulloch Eng<strong>in</strong>eer<strong>in</strong>g, written communication,<br />
1999), estimated ground-water flow available <strong>for</strong> mix<strong>in</strong>g<br />
<strong>in</strong> the Bauers Knoll area through a 2.3-mile (3.7 km)<br />
transect is 0.4 cubic feet per second (0.01 m 3 /s) (figure 15).<br />
For this area to ma<strong>in</strong>ta<strong>in</strong> an overall nitrate concentration <strong>of</strong><br />
1.49 mg/L (1.49 ppm), the total number <strong>of</strong> homes us<strong>in</strong>g <strong>septic</strong><br />
<strong>tank</strong> soil absorption systems should not exceed 28 based<br />
on the best estimate nitrogen load <strong>of</strong> 40 mg/L per <strong>septic</strong>-<strong>tank</strong><br />
system (figure 17). This corresponds to an <strong>in</strong>crease <strong>of</strong> about<br />
20 new <strong>septic</strong> systems and an average <strong>septic</strong>-system <strong>density</strong><br />
<strong>of</strong> about 135 acres/system (0.55 km 2 /system) <strong>in</strong> the Bauers<br />
Knoll area. If the acceptable level <strong>of</strong> degradation is raised<br />
and is based on the acceptable degradation nitrate level used<br />
<strong>for</strong> the Hamiltons Fort area, <strong>in</strong> order to ma<strong>in</strong>ta<strong>in</strong> an overall<br />
nitrate concentration <strong>of</strong> 3.15 mg/L <strong>in</strong> this area, the total number<br />
<strong>of</strong> homes us<strong>in</strong>g <strong>septic</strong> <strong>tank</strong> soil absorption systems<br />
should not exceed 60 based on the best estimate nitrogen<br />
load <strong>of</strong> 40 mg/L per <strong>septic</strong>-<strong>tank</strong> system (figure 17). This corresponds<br />
to an <strong>in</strong>crease <strong>of</strong> about 50 new <strong>septic</strong> systems and<br />
an average <strong>septic</strong>-system <strong>density</strong> <strong>of</strong> about 63 acres/system<br />
(0.25 km 2 /system) <strong>for</strong> the Bauers Knoll area.<br />
Figure 18 shows a plot <strong>of</strong> projected nitrate concentration<br />
<strong>in</strong> the Bauers Knoll area’s aquifer versus <strong>septic</strong>-<strong>tank</strong> <strong>density</strong><br />
and number <strong>of</strong> <strong>septic</strong>-<strong>tank</strong> systems assum<strong>in</strong>g an exist<strong>in</strong>g<br />
number <strong>of</strong> 50 <strong>septic</strong> systems. We believe this is a more accurate<br />
estimate <strong>of</strong> the number <strong>of</strong> <strong>septic</strong>-<strong>tank</strong> systems <strong>in</strong> the area<br />
based on a w<strong>in</strong>dshield survey. As above, us<strong>in</strong>g an average<br />
background concentration <strong>for</strong> the Bauers Knoll area <strong>of</strong> 0.49<br />
mg/L (table 7, figure 15) and an area <strong>of</strong> approximately 3,800<br />
acres (15.5 km 2 ), the average <strong>septic</strong>-system <strong>density</strong> <strong>in</strong> this<br />
scenario is about 76 acres/system (0.31 km 2 /system). The<br />
25
26 Utah Geological Survey<br />
T. 35 S.<br />
Transect l<strong>in</strong>e<br />
0.6<br />
0.6<br />
0.5<br />
0.4<br />
T. 36 S.<br />
0.8<br />
A<br />
0.8<br />
0.4<br />
0.3<br />
0.2<br />
0.3<br />
A'<br />
R. 12 W.<br />
0 .5 1 mile<br />
N<br />
0 .5 1 kilometer<br />
A<br />
A'<br />
EXPLANATION<br />
Study area boundary<br />
Transect l<strong>in</strong>e (refer to text <strong>for</strong> explanation)<br />
Cross section (refer to figure 14)<br />
Wells<br />
aquifer test well<br />
Nitrate concentrations<br />
0.1-0.5 mg/L<br />
0.51-1.0 mg/L<br />
Figure 15. Nitrate concentrations <strong>for</strong> the water wells <strong>in</strong> the Bauers Knoll area, Cedar Valley, Iron County, Utah.
Analysis <strong>of</strong> <strong>septic</strong>-<strong>tank</strong> <strong>density</strong>, Cedar Valley, Iron County, Utah<br />
27<br />
Aquifer Model: Conf<strong>in</strong>ed<br />
Solution Method: Cooper-Jacob<br />
Transmissivity = 3,178 square feet per day<br />
Cooper-Jacob straight l<strong>in</strong>e<br />
Figure 16. Bauers Knoll area, drawdown data plot, Cedar Valley, Iron County, Utah.<br />
30<br />
380 135 63<br />
Bauers Knoll<br />
Septic-<strong>tank</strong> <strong>density</strong> (acres/system)<br />
25<br />
N load 30<br />
Nitrate concentrations (mg/L)<br />
20<br />
15<br />
10<br />
5<br />
0<br />
best estimate<br />
background = 0.49 mg/L<br />
acceptable nitrate degradation<br />
level at Hamiltons Fort<br />
1 mg/L above background<br />
0 50 100 150 200 250 300 350 400<br />
Number <strong>of</strong> <strong>septic</strong> <strong>tank</strong>s<br />
N load 40<br />
N load 80<br />
Figure 17. Projected <strong>septic</strong>-<strong>tank</strong> system <strong>density</strong> versus nitrate concentration <strong>for</strong> the Bauers Knoll area <strong>in</strong> Cedar Valley, Iron County, Utah, based on<br />
10 exist<strong>in</strong>g <strong>septic</strong> <strong>tank</strong>s. N load 30, N load 40, and N load 80 refer to the low, best estimate, and high nitrate load<strong>in</strong>gs per liter <strong>of</strong> wastewater from<br />
<strong>septic</strong>-<strong>tank</strong> systems (Hansen, Allen, and Luce, Inc., 1994).
28 Utah Geological Survey<br />
30<br />
76 54 38<br />
Bauers Knoll<br />
Septic-<strong>tank</strong> <strong>density</strong> (acres/system)<br />
25<br />
Nitrate concentration (mg/L)<br />
20<br />
15<br />
10<br />
5<br />
best estimate<br />
acceptable nitrate degradation<br />
level at Hamiltons Fort<br />
N load 30<br />
N load 40<br />
N load 80<br />
1 mg/L above background<br />
background = 0.49 mg/L<br />
0<br />
50 100 150 200 250 300 350 400<br />
Number <strong>of</strong> <strong>septic</strong> <strong>tank</strong>s<br />
Figure 18. Projected <strong>septic</strong>-<strong>tank</strong> system <strong>density</strong> versus nitrate concentration <strong>for</strong> the Bauers Knoll area <strong>in</strong> Cedar Valley, Iron County, Utah, based on<br />
50 exist<strong>in</strong>g <strong>septic</strong> <strong>tank</strong>s. N load 30, N load 40, and N load 80 refer to the low, best estimate, and high nitrate load<strong>in</strong>gs per liter <strong>of</strong> wastewater from<br />
<strong>septic</strong>-<strong>tank</strong> systems (Hansen, Allen, and Luce, Inc., 1994).<br />
estimated ground-water flow available <strong>for</strong> mix<strong>in</strong>g through a<br />
2.3-mile (3.7 km) transect (figure 15) <strong>in</strong> the Bauers Knoll<br />
area is 0.4 cubic feet per second (0.01 m 3 /s). For the Bauers<br />
Knoll area to ma<strong>in</strong>ta<strong>in</strong> an overall nitrate concentration <strong>of</strong><br />
1.49 mg/L, the total number <strong>of</strong> homes us<strong>in</strong>g <strong>septic</strong> <strong>tank</strong> soilabsorption<br />
systems should not exceed about 70 based on the<br />
best estimate nitrogen load <strong>of</strong> 40 mg/L per <strong>septic</strong>-<strong>tank</strong> system<br />
(figure 18). This corresponds to an <strong>in</strong>crease <strong>of</strong> 20 new <strong>septic</strong><br />
systems and an average <strong>septic</strong>-system <strong>density</strong> <strong>of</strong> about 54<br />
acres/system (0.2 km 2 /system) <strong>in</strong> the Bauers Knoll area.<br />
Aga<strong>in</strong>, if we use an acceptable level <strong>of</strong> degradation based on<br />
the acceptable degradation nitrate level used <strong>for</strong> the Hamiltons<br />
Fort area, <strong>in</strong> order to ma<strong>in</strong>ta<strong>in</strong> an overall nitrate concentration<br />
<strong>of</strong> 3.15 mg/L <strong>in</strong> the Bauers Knoll area, the total number<br />
<strong>of</strong> homes us<strong>in</strong>g <strong>septic</strong> <strong>tank</strong> soil-absorption systems<br />
should not exceed 100 based on the best estimate nitrogen<br />
load <strong>of</strong> 40 mg/L per <strong>septic</strong>-<strong>tank</strong> system (figure 18). This corresponds<br />
to an <strong>in</strong>crease <strong>of</strong> 50 new <strong>septic</strong> systems and an<br />
average <strong>septic</strong>-system <strong>density</strong> <strong>of</strong> about 38 acres/system (0.15<br />
km 2 /system) <strong>for</strong> the Bauers Knoll area.<br />
Recommendations <strong>for</strong> Land-Use Plann<strong>in</strong>g<br />
We believe the second scenario presented above, allow<strong>in</strong>g<br />
only 1 mg/L degradation with respect to nitrate, is the<br />
most appropriate one to be applied to the Bauers Knoll area,<br />
because 50 is a more correct estimate <strong>of</strong> the current number<br />
<strong>of</strong> <strong>septic</strong>-<strong>tank</strong> systems <strong>in</strong> the area based on our field reconnaissance.<br />
In this area <strong>of</strong> Cedar Valley, lots us<strong>in</strong>g <strong>septic</strong>-<strong>tank</strong><br />
systems <strong>for</strong> wastewater disposal should be no smaller than 54<br />
acres (0.2 km 2 ). The area could be served by an exist<strong>in</strong>g <strong>valley</strong>-wide<br />
public sanitary sewer system; this is the most<br />
appropriate option <strong>for</strong> domestic wastewater disposal.<br />
Location and Area<br />
Mid Valley Estates Area<br />
The Mid Valley Estates area (figure 19) is located <strong>in</strong> central<br />
Cedar Valley just west southwest <strong>of</strong> Enoch (figure 1). It<br />
consists <strong>of</strong> approximately 640 acres (2.6 km 2 ) <strong>in</strong> sections 8<br />
and 9, T. 35 S., R. 11 W., Salt Lake Base L<strong>in</strong>e and Meridian.<br />
The land surface slopes gently to the north and northwest.<br />
Surficial Geology<br />
The Mid Valley Estates area is located on bas<strong>in</strong>-fill<br />
deposits <strong>in</strong> an area away from bedrock uplands. These<br />
bas<strong>in</strong>-fill deposits conta<strong>in</strong> both f<strong>in</strong>e-gra<strong>in</strong>ed (silt, clay, and<br />
f<strong>in</strong>e sand) and coarse-gra<strong>in</strong>ed (sand and gravel) facies. The<br />
coarse-gra<strong>in</strong>ed facies <strong>in</strong> the bas<strong>in</strong>-fill deposits conta<strong>in</strong> chert,<br />
sandstone, limestone, and igneous clasts with traces <strong>of</strong> carbonaceous<br />
material and gypsum. There<strong>for</strong>e, the bas<strong>in</strong> fill
Analysis <strong>of</strong> <strong>septic</strong>-<strong>tank</strong> <strong>density</strong>, Cedar Valley, Iron County, Utah<br />
29<br />
Figure 19. View <strong>of</strong> Mid Valley Estates area look<strong>in</strong>g toward the southeast.<br />
underly<strong>in</strong>g the Mid Valley Estates area was likely deposited<br />
dur<strong>in</strong>g periodic major flood<strong>in</strong>g events from both the east and<br />
west, although sedimentation from Coal Creek dur<strong>in</strong>g major<br />
flood<strong>in</strong>g events likely predom<strong>in</strong>ates. Because <strong>of</strong> the multiple<br />
sources <strong>of</strong> deposition to this area, the sediment underly<strong>in</strong>g<br />
the area is derived from a comb<strong>in</strong>ation <strong>of</strong> all <strong>of</strong> the rock<br />
units discussed <strong>in</strong> both the Hamiltons Fort and Bauers Knoll<br />
<strong>areas</strong>. Based on the limited extent <strong>of</strong> the modern alluvial<br />
fans to the east and west <strong>of</strong> the Mid Valley Estates area and<br />
the episodic nature <strong>of</strong> modern flood<strong>in</strong>g events from Coal<br />
Creek, we believe that much <strong>of</strong> the upper part <strong>of</strong> the bas<strong>in</strong> fill<br />
was deposited dur<strong>in</strong>g the Pleistocene under wetter climatic<br />
conditions.<br />
Ground-Water Conditions<br />
Occurrence: Ground water <strong>in</strong> the Mid Valley Estates area<br />
occurs under mostly conf<strong>in</strong>ed conditions <strong>in</strong> unconsolidated<br />
bas<strong>in</strong>-fill deposits (Bjorklund and others, 1978). Based on<br />
water well data, the deepest well <strong>in</strong> the area is 550 feet (168<br />
m) and penetrates clay and silt <strong>in</strong> the upper layers and clay,<br />
silt, and sand with m<strong>in</strong>or coarser gravel at depths greater than<br />
100 feet (30 m). Gravel is more abundant <strong>in</strong> wells located to<br />
the east <strong>of</strong> the study area. Alluvial silts and clays dom<strong>in</strong>ate<br />
the bas<strong>in</strong>-fill deposits near the surface and are common at<br />
depths less than 100 feet (30 m). Below 100 feet (30 m), the<br />
sediments consist <strong>of</strong> discont<strong>in</strong>uous bodies <strong>of</strong> clay/silt, and<br />
sand/gravel (figure 20). Available data <strong>in</strong>dicate that vertical<br />
ground-water gradients <strong>in</strong> the area may be upward <strong>in</strong> some<br />
wells, <strong>in</strong> spite <strong>of</strong> the large proportion <strong>of</strong> coarse sediment <strong>in</strong><br />
the bas<strong>in</strong> fill.<br />
Depth and transmissivity: Depth to ground water <strong>in</strong> wells<br />
is variable. Well depths range from 195 to 550 feet (59-168<br />
m). Water levels, reported from drillers’ logs <strong>of</strong> water wells<br />
sampled from various years and seasons, range from 20 to 42<br />
feet (6-13 m), and average about 24 feet (7 m). Most wells<br />
have a static water level that is less than 100 feet (30 m)<br />
below the land surface. Bulloch Eng<strong>in</strong>eer<strong>in</strong>g (1998) estimated<br />
a transmissivity <strong>of</strong> about 12,000 square feet per day<br />
(1,115 m 2 /d) from an aquifer test on a well completed <strong>in</strong> the<br />
conf<strong>in</strong>ed portion <strong>of</strong> the bas<strong>in</strong>-fill aquifer.<br />
Ground-water flow: Ground-water flow is generally from<br />
the higher elevation recharge <strong>areas</strong> to lower elevation <strong>areas</strong>.<br />
Recharge is likely largely from Fiddlers Canyon situated due<br />
east <strong>of</strong> the site. Ground-water flow <strong>in</strong> the Mid Valley Estates<br />
area is generally to the north toward Rush Lake and<br />
then west toward Iron Spr<strong>in</strong>gs Gap. Hydraulic gradients are<br />
generally flat <strong>in</strong> the central, lower elevation <strong>areas</strong> <strong>of</strong> Cedar<br />
Valley.<br />
Exist<strong>in</strong>g Nitrate Concentrations<br />
Ground water from two wells <strong>in</strong> the Mid Valley Estates<br />
area was sampled and analyzed <strong>for</strong> nitrate concentration dur<strong>in</strong>g<br />
the 1980s. Drillers’ logs are available <strong>for</strong> both <strong>of</strong> the<br />
wells (appendix A). Depth <strong>of</strong> completed wells ranges from<br />
300 to 465 feet (91-142 m), and the wells generally penetrate<br />
mixed clay, silt, and sand layers, with m<strong>in</strong>or sand and gravel<br />
beds. Nitrate values range from 0.6 to 0.72 mg/L (table 8,<br />
figure 21), with an average nitrate concentration <strong>of</strong> 0.66<br />
mg/L. No wells have nitrate concentrations that exceed the<br />
Utah dr<strong>in</strong>k<strong>in</strong>g water standard <strong>of</strong> 10 mg/L, although some<br />
wells to the east-northeast <strong>in</strong> the Enoch area do yield water<br />
with nitrate concentrations greater than 10 mg/L.<br />
Aquifer Test<br />
General: To obta<strong>in</strong> transmissivity and other <strong>in</strong><strong>for</strong>mation<br />
about the aquifer <strong>in</strong> the Mid Valley Estates area, we used a<br />
19-hour, s<strong>in</strong>gle-well, constant-discharge-rate aquifer test<br />
conducted from November 10 to November 11, 1998, by Sue<br />
F<strong>in</strong>stick, Ron Larson, Russ Applegate, Jared Baker, and<br />
Emily Bartlett <strong>of</strong> Bulloch Eng<strong>in</strong>eer<strong>in</strong>g, Cedar City, Utah.<br />
The test used the exist<strong>in</strong>g pump <strong>in</strong> the well runn<strong>in</strong>g at its
30 Utah Geological Survey<br />
A A’<br />
feet<br />
5500<br />
1C<br />
2C 3C<br />
4C<br />
5C<br />
6C<br />
7C<br />
8C<br />
9C<br />
10C<br />
meters<br />
1675<br />
5400<br />
1650<br />
1625<br />
5300<br />
EXPLANATION<br />
5200<br />
1600<br />
1575<br />
F<strong>in</strong>e-gra<strong>in</strong>ed<br />
deposit<br />
Medium- and<br />
coarse-gra<strong>in</strong>ed<br />
deposit<br />
Approximate<br />
potentiometric<br />
surface<br />
4C<br />
Water well<br />
5100<br />
1550<br />
0<br />
1<br />
2 kilometers<br />
0<br />
1 mile<br />
Vertical Exaggeration 20x<br />
Figure 20. Schematic geologic cross section <strong>of</strong> Mid Valley Estates area, Cedar Valley, Iron County, Utah. Location A-A′ shown on figure 21.<br />
Table 8. Nitrate data <strong>for</strong> Mid Valley Estates area, Cedar<br />
Valley, Iron County, Utah.<br />
Well location Well depth (feet) Nitrate (mg/L)<br />
(C-35-11)9abc 465 0.6<br />
(C-35-11)8cdd-1 300 0.72<br />
maximum capacity. Bulloch Eng<strong>in</strong>eer<strong>in</strong>g measured discharge<br />
rates dur<strong>in</strong>g the aquifer test us<strong>in</strong>g an <strong>in</strong>-l<strong>in</strong>e flow<br />
meter; rates were approximately constant at 237 gallons per<br />
m<strong>in</strong>ute (15 L/s). Bulloch Eng<strong>in</strong>eer<strong>in</strong>g also measured recovery<br />
<strong>of</strong> the well <strong>for</strong> an additional 21 hours from November 11<br />
to November 12, 1998. Bulloch Eng<strong>in</strong>eer<strong>in</strong>g monitored water<br />
levels <strong>in</strong> the well dur<strong>in</strong>g the test us<strong>in</strong>g an electric tape.<br />
Be<strong>for</strong>e start<strong>in</strong>g the aquifer test, Bulloch Eng<strong>in</strong>eer<strong>in</strong>g measured<br />
a static (<strong>in</strong>itial) water or piezometric-surface level <strong>of</strong><br />
30.67 feet (9 m) below the top <strong>of</strong> the well cas<strong>in</strong>g. We assumed<br />
that this water or piezometric-surface level was horizontal,<br />
and we used this water level <strong>for</strong> the aquifer-test <strong>analysis</strong>.<br />
Aquifer-test well: The driller’s log provided the follow<strong>in</strong>g<br />
<strong>in</strong><strong>for</strong>mation regard<strong>in</strong>g the Angus Water Company well<br />
(appendix B) used <strong>in</strong> the Mid Valley Estates area aquifer test.<br />
The well is <strong>in</strong> the NW1/4 NW1/4 NE1/4 section 9, T. 35 S., R.<br />
11 W., Salt Lake Base L<strong>in</strong>e and Meridian (figure 21). The<br />
well was rotary drilled at a surface elevation <strong>of</strong> about 5,476<br />
feet (1,669 m) with a 24-<strong>in</strong>ch (61 cm) bit. It was completed<br />
at a total depth <strong>of</strong> 465 feet (142 m) as a municipal water well<br />
<strong>in</strong> December 1998. The well’s cas<strong>in</strong>g is 250-gage, 12-<strong>in</strong>chdiameter<br />
(30 cm) steel with welded jo<strong>in</strong>ts. Per<strong>for</strong>ated <strong>in</strong>tervals<br />
<strong>for</strong> the well are at 180 to 265 feet (55-81 m) and 345 to<br />
465 feet (105-142 m). The per<strong>for</strong>ations are 1/8 x 2.5 <strong>in</strong>ches<br />
(0.32 x 6 cm) and were done by mills knife. The top <strong>of</strong> the<br />
well cas<strong>in</strong>g is about 8 <strong>in</strong>ches (20 cm) above a cement collar.<br />
The well is equipped with a plug <strong>in</strong> the well cap that allows<br />
a probe to be <strong>in</strong>serted between the discharge tube and the<br />
well cas<strong>in</strong>g <strong>for</strong> water-level measurements. A surface seal<br />
was constructed from the surface to a depth <strong>of</strong> 100 feet (30<br />
m), and a filter consist<strong>in</strong>g <strong>of</strong> pea gravel was <strong>in</strong>stalled from<br />
105 to 465 feet (32-142 m). No <strong>in</strong><strong>for</strong>mation is known about<br />
the pump.<br />
Analysis: Water-level measurements dur<strong>in</strong>g the early drawdown<br />
phase <strong>of</strong> the aquifer test (first m<strong>in</strong>ute) were scattered.<br />
This was probably due to wellbore storage effects and the<br />
release <strong>of</strong> water <strong>in</strong> the well column. After about one m<strong>in</strong>ute,<br />
the water level <strong>in</strong> the well stabilized and water-level measurements<br />
taken dur<strong>in</strong>g the rest <strong>of</strong> the drawdown phase <strong>of</strong> the<br />
aquifer test were used <strong>in</strong> determ<strong>in</strong><strong>in</strong>g the transmissivity <strong>of</strong><br />
the aquifer near the pump<strong>in</strong>g well. The effect <strong>of</strong> leakage on<br />
the drawdown curve is expressed by the rapid decrease <strong>of</strong> the<br />
rate <strong>of</strong> water-level decl<strong>in</strong>e as the cone <strong>of</strong> depression spread.<br />
The curve flattens with<strong>in</strong> 500 m<strong>in</strong>utes <strong>of</strong> the start <strong>of</strong> the test<br />
as more <strong>of</strong> the discharge is derived from leakage and the<br />
water level stabilizes. At approximately this po<strong>in</strong>t, the well<br />
discharge is balanced by leakage from the semi-conf<strong>in</strong><strong>in</strong>g<br />
layer. The observed water-level change <strong>in</strong> the well was 56.75<br />
feet (17 m) dur<strong>in</strong>g the drawdown phase <strong>of</strong> the aquifer test.<br />
Water-level measurements could not be made dur<strong>in</strong>g the<br />
first two m<strong>in</strong>utes <strong>of</strong> the recovery phase <strong>of</strong> the aquifer test,<br />
because <strong>of</strong> water fall<strong>in</strong>g back <strong>in</strong>to the well when the pump<br />
was turned <strong>of</strong>f. After about two m<strong>in</strong>utes, the water level <strong>in</strong>
Analysis <strong>of</strong> <strong>septic</strong>-<strong>tank</strong> <strong>density</strong>, Cedar Valley, Iron County, Utah<br />
31<br />
Transect l<strong>in</strong>e<br />
A<br />
5477<br />
0.6<br />
BM 5480<br />
5477<br />
T. 35 S.<br />
0.72<br />
Mid Valley Road<br />
5494<br />
BM<br />
5496<br />
R. 11 W. A'<br />
A<br />
'<br />
0 .5mile<br />
0 .5 kilometer<br />
EXPLANATION<br />
Study area boundary<br />
Transect l<strong>in</strong>e (refer to text <strong>for</strong> explanation)<br />
A A'<br />
Cross section (refer to figure 20)<br />
Nitrate concentrations<br />
0.50-1.0 mg/L<br />
aquifer test well<br />
N<br />
Figure 21. Nitrate concentrations <strong>for</strong> the water wells <strong>in</strong> the Mid Valley Estates area, Cedar Valley, Iron County, Utah.<br />
the well stabilized and water-level measurements were taken<br />
dur<strong>in</strong>g the rest <strong>of</strong> the recovery phase <strong>of</strong> the aquifer test and<br />
were used <strong>in</strong> determ<strong>in</strong><strong>in</strong>g the transmissivity <strong>of</strong> the aquifer<br />
near the pump<strong>in</strong>g well. The water level recovered rapidly<br />
then leveled <strong>of</strong>f to a steady rate <strong>of</strong> recovery. The observed<br />
water-level change <strong>in</strong> the well was 55.59 feet (17 m) dur<strong>in</strong>g<br />
the recovery phase <strong>of</strong> the aquifer test (with<strong>in</strong> 5 percent <strong>of</strong> the<br />
drawdown). The recovery data were used only to compare<br />
with the drawdown data.<br />
We analyzed drawdown data from this aquifer test <strong>for</strong><br />
hydrologic characteristics us<strong>in</strong>g standard techniques, <strong>in</strong>clud<strong>in</strong>g<br />
type-curve match<strong>in</strong>g with Moench type curves <strong>for</strong> a<br />
leaky aquifer, and a Cooper-Jacob semilogarithmic approximation<br />
method (Moench, 1985; Cooper and Jacob, 1946).<br />
The Cooper-Jacob method is particularly applicable to data<br />
from production wells because drawdown <strong>in</strong> the well is heavily<br />
dependent on the pump<strong>in</strong>g rate and the well’s radius <strong>of</strong><br />
<strong>in</strong>fluence is small; <strong>in</strong> this situation the Cooper-Jacob approximation<br />
is an appropriate solution to the drawdown curve<br />
(Walton, 1988). If the conf<strong>in</strong><strong>in</strong>g layer leakage is small then<br />
the Cooper-Jacob approximation should produce reliable<br />
results. We used the computer program AQTESOLV <strong>for</strong><br />
W<strong>in</strong>dows (Hydrosolve, 1996) <strong>in</strong> these evaluations. Us<strong>in</strong>g<br />
these methods, we calculated transmissivities <strong>of</strong> 830 square<br />
feet per day (76 m 2 /d) with the Cooper-Jacob approximation,<br />
and 925 square feet per day (85 m 2 /d) with the Moench
32 Utah Geological Survey<br />
method on the drawdown phase data, respectively. However,<br />
the Cooper-Jacob approximation was a very poor fit to a<br />
straight l<strong>in</strong>e, <strong>in</strong>dicat<strong>in</strong>g leakage from the semi-conf<strong>in</strong><strong>in</strong>g<br />
layer. The transmissivity from the Moench method was used<br />
<strong>in</strong> the evaluation <strong>of</strong> <strong>septic</strong>-<strong>tank</strong> densities (figure 22).<br />
Results<br />
As at Hamiltons Fort and Bauers Knoll, we plotted projected<br />
nitrate concentration versus <strong>septic</strong>-<strong>tank</strong> <strong>density</strong> and<br />
number <strong>of</strong> <strong>septic</strong>-<strong>tank</strong> systems <strong>in</strong> the Mid Valley Estates area<br />
<strong>of</strong> Cedar Valley. Because the hydrogeologic sett<strong>in</strong>g <strong>for</strong> Mid<br />
Valley Estates area is unlike the other site-specific <strong>areas</strong>, we<br />
considered a different scenario <strong>for</strong> this region than the other<br />
two wetter <strong>areas</strong> <strong>of</strong> the <strong>valley</strong>. Average background nitrate<br />
concentration <strong>for</strong> the Mid Valley Estates area is 0.66 mg/L<br />
(table 8). Approximately 195 <strong>septic</strong> systems are on record <strong>in</strong><br />
the Mid Valley Estates subdivision area (Southwest Utah<br />
Public Health Department, written communication, 2000).<br />
The Mid Valley Estates area is approximately 650 acres (2.6<br />
km 2 ), so the average exist<strong>in</strong>g <strong>septic</strong>-system <strong>density</strong> is 3.3<br />
acres/system (.013 km 2 /system). Based on the aquifer test<br />
described above (table 6), estimated ground-water flow<br />
available <strong>for</strong> mix<strong>in</strong>g <strong>in</strong> Mid Valley Estates area through a 1-<br />
mile (1.6 km) transect <strong>of</strong> the subdivision area (figure 21) is<br />
0.045 cubic feet per second (0.001 m 3 /s). The amount <strong>of</strong><br />
water <strong>for</strong> dilution <strong>in</strong> this area is considerably lower than the<br />
other two study <strong>areas</strong> and the number <strong>of</strong> <strong>septic</strong>-<strong>tank</strong> systems<br />
considerably greater; the amount <strong>of</strong> flow from <strong>septic</strong>-<strong>tank</strong><br />
systems is almost <strong>three</strong> times the amount from natural flow<br />
(table 9).<br />
We do not believe that the mass-balance approach is<br />
applicable under a scenario <strong>in</strong> which effluent from <strong>septic</strong><strong>tank</strong><br />
systems exceeds ground-water available <strong>for</strong> mix<strong>in</strong>g; it is<br />
a graphical approach <strong>for</strong> determ<strong>in</strong><strong>in</strong>g how many new systems<br />
can be added based on dilution <strong>of</strong> nitrate from effluent by<br />
water, and cannot provide the number <strong>of</strong> systems that should<br />
be removed to reduce the concentration <strong>of</strong> nitrate from effluent<br />
to various levels. There<strong>for</strong>e, we applied the mass-balance<br />
approach <strong>in</strong> a different manner by recalibrat<strong>in</strong>g parameters<br />
<strong>for</strong> the mass-balance equation assum<strong>in</strong>g predevelopment<br />
conditions (that is, beg<strong>in</strong>n<strong>in</strong>g with zero <strong>septic</strong>-<strong>tank</strong> systems),<br />
but us<strong>in</strong>g the current amount <strong>of</strong> water available <strong>for</strong><br />
mix<strong>in</strong>g and a typical background nitrate concentration <strong>of</strong> 0.6<br />
mg/L. This computation shows that, if the mass-balance<br />
approach had been applied prior to development, the recommended<br />
total number <strong>of</strong> <strong>septic</strong> systems <strong>in</strong> this area with negligible<br />
flow, based on a 1 mg/L allowable degradation <strong>of</strong><br />
nitrate concentration from 0.66 to 1.66 mg/L, would be two.<br />
Aquifer Model: Leaky<br />
Solution Method: Moench<br />
Transmissivity = 925 square feet per day<br />
Moench type curve<br />
Figure 22. Mid Valley Estates area, drawdown data plot, Cedar Valley, Iron County, Utah.
Analysis <strong>of</strong> <strong>septic</strong>-<strong>tank</strong> <strong>density</strong>, Cedar Valley, Iron County, Utah<br />
33<br />
Table 9. Ground-water flow available <strong>for</strong> mix<strong>in</strong>g versus amount <strong>of</strong> effluent from <strong>septic</strong> <strong>tank</strong>s <strong>in</strong><br />
Cedar Valley, Iron County, Utah.<br />
Study Area Flow, Q(cfs) Number <strong>of</strong> Septic Tanks Ratio <strong>of</strong> flow to <strong>septic</strong> <strong>tank</strong>s<br />
Hamiltons Fort 15 100 ~240X from Q<br />
Bauers Knoll 0.4 50 ~13X from Q<br />
Mid Valley Estates 0.0045 195 ~3X from <strong>septic</strong> <strong>tank</strong>s<br />
Recommendations <strong>for</strong> Land-Use Plann<strong>in</strong>g<br />
The mass-balance calculation <strong>in</strong>dicates that <strong>in</strong> an area<br />
hav<strong>in</strong>g m<strong>in</strong>imal recharge, such as the Mid Valley Estates<br />
area, the use <strong>of</strong> <strong>septic</strong>-<strong>tank</strong> systems is not advisable. However,<br />
<strong>in</strong> the Mid Valley Estates area, there is an apparent<br />
upward vertical ground-water gradient that provides some<br />
protection to the underly<strong>in</strong>g dr<strong>in</strong>k<strong>in</strong>g-water aquifer. The<br />
mass-balance approach is probably not the best land-use<br />
management tool <strong>in</strong> this scenario. The Mid Valley Estates<br />
area currently has more than the recommended amount <strong>of</strong><br />
<strong>septic</strong> <strong>tank</strong>s already established; <strong>in</strong> order to prevent potential<br />
ground-water contam<strong>in</strong>ation <strong>in</strong>to the aquifer by effluent from<br />
<strong>septic</strong>-<strong>tank</strong> systems, one option is to ma<strong>in</strong>ta<strong>in</strong> this upward<br />
vertical ground-water gradient <strong>in</strong> the aquifer, <strong>in</strong>clud<strong>in</strong>g dur<strong>in</strong>g<br />
pump<strong>in</strong>g <strong>of</strong> the public-supply well located at the eastern<br />
marg<strong>in</strong> <strong>of</strong> the subdivision, as well as other nearby wells.<br />
This option would require agreements regard<strong>in</strong>g pump<strong>in</strong>g<br />
rates and volume extractions <strong>in</strong> the Mid Valley Estates area.<br />
If this option is implemented, we recommend that one or<br />
more monitor<strong>in</strong>g wells completed <strong>in</strong> the upper part <strong>of</strong> the<br />
shallow, unconf<strong>in</strong>ed saturated zone be established with<strong>in</strong> the<br />
area <strong>for</strong> use <strong>in</strong> verify<strong>in</strong>g vertical head-gradient direction and<br />
monitor<strong>in</strong>g it over time. We also recommend evaluat<strong>in</strong>g any<br />
nearby seeps located with<strong>in</strong> 1,000 feet (300 m) <strong>of</strong> the area’s<br />
borders. This distance is based on a local 250-day groundwater<br />
travel time, which is how long some <strong>of</strong> the longer lived<br />
biological contam<strong>in</strong>ants can survive <strong>in</strong> the natural env<strong>iron</strong>ment<br />
and present risk to humans. Perhaps the most beneficial<br />
option is to provide a community sanitary sewer system<br />
to the area and elim<strong>in</strong>ate <strong>septic</strong>-<strong>tank</strong> systems <strong>for</strong> wastewater<br />
disposal.<br />
Discussion<br />
The graphs <strong>of</strong> projected nitrate concentration versus<br />
number <strong>of</strong> <strong>septic</strong>-<strong>tank</strong> systems and <strong>septic</strong>-<strong>tank</strong> <strong>density</strong> <strong>for</strong><br />
each area are summarized <strong>in</strong> table 10. For the Hamiltons<br />
Fort area, the total number <strong>of</strong> <strong>septic</strong> <strong>tank</strong>s can be as great as<br />
760 based on the amount <strong>of</strong> ground water available <strong>for</strong> dilution<br />
and approximately 100 exist<strong>in</strong>g <strong>septic</strong> systems. This<br />
corresponds to a <strong>septic</strong>-<strong>tank</strong> <strong>density</strong> <strong>of</strong> 5.6 acres/system (0.02<br />
km 2 /system). In the Bauers Knoll area, where the amount <strong>of</strong><br />
ground water available <strong>for</strong> mix<strong>in</strong>g and the exist<strong>in</strong>g number <strong>of</strong><br />
<strong>septic</strong>-<strong>tank</strong> systems is lower, the total number <strong>of</strong> <strong>septic</strong> <strong>tank</strong>s<br />
can be as great as 100 or as low as 28 depend<strong>in</strong>g primarily on<br />
the number <strong>of</strong> exist<strong>in</strong>g <strong>septic</strong> systems and the chosen acceptable<br />
level <strong>of</strong> degradation <strong>of</strong> nitrate concentration. This corresponds<br />
to <strong>septic</strong>-<strong>tank</strong> densities <strong>of</strong> 38 and 135 acres/system<br />
(0.44-0.55 km 2 /system), respectively. However, a total <strong>of</strong> 70<br />
<strong>septic</strong>-<strong>tank</strong> systems, correspond<strong>in</strong>g to an allowable <strong>in</strong>crease<br />
<strong>of</strong> 20 new systems and an average <strong>septic</strong>-<strong>tank</strong> <strong>density</strong> <strong>of</strong> 54<br />
acres/system (0.2 km 2 /system), represents <strong>in</strong> our judgement<br />
the result based on the most realistic comb<strong>in</strong>ation <strong>of</strong> variables<br />
applied <strong>in</strong> the calculations (50 currently exist<strong>in</strong>g systems<br />
<strong>in</strong> the approximately 3,800-acre [15.5 km 2 ] area) and an<br />
allowable degradation <strong>of</strong> ground-water quality with respect<br />
to nitrate <strong>of</strong> 1 mg/L.<br />
We do not consider the mass-balance approach to be the<br />
best land-use management tool <strong>for</strong> the Mid Valley Estates<br />
area, where the amount <strong>of</strong> water from <strong>septic</strong>-<strong>tank</strong> effluent is<br />
<strong>three</strong> times more than the ground-water flow available <strong>for</strong><br />
mix<strong>in</strong>g, and the little available evidence <strong>in</strong>dicates that the<br />
aquifer <strong>in</strong> this area may have an upward vertical-head gradient.<br />
Until the area can be connected to a sanitary sewer system,<br />
we recommend verify<strong>in</strong>g that there is an upward vertical<br />
head gradient by establish<strong>in</strong>g one or more monitor<strong>in</strong>g<br />
wells <strong>in</strong>to the shallow, unconf<strong>in</strong>ed saturated zone, manag<strong>in</strong>g<br />
ground-water withdrawals <strong>in</strong> the area to ma<strong>in</strong>ta<strong>in</strong> the upward<br />
vertical-head gradient if it is verified that it exists, and monitor<strong>in</strong>g<br />
seeps to ensure that effluent is not surfac<strong>in</strong>g and present<strong>in</strong>g<br />
a danger <strong>of</strong> microbial contam<strong>in</strong>ation.<br />
The dr<strong>in</strong>k<strong>in</strong>g-water aquifers beneath all <strong>three</strong> study sites<br />
are under conf<strong>in</strong>ed or semi-conf<strong>in</strong>ed conditions due to the<br />
presence <strong>of</strong> relatively thick f<strong>in</strong>e-gra<strong>in</strong>ed layers <strong>in</strong> the bas<strong>in</strong><br />
fill. These f<strong>in</strong>e-gra<strong>in</strong>ed layers may provide some retardation<br />
<strong>of</strong> vertical ground-water movement <strong>in</strong> the mix<strong>in</strong>g zone to<br />
depths from which most ground-water withdrawal from<br />
wells is occurr<strong>in</strong>g. However, the presence <strong>of</strong> nitrate <strong>in</strong> water<br />
from wells sampled <strong>in</strong> the Hamiltons Fort area may be evidence<br />
that water <strong>in</strong> the mix<strong>in</strong>g zone is reach<strong>in</strong>g the aquifer at<br />
depths tapped by domestic water wells. The conf<strong>in</strong><strong>in</strong>g or<br />
semi-conf<strong>in</strong><strong>in</strong>g units <strong>in</strong> this area likely do not attenuate or act<br />
as barriers to the downward movement <strong>of</strong> the <strong>septic</strong>-<strong>tank</strong><br />
effluent. In general, <strong>in</strong>sufficient <strong>in</strong><strong>for</strong>mation about the conf<strong>in</strong><strong>in</strong>g<br />
unit or ground-water gradients <strong>in</strong> the study <strong>areas</strong> exists<br />
to assess the possibility <strong>of</strong> effluent reach<strong>in</strong>g the pr<strong>in</strong>cipal<br />
aquifer, although some evidence <strong>in</strong>dicates there may be an<br />
upward vertical ground-water gradient <strong>in</strong> the Mid Valley<br />
Estates subdivision area at the per<strong>for</strong>ation depth <strong>of</strong> the Angus<br />
Water Company well. In some <strong>areas</strong>, a natural downward<br />
ground-water gradient through the conf<strong>in</strong><strong>in</strong>g units may exist;<br />
under these conditions the conf<strong>in</strong><strong>in</strong>g units may slow the<br />
downward movement <strong>of</strong> the effluent, but not stop it. Heterogeneities<br />
with<strong>in</strong> semi-conf<strong>in</strong><strong>in</strong>g and conf<strong>in</strong><strong>in</strong>g units, such<br />
as a sporadic distribution <strong>of</strong> sand and gravel lenses, may<br />
allow the communication <strong>of</strong> the <strong>septic</strong>-<strong>tank</strong> effluent with the<br />
pr<strong>in</strong>cipal aquifer with<strong>in</strong> a relatively short time. Additionally,<br />
large pump<strong>in</strong>g wells <strong>in</strong> the study <strong>areas</strong> could <strong>in</strong>duce or<br />
<strong>in</strong>crease local downward ground-water gradients and poten-
34 Utah Geological Survey<br />
tially cause movement <strong>of</strong> effluent through the conf<strong>in</strong><strong>in</strong>g unit.<br />
Wells themselves can also provide a path <strong>for</strong> effluent to reach<br />
the aquifer below the mix<strong>in</strong>g zone via the well bore.<br />
Ground-water flow available <strong>for</strong> mix<strong>in</strong>g (table 10) is the<br />
primary factor determ<strong>in</strong><strong>in</strong>g recommended <strong>septic</strong>-system <strong>density</strong>/lot<br />
size us<strong>in</strong>g the mass-balance approach. Due to the<br />
greater amount <strong>of</strong> ground water available <strong>for</strong> mix<strong>in</strong>g <strong>in</strong> the<br />
southeastern area <strong>of</strong> Cedar Valley <strong>in</strong> the Hamiltons Fort area,<br />
a greater number <strong>of</strong> <strong>septic</strong> systems can exist compared to the<br />
southwestern area <strong>of</strong> Cedar Valley <strong>in</strong> the Bauers Knoll area.<br />
Few <strong>septic</strong>-<strong>tank</strong> systems could be established <strong>in</strong> central<br />
Cedar Valley if the mass-balance approach was applied<br />
because <strong>of</strong> very low amounts <strong>of</strong> ground-water available <strong>for</strong><br />
mix<strong>in</strong>g. Because Cedar Valley has an arid climate and a relatively<br />
low rate <strong>of</strong> ground-water recharge, the overall amount<br />
<strong>of</strong> ground water available <strong>for</strong> mix<strong>in</strong>g is relatively low and a<br />
public <strong>valley</strong>-wide sewer system is likely the best alternative<br />
<strong>for</strong> domestic wastewater disposal <strong>in</strong> most situations.<br />
SUMMARY AND CONCLUSIONS<br />
Cedar Valley is a rural area <strong>in</strong> southwestern Utah experienc<strong>in</strong>g<br />
an <strong>in</strong>crease <strong>in</strong> residential development. Much <strong>of</strong> this<br />
development is situated on unconsolidated deposits <strong>of</strong> the<br />
pr<strong>in</strong>cipal <strong>valley</strong>-fill aquifer and uses <strong>septic</strong> <strong>tank</strong> soil-absorption<br />
systems <strong>for</strong> wastewater disposal. Septic <strong>tank</strong> soilabsorption<br />
systems are considered one <strong>of</strong> the major potential<br />
sources <strong>of</strong> water-quality degradation, and public <strong>of</strong>ficials<br />
would like to have a scientific basis <strong>for</strong> determ<strong>in</strong><strong>in</strong>g recommended<br />
densities/lot sizes <strong>for</strong> <strong>septic</strong>-<strong>tank</strong> systems as a landuse<br />
plann<strong>in</strong>g tool. To evaluate the potential impact <strong>of</strong> <strong>septic</strong><strong>tank</strong><br />
systems on ground-water quality and determ<strong>in</strong>e appropriate<br />
average development densities (lot sizes), we per<strong>for</strong>med<br />
site-specific mass-balance-approach evaluations <strong>of</strong><br />
<strong>three</strong> <strong>areas</strong> <strong>in</strong> Cedar Valley; these evaluations can be used as<br />
models <strong>for</strong> other similar evaluations <strong>of</strong> proposed subdivisions<br />
<strong>in</strong> Cedar Valley.<br />
Ground water <strong>in</strong> the Cedar Valley area is obta<strong>in</strong>ed pr<strong>in</strong>cipally<br />
from unconsolidated deposits <strong>of</strong> the bas<strong>in</strong>-fill aquifer<br />
(Thomas and Taylor, 1946; Sandberg, 1966; Bjorklund and<br />
others, 1978) where it occurs under conf<strong>in</strong>ed, unconf<strong>in</strong>ed,<br />
and perched conditions (Bjorklund and others, 1978). The<br />
Quaternary bas<strong>in</strong> fill consists primarily <strong>of</strong> alluvial sediments<br />
<strong>in</strong>terbedded with lava flows and conta<strong>in</strong>s some lacustr<strong>in</strong>e and<br />
eolian deposits (Bjorklund and others, 1978). The bas<strong>in</strong> fill is<br />
estimated to be at least 1,000 feet (300 m) thick (Thomas and<br />
Taylor, 1946; Anderson and Mehnert, 1979), but may be as<br />
much as 3,900 feet (1,200 m) thick <strong>in</strong> the eastern part <strong>of</strong> the<br />
complexly faulted Cedar Valley graben (Cook and Hardman,<br />
1967). The bas<strong>in</strong>-fill aquifer is generally under unconf<strong>in</strong>ed<br />
conditions along the higher elevation marg<strong>in</strong>s <strong>of</strong> Cedar Valley<br />
where it typically consists <strong>of</strong> coarse, granular, permeable<br />
sediments (Bjorklund and others, 1978), but is generally<br />
under conf<strong>in</strong>ed conditions <strong>in</strong> the lower elevation <strong>valley</strong> center<br />
where sediments are typically f<strong>in</strong>er gra<strong>in</strong>ed and less permeable.<br />
Ground-water flow is generally from higher elevation<br />
recharge <strong>areas</strong> to lower elevation discharge <strong>areas</strong>. Most<br />
recharge to the bas<strong>in</strong>-fill aquifer is from precipitation with<strong>in</strong><br />
the Cedar Valley dra<strong>in</strong>age bas<strong>in</strong> (Sandberg, 1966). Ground<br />
water is discharged from spr<strong>in</strong>gs and seeps, evapotranspiration,<br />
wells, and subsurface outflow from the area (Sandberg,<br />
1966), with wells be<strong>in</strong>g the greatest source <strong>of</strong> discharge<br />
(Utah Division <strong>of</strong> Water Resources, 1997). Ground-water<br />
quality <strong>in</strong> Cedar Valley is generally good and, although classified<br />
as hard, is suitable <strong>for</strong> most uses (Utah Division <strong>of</strong><br />
Water Resources, 1995), although nitrate has been identified<br />
as a contam<strong>in</strong>ant <strong>in</strong> previous studies (Joe Mell<strong>in</strong>g, Cedar<br />
City Manager, verbal communication,1997).<br />
We applied the mass-balance approach to <strong>three</strong> <strong>areas</strong> <strong>in</strong><br />
Cedar Valley (the Hamiltons Fort, Bauers Knoll, and Mid<br />
Valley Estates <strong>areas</strong>) us<strong>in</strong>g ground-water flow available <strong>for</strong><br />
mix<strong>in</strong>g and ground-water-quality data unique to each area to<br />
help determ<strong>in</strong>e recommended <strong>septic</strong>-system <strong>density</strong>/lot size.<br />
Ground water <strong>in</strong> the Hamiltons Fort area occurs under mostly<br />
leaky conf<strong>in</strong>ed conditions <strong>in</strong> unconsolidated bas<strong>in</strong>-fill<br />
deposits. Ground-water-flow direction <strong>in</strong> the Hamiltons Fort<br />
area is generally to the east, toward Quichapa Lake. Nitrate<br />
values from ground water <strong>in</strong> 14 sampled wells range from 0.1<br />
to 7.46 mg/L, with an average nitrate concentration <strong>of</strong> 2.15<br />
mg/L. We used a 48-hour, multiple-well, constant-dischargerate<br />
aquifer test and analyzed the drawdown data us<strong>in</strong>g the<br />
Hantush type curves to calculate a transmissivity <strong>of</strong> 20,894<br />
square feet per day (1,932 m 2 /d). For our most realistic<br />
scenario, we use an exist<strong>in</strong>g number <strong>of</strong> 100 <strong>septic</strong> systems<br />
and a background nitrate concentration <strong>of</strong> 2.15 mg/L. Estimated<br />
ground-water flow available <strong>for</strong> mix<strong>in</strong>g through a 3.5-<br />
mile (5.6 km) transect <strong>in</strong> the lower reaches <strong>of</strong> the alluvial fan<br />
<strong>in</strong> the area is 15 cubic feet per second (0.42 m 3 /s). For the<br />
Table 10. Results <strong>of</strong> <strong>septic</strong>-<strong>tank</strong> <strong>density</strong> calculations <strong>for</strong> Hamiltons Fort, Bauers Knoll, and Mid Valley Estates study <strong>areas</strong>,<br />
Cedar Valley, Iron County, Utah (Nbmt*- not the best management tool) (Q* is the volume <strong>of</strong> water available <strong>for</strong> mix<strong>in</strong>g).<br />
Study Area Acre/System # Septic Tanks New Lots Q*<br />
Hamilton’s Fort ~5.6 760 660 15cfs<br />
Bauers Knoll ~54 70 20 0.4cfs<br />
(nitrate 1.49 mg/L)<br />
(nitrate 3.15 mg/L) ~38 100 50 0.4 cfs<br />
Mid Valley Estates nbmt* 195 — 0.045 cfs
Analysis <strong>of</strong> <strong>septic</strong>-<strong>tank</strong> <strong>density</strong>, Cedar Valley, Iron County, Utah<br />
Hamiltons Fort area to ma<strong>in</strong>ta<strong>in</strong> an overall nitrate concentration<br />
<strong>of</strong> 3.15 mg/L, the total number <strong>of</strong> homes us<strong>in</strong>g <strong>septic</strong><br />
<strong>tank</strong> soil-absorption systems should not exceed about 760<br />
based on the best-estimate nitrogen load <strong>of</strong> 40 mg/L per <strong>septic</strong>-<strong>tank</strong><br />
system (figure 12). This corresponds to an <strong>in</strong>crease<br />
<strong>of</strong> approximately 660 <strong>septic</strong> systems and an average <strong>septic</strong>system<br />
<strong>density</strong> <strong>of</strong> about 5.6 acres/system (0.02 km 2 /system).<br />
Ground water <strong>in</strong> the Bauers Knoll area east <strong>of</strong> the Eightmile<br />
Hills occurs primarily under conf<strong>in</strong>ed conditions <strong>in</strong><br />
unconsolidated bas<strong>in</strong>-fill deposits (Bjorklund and others,<br />
1978). Ground water flow is generally from the higher elevation<br />
recharge <strong>areas</strong> to lower elevation <strong>areas</strong> and then to the<br />
north, toward Iron Spr<strong>in</strong>gs Gap. Nitrate values <strong>in</strong> ground<br />
water from 10 sampled wells range from 0.2 to 0.8 mg/L<br />
(0.2-0.8 ppm), with an average nitrate concentration <strong>of</strong> 0.49<br />
mg/L. We used a 24-hour, s<strong>in</strong>gle-well, constant-dischargerate<br />
aquifer test and analyzed the drawdown data us<strong>in</strong>g the<br />
Cooper-Jacob semilogarithmic approximation methods to<br />
calculate a transmissivity <strong>of</strong> 3,148 square feet per day (291<br />
m 2 /d). For our most realistic scenario, we use an exist<strong>in</strong>g<br />
number <strong>of</strong> 50 <strong>septic</strong> systems and a background nitrate concentration<br />
0.49 mg/L. Estimated ground-water flow available<br />
<strong>for</strong> mix<strong>in</strong>g through a 2.3-mile (3.7 km) transect <strong>in</strong> the<br />
area is 0.4 cubic feet per second (0.01 m 3 /s). For the Bauers<br />
Knoll area to ma<strong>in</strong>ta<strong>in</strong> an overall nitrate concentration <strong>of</strong><br />
1.49 mg/L, the number <strong>of</strong> <strong>septic</strong> <strong>tank</strong> soil-absorption systems<br />
should not exceed about 70 based on the best-estimate nitrogen<br />
load <strong>of</strong> 40 mg/L per <strong>septic</strong>-<strong>tank</strong> system (figure 18). This<br />
corresponds to an <strong>in</strong>crease <strong>of</strong> approximately 20 <strong>septic</strong> systems<br />
and an average <strong>septic</strong>-system <strong>density</strong> <strong>of</strong> about 54<br />
acres/system (0.2 km 2 /system). Septic-system <strong>density</strong> could<br />
be <strong>in</strong>creased if higher levels <strong>of</strong> water quality degradation<br />
were deemed acceptable.<br />
Ground water <strong>in</strong> the Mid Valley Estates subdivision area<br />
occurs primarily under conf<strong>in</strong>ed conditions <strong>in</strong> unconsolidated<br />
bas<strong>in</strong>-fill deposits (Bjorklund and others, 1978), and the<br />
little available evidence <strong>in</strong>dicates that there may be an upward<br />
vertical ground-water gradient at the depths from<br />
which dr<strong>in</strong>k<strong>in</strong>g water is withdrawn <strong>in</strong> this area. Groundwater<br />
flow is generally from the higher elevation recharge<br />
<strong>areas</strong> northward to lower elevation <strong>areas</strong>. Nitrate values<br />
from two sampled wells are 0.6 and 0.72 mg/L, with an<br />
average nitrate concentration <strong>of</strong> 0.66 mg/L. We used a 19-<br />
hour, s<strong>in</strong>gle-well, constant-discharge-rate aquifer test and<br />
analyzed drawdown data us<strong>in</strong>g Moench type curves <strong>for</strong> a<br />
leaky aquifer to calculate a transmissivity <strong>of</strong> 925 square feet<br />
per day (85 m 2 /d). Ground-water flow available <strong>for</strong> mix<strong>in</strong>g<br />
<strong>in</strong> the Mid Valley Estates subdivision is considerably lower<br />
than <strong>in</strong> the Hamiltons Fort and Bauers Knoll <strong>areas</strong>. Exist<strong>in</strong>g<br />
<strong>septic</strong>-<strong>tank</strong> systems are produc<strong>in</strong>g <strong>three</strong> times more water<br />
than natural ground-water flow available <strong>for</strong> mix<strong>in</strong>g. The<br />
area is already produc<strong>in</strong>g more <strong>septic</strong>-<strong>tank</strong> effluent than can<br />
effectively be diluted and there is an apparent upward vertical-head<br />
gradient, there<strong>for</strong>e the mass-balance approach is not<br />
the best management tool to be applied <strong>in</strong> this area. We recommend<br />
verify<strong>in</strong>g that there is an upward vertical-head gradient<br />
by establish<strong>in</strong>g one or more monitor<strong>in</strong>g wells <strong>in</strong> the<br />
shallow, unconf<strong>in</strong>ed saturated zone, manag<strong>in</strong>g ground-water<br />
withdrawals <strong>in</strong> the area to ma<strong>in</strong>ta<strong>in</strong> the upward vertical-head<br />
gradient if it is verified that it exists, and monitor<strong>in</strong>g seeps to<br />
ensure that effluent is not surfac<strong>in</strong>g and present<strong>in</strong>g a danger<br />
<strong>of</strong> microbial contam<strong>in</strong>ation until the area can be connected to<br />
a sanitary sewer system.<br />
Ground-water flow available <strong>for</strong> mix<strong>in</strong>g is the primary<br />
factor determ<strong>in</strong><strong>in</strong>g recommended <strong>septic</strong>-system <strong>density</strong>/lot<br />
size us<strong>in</strong>g the mass-balance approach. Due to the greater<br />
amount <strong>of</strong> ground-water available <strong>for</strong> mix<strong>in</strong>g <strong>in</strong> the southeastern<br />
part <strong>of</strong> Cedar Valley <strong>in</strong> the Hamiltons Fort area, a<br />
greater number <strong>of</strong> <strong>septic</strong> systems can exist there than <strong>in</strong> the<br />
southwestern and central parts <strong>of</strong> Cedar Valley <strong>in</strong> the Bauers<br />
Knoll and Mid Valley Estates <strong>areas</strong>. However, because<br />
Cedar Valley is an arid area hav<strong>in</strong>g relatively low groundwater<br />
recharge, overall ground-water flow available <strong>for</strong> mix<strong>in</strong>g<br />
is relatively small and a public <strong>valley</strong>-wide sewer system<br />
is likely the best alternative <strong>for</strong> domestic wastewater disposal<br />
<strong>in</strong> most situations.<br />
ACKNOWLEDGMENTS<br />
This project was funded by a U.S. Env<strong>iron</strong>mental Protection<br />
Agency Regional Geographic Initiative grant and the<br />
Iron County Commission. Rich Muza, Denver <strong>of</strong>fice <strong>of</strong> the<br />
EPA Region 8, was <strong>in</strong>strumental <strong>in</strong> help<strong>in</strong>g to secure fund<strong>in</strong>g.<br />
Critical review and comments were provided by: Mike<br />
Hylland, Utah Geological Survey; Jim Mason, U.S. Geological<br />
Survey; Dallas Wall, Utah Division <strong>of</strong> Water Resources;<br />
Scott Hack<strong>in</strong>g, Utah Department <strong>of</strong> Env<strong>iron</strong>mental Quality;<br />
Steve Platt, Iron County; Sue F<strong>in</strong>stick, Bulloch Brothers<br />
Eng<strong>in</strong>eer<strong>in</strong>g; Wayne Thomas, Central Iron Water Conservancy<br />
District; Rob Kostalek, Southwest Public Health; Rich<br />
Muza, U.S. EPA; Dan Aubrey, Utah Division <strong>of</strong> Water<br />
Resources; Scott Wilson, Central Iron Water Conservancy<br />
District; and Joe Mell<strong>in</strong>g, Cedar City. We thank Basia Matyjasik<br />
and Alison Corey, Utah Geological Survey, <strong>for</strong> prepar<strong>in</strong>g<br />
the figures and maps <strong>for</strong> this publication.<br />
35
36 Utah Geological Survey<br />
REFERENCES<br />
am Ende, B.A., 1991, Depositional env<strong>iron</strong>ments, palynology,<br />
and age <strong>of</strong> the Dakota Formation, south-central Utah, <strong>in</strong><br />
Nations, J.D., and Eaton, J.G., editors, Stratigraphy, depositional<br />
env<strong>iron</strong>ments, and sedimentary tectonics <strong>of</strong> the<br />
western marg<strong>in</strong>, Cretaceous Western Interior Seaway: Geological<br />
Society <strong>of</strong> America Special Paper 260, p. 65-83.<br />
Anderson, R.E., 1980, The status <strong>of</strong> seismotectonic studies <strong>of</strong><br />
southwestern Utah: U.S. Geological Survey Open-File<br />
Report 80-801, p. 519-547.<br />
Anderson, R.E., and Christenson, G.E., 1989, Quaternary faults,<br />
folds, and selected volcanic features <strong>in</strong> the Cedar City 1° x<br />
2° quadrangle, Utah: Utah Geological and M<strong>in</strong>eral Survey<br />
Miscellaneous Publication 89-6, 29 p.<br />
Anderson, R.E., and Mehnert, H.H., 1979, Re<strong>in</strong>terpretation <strong>of</strong><br />
the history <strong>of</strong> the Hurricane fault <strong>in</strong> Utah: Bas<strong>in</strong> and Range<br />
Symposium, Rocky Mounta<strong>in</strong> Association <strong>of</strong> Geologists, p.<br />
145-165.<br />
Ashcr<strong>of</strong>t, G.L., Jensen, D.T., and Brown, J.L., 1992, Utah climate:<br />
Utah Climate Center, 31 p.<br />
Averitt, Paul, 1962, Geology and coal resources <strong>of</strong> the Cedar<br />
Mounta<strong>in</strong> quadrangle, Iron County, Utah: U.S. Geological<br />
Survey Pr<strong>of</strong>essional Paper 389, 72 p.<br />
—1967, Geologic map <strong>of</strong> the Kanarraville quadrangle, Iron<br />
County, Utah: U.S. Geological Survey Geological Quadrangle<br />
Map GQ-694, scale 1:24,000.<br />
Averitt, Paul, and Threet, R.L., 1973, Geologic map <strong>of</strong> the<br />
Cedar City quadrangle, Iron County, Utah: U.S. Geological<br />
Survey Geological Quadrangle Map GQ-1120, scale<br />
1:24,000.<br />
Barnett, J.A., and Mayo, F.M., 1966, Ground-water conditions<br />
and related water adm<strong>in</strong>istration problems <strong>in</strong> Cedar City<br />
Valley, Iron County, Utah: Utah State Eng<strong>in</strong>eer In<strong>for</strong>mation<br />
Bullet<strong>in</strong> No. 15, 21 p.<br />
Bauman, B.J., and Schafer, W.M., 1984, Estimat<strong>in</strong>g groundwater<br />
quality impacts from on-site sewage treatment systems,<br />
<strong>in</strong> Proceed<strong>in</strong>gs <strong>of</strong> the Fourth National Symposium on<br />
Individual and Small Community Sewage Systems: American<br />
Society <strong>of</strong> Agricultural Eng<strong>in</strong>eers Publication 07-85, p.<br />
285-294.<br />
Bjorklund, L.J., Sumsion, C.T., and Sandberg, G.W., 1977,<br />
Selected hydrologic data, Parowan Valley and Cedar City<br />
Valley dra<strong>in</strong>age bas<strong>in</strong>s, Iron County, Utah: Utah State Eng<strong>in</strong>eer<br />
Utah Basic-Data Release No. 28, 55 p.<br />
—1978, Ground-water resources <strong>of</strong> the Parowan-Cedar City<br />
dra<strong>in</strong>age bas<strong>in</strong>, Iron County, Utah: Utah Department <strong>of</strong><br />
Natural Resources Technical Publication No. 60, 93 p.,<br />
scale 1:250,000.<br />
Blank, H.R., Jr., and Mack<strong>in</strong>, J.H., 1967, Geologic <strong>in</strong>terpretation<br />
<strong>of</strong> an aeromagnetic survey <strong>of</strong> the Iron Spr<strong>in</strong>gs district,<br />
Utah: U.S. Geological Survey Pr<strong>of</strong>essional Paper 516-B,<br />
14 p., scale 1:48,000.<br />
Conner, J., Mitchell, C. and others, 1958, A compilation <strong>of</strong><br />
chemical quality data <strong>for</strong> ground and surface waters <strong>in</strong><br />
Utah: Utah State Eng<strong>in</strong>eer Technical Publication No. 10,<br />
276 p.<br />
Cook, K.L., and Hardman, E., 1967, Regional gravity survey <strong>of</strong><br />
the Hurricane fault area and Iron Spr<strong>in</strong>gs district, Utah:<br />
Geological Society <strong>of</strong> America Bullet<strong>in</strong>, v. 78, p. 1063-<br />
1076.<br />
Cooper, H.H., and Jacob, C.E., 1946, A generalized graphic<br />
method <strong>for</strong> evaluat<strong>in</strong>g <strong>for</strong>mation constants and summariz<strong>in</strong>g<br />
well field history: American Geophysical Union Transactions,<br />
v. 27, p. 526-534.<br />
Deese, P.L., 1986, An evaluation <strong>of</strong> <strong>septic</strong> leachate detection:<br />
U.S. Env<strong>iron</strong>mental Protection Agency Project Summary<br />
EPA/600/52-86/052, 2 p.<br />
Demographic and Economic Analysis Section, 1998, Utah data<br />
guide, w<strong>in</strong>ter 1998: Salt Lake City, Utah Governor’s Office<br />
<strong>of</strong> Plann<strong>in</strong>g and Budget, 16 p.<br />
—1999, Utah data guide, w<strong>in</strong>ter 1999: Salt Lake City, Utah<br />
Governor’s Office <strong>of</strong> Plann<strong>in</strong>g and Budget, 12 p.<br />
Doell<strong>in</strong>g, H.H, and Davis, F.D., 1989, The geology <strong>of</strong> Kane<br />
County, Utah: Utah Geological and M<strong>in</strong>eral Survey Bullet<strong>in</strong><br />
124, 192 p.<br />
Dutton, C.E., 1880, Report on the geology <strong>of</strong> the high plateaus<br />
<strong>of</strong> Utah: U.S. Geographical and Geological Survey <strong>of</strong> the<br />
Rocky Mounta<strong>in</strong> Region (Powell), 307 p.<br />
Eaton, J.G., 1991, Biostratigraphic framework <strong>of</strong> the Upper<br />
Cretaceous rocks <strong>of</strong> the Kaiparowits Plateau, southern<br />
Utah, <strong>in</strong> Nations, J.D., and Eaton, J.G., editors, Stratigraphy,<br />
depositional env<strong>iron</strong>ments, and sedimentary tectonics<br />
<strong>of</strong> the western marg<strong>in</strong>, Cretaceous Western Interior Seaway:<br />
Geological Society <strong>of</strong> America Special Paper 260, p.<br />
47-63.<br />
Epp<strong>in</strong>ger, R.G., W<strong>in</strong>kler, G.R., Cookro, T.M., Shubat, M.A.,<br />
Blank, H.R., Crowley, J.K., Kucks, R.P., and Jones, J.L.,<br />
1990, Prelim<strong>in</strong>ary assessment <strong>of</strong> the m<strong>in</strong>eral resources <strong>of</strong><br />
the Cedar City 1° x 2° quadrangle, Utah: U.S. Geological<br />
Survey Open-File Report 90-34, 146 p., scale 1:250,000.<br />
Fetter, C.W., Jr., 1980, Applied hydrogeology: Columbus,<br />
Ohio, Charles E. Merrill Publish<strong>in</strong>g Company, 488 p.<br />
Franks, A.L., 1972, Geology <strong>for</strong> <strong>in</strong>dividual sewage disposal systems:<br />
Cali<strong>for</strong>nia Geology, v. 25, no. 9, p. 195-203.<br />
Gilbert, G.K., 1875, Report on the geology <strong>of</strong> portions <strong>of</strong> Nevada,<br />
Utah, Cali<strong>for</strong>nia, and Arizona exam<strong>in</strong>ed <strong>in</strong> the years<br />
1871 and 1872: U.S. Geographical and Geological Surveys<br />
West 100th Meridian Report, v. 3, p. 17-187.<br />
Hambl<strong>in</strong>, W.K., 1970, Structure <strong>of</strong> the western Grand Canyon<br />
region, <strong>in</strong> Hambl<strong>in</strong>, W.K., and Best, M.G., editors, The<br />
western Grand Canyon region: Salt Lake City, Utah Geological<br />
Society Guidebook to the Geology <strong>of</strong> Utah, no. 23,<br />
p. 21-37.<br />
—1984, Direction <strong>of</strong> absolute movement along the boundary<br />
faults <strong>of</strong> the Bas<strong>in</strong> and Range Colorado Plateau marg<strong>in</strong>:<br />
Geology, v. 12, p. 116-119.<br />
Hansen, Allen, and Luce, Inc., 1994, Hydrogeologic/water quality<br />
study, Wasatch County, Utah: Salt Lake City, unpublished<br />
consultant’s report, p. III-1 - III-18.<br />
Hantush, M.S., 1960, Modification <strong>of</strong> the theory <strong>of</strong> leaky<br />
aquifers: Journal <strong>of</strong> Geophysical Research, v. 65, no. 11, p.<br />
3713-3725.<br />
H<strong>in</strong>tze, L.F., 1988, 2nd ed., Geologic history <strong>of</strong> Utah: Brigham<br />
Young University Geology Studies Special Publication 7,<br />
202 p.<br />
Howell, E.E., 1875, Report on the geology <strong>of</strong> portions <strong>of</strong> Utah,<br />
Nevada, Arizona, and New Mexico: U.S. Geographical and<br />
Geological Survey West <strong>of</strong> 100th Meridian Report, v. 3, p.<br />
227-301.<br />
Hunt<strong>in</strong>gton, E., and Goldthwait, J.W., 1904, The Hurricane fault<br />
<strong>in</strong> the Toquerville district, Utah: Harvard University, Museum<br />
<strong>of</strong> Comparative Zoology Bullet<strong>in</strong>, v. 42, Geological<br />
Series, v. 6, no. 5, p. 199-259.<br />
Hurlow, H.A., 1998, The geology <strong>of</strong> the central Virg<strong>in</strong> River
Analysis <strong>of</strong> <strong>septic</strong>-<strong>tank</strong> <strong>density</strong>, Cedar Valley, Iron County, Utah<br />
bas<strong>in</strong>, southwestern Utah, and its relation to ground-water<br />
conditions: Utah Geological Survey Water-Resources Bullet<strong>in</strong><br />
26, 53 p., 7 pl., scale 1:48,000 and 1:100,000.<br />
Hydrosolve, Inc., 1996, User’s guide, AQTESOLV <strong>for</strong> W<strong>in</strong>dows:<br />
Reston, Virg<strong>in</strong>ia, Hydrosolve, Inc., variously pag<strong>in</strong>ated.<br />
Kurie, A.E., 1966, Recurrent structural disturbance <strong>of</strong> Colorado<br />
Plateau marg<strong>in</strong> near Zion National Park, Utah: Geological<br />
Society <strong>of</strong> America Bullet<strong>in</strong>, v. 77, p. 867-872.<br />
Lee, W.T., 1907, The Iron County coal field: U.S. Geological<br />
Survey Bullet<strong>in</strong> 316-E, p. 359 375.<br />
Leith, C.K., and Harder, E.C., 1908, The <strong>iron</strong> ores <strong>of</strong> the Iron<br />
Spr<strong>in</strong>gs district, southern Utah: U.S. Geological Survey<br />
Bullet<strong>in</strong> 338, 102 p.<br />
Lowe Mike, and Wallace, Janae, 1997, The hydrogeology <strong>of</strong><br />
Ogden Valley, Weber County, Utah, and potential implications<br />
<strong>of</strong> <strong>in</strong>creased <strong>septic</strong>-<strong>tank</strong> soil-absorption system <strong>density</strong>:<br />
Geological Society <strong>of</strong> America Abstracts with Programs,<br />
v. 29, no. 6, p. A-386.<br />
—1999a, A mass-balance approach <strong>for</strong> us<strong>in</strong>g nitrate load<strong>in</strong>g to<br />
recommend <strong>septic</strong>-<strong>tank</strong> system <strong>density</strong>/lot size--<strong>three</strong> Utah<br />
examples: Association <strong>of</strong> Eng<strong>in</strong>eer<strong>in</strong>g Geologists 42nd<br />
Annual Meet<strong>in</strong>g Program with Abstracts, Salt Lake City,<br />
Utah, p. 75.<br />
—1999b, The hydrogeology <strong>of</strong> Ogden Valley, Weber County,<br />
Utah, and recommended waste water management practices<br />
to protect ground-water quality, <strong>in</strong> Spangler, L.E., and<br />
Allen, C.J., editors, Geology <strong>of</strong> northern Utah and vic<strong>in</strong>ity:<br />
Utah Geological Association Publication 27, p. 313-336.<br />
Lowe, Mike, Wallace, Janae, Snyder, N.P., and Bishop, C.E.,<br />
1999, Recharge and discharge <strong>areas</strong> <strong>for</strong> several <strong>valley</strong>-fill<br />
aquifers <strong>in</strong> Utah, and their relation to non-po<strong>in</strong>t-source contam<strong>in</strong>ation:<br />
Association <strong>of</strong> Eng<strong>in</strong>eer<strong>in</strong>g Geologists 42nd<br />
Annual Meet<strong>in</strong>g Program with Abstracts, Salt Lake City,<br />
Utah, p. 75.<br />
Mack<strong>in</strong>, J.H., 1960, Structural significance <strong>of</strong> Tertiary volcanic<br />
rocks <strong>in</strong> southwestern Utah: American Journal <strong>of</strong> Science,<br />
v. 258, p. 81-131.<br />
Mack<strong>in</strong>, J.H., Nelson, W.H., and Rowley, P.D., 1976, Geologic<br />
map <strong>of</strong> the Cedar City NW quadrangle, Iron County, Utah:<br />
U.S. Geological Survey Geologic Quadrangle Map GQ<br />
1295, scale 1:24,000.<br />
Mack<strong>in</strong>, J.H., and Rowley, P.D., 1976, Geologic map <strong>of</strong> the<br />
Three Peaks quadrangle, Iron County, Utah: U.S. Geological<br />
Survey Geologic Quadrangle Map GQ-1297, scale<br />
1:24,000.<br />
Maldonado, Florian, and Moore D.W., 1993, Prelim<strong>in</strong>ary geologic<br />
map <strong>of</strong> the Parowan quadrangle, Iron County, Utah:<br />
U.S. Geological Survey Open-File Report 93-3, scale<br />
1:24,000.<br />
Maldonado, Florian, Sable, E.G., and Nealey, L.D., 1997, Cenozoic<br />
low-angle faults, and anastomos<strong>in</strong>g high-angle faults,<br />
western Markagunt Plateau, Southwestern Utah, <strong>in</strong> Madonado,<br />
Florian, and Nealey, L.D., editors, Geologic studies <strong>in</strong><br />
the Bas<strong>in</strong> and Range Colorado Plateau Transition <strong>in</strong> southeastern<br />
Nevada, southwestern Utah, and northwestern Arizona,<br />
1995: U.S. Geological Survey Bullet<strong>in</strong> 2153, p. 129-<br />
149, scale 1:100,000.<br />
Maldonado, Florian, and Williams, V.S., 1993a, Geologic map<br />
<strong>of</strong> the Parowan Gap quadrangle, Iron County, Utah: U.S.<br />
Geological Survey Geologic Quadrangle Map GQ-1712,<br />
scale 1:24,000.<br />
—1993b, Geologic map <strong>of</strong> the Paragonah quadrangle, Iron<br />
County, Utah: U.S. Geological Survey Geologic Quadrangle<br />
Map GQ-1713, scale 1:24,000.<br />
Me<strong>in</strong>zer, O.E., 1911, Ground water <strong>in</strong> Juab, Millard, and Iron<br />
Counties, Utah: U.S. Geological Survey Water-Supply<br />
Paper 277, 162 p.<br />
Moench, A.F., 1985, Transient flow to a large-diameter well <strong>in</strong><br />
an aquifer with storative semiconf<strong>in</strong><strong>in</strong>g layers: Water<br />
Resources Research, v. 21, no. 8, p. 1121-1131.<br />
Montana Department <strong>of</strong> Env<strong>iron</strong>mental Quality, 1996, Mix<strong>in</strong>g<br />
zones <strong>in</strong> surface and ground water: Helena, Montana, Water<br />
Quality Standards, Adm<strong>in</strong>istrative Rules <strong>of</strong> Montana,<br />
Montana Department <strong>of</strong> Env<strong>iron</strong>mental Quality, p. 17-2651<br />
- 17-2691.<br />
Montgomery, S.B., 1980, Cedar City test well drill<strong>in</strong>g <strong>for</strong> Navajo<br />
Sandstone groundwater development: Salt Lake City,<br />
unpublished Utah Division <strong>of</strong> Water Resources Memorandum,<br />
3 p.<br />
Moore, D.W., and Nealey, L.D., 1993, Prelim<strong>in</strong>ary geologic<br />
map <strong>of</strong> Navajo Lake quadrangle, Kane and Iron Counties,<br />
Utah: U.S. Geological Survey Open-File Report 93-190,<br />
16 p., scale 1:24,000.<br />
Neuman, S.P., 1974, Effect <strong>of</strong> partial penetration on flow <strong>in</strong><br />
unconf<strong>in</strong>ed aquifers consider<strong>in</strong>g delayed gravity response:<br />
Water Resources Research, v. 10, no. 2, p. 303-312.<br />
Pear<strong>three</strong>, P.A., Lund, W.R., Stenner, H.D., and Everitt, B.L.,<br />
1998, Paleoseismic <strong>in</strong>vestigations <strong>of</strong> the Hurricane fault <strong>in</strong><br />
southwestern Utah and northern Arizona: F<strong>in</strong>al technical<br />
report to the U.S. Geological Survey National Earthquake<br />
Hazards Reduction Program, Award No. 1434-HQ-97-GR-<br />
03047, 131 p.<br />
Powell, J.W., 1879, Report on the lands <strong>of</strong> the arid region <strong>of</strong> the<br />
United States, with a more detailed account <strong>of</strong> the lands <strong>of</strong><br />
Utah: U.S. Geographical and Geological Survey Rocky<br />
Mounta<strong>in</strong> Region Report, 195 p.<br />
Quilter, M.C., 1996, UDA State Ground-Water Program 1996<br />
summary report: Salt Lake City, unpublished Utah Department<br />
<strong>of</strong> Agriculture and Food report, 53 p.<br />
Richardson, G.B., 1909, The Harmony, Kolob, and Kanab coal<br />
fields, southern Utah: U.S. Geological Survey Bullet<strong>in</strong><br />
341-C, p. 379-400.<br />
Rowley, P.D., 1975, Geologic map <strong>of</strong> the Enoch NE quadrangle,<br />
Iron County, Utah: U.S. Geological Survey Geologic<br />
Quadrangle Map GQ-1301, scale 1:24,000.<br />
—1976, Geologic map <strong>of</strong> the Enoch NW quadrangle, Iron<br />
County, Utah: U.S. Geological Survey Geologic Quadrangle<br />
Map GQ-1302, scale 1:24,000.<br />
—1978, Geologic map <strong>of</strong> the Thermo 15-m<strong>in</strong>ute quadrangle,<br />
Beaver and Iron Counties, Utah: U.S. Geological Survey<br />
Geologic Quadrangle Map GQ-1493, scale 1:62,500.<br />
Rowley, P.D., Anderson, J.J., Williams, P.L., and Fleck, R.J.,<br />
1978, Age <strong>of</strong> structural differentiation between the Colorado<br />
Plateaus and Bas<strong>in</strong> and Range prov<strong>in</strong>ces <strong>in</strong> southwestern<br />
Utah: Geology, v. 6., p. 51-55.<br />
Rowley, P.D., and Threet, R.L., 1976, Geologic map <strong>of</strong> the<br />
Enoch quadrangle, Iron County, Utah: U.S. Geological Survey<br />
Geologic Quadrangle Map GQ-1296, scale 1:24,000.<br />
Sandberg, G.W., 1963, Ground-water data, Beaver, Escalante,<br />
Cedar City, and Parowan Valleys, parts <strong>of</strong> Wash<strong>in</strong>gton,<br />
Iron, Beaver, and Millard Counties, Utah: Utah State Eng<strong>in</strong>eer<br />
Basic-Data Report No. 6, 26 p.<br />
—1966, Ground-water resources <strong>of</strong> selected bas<strong>in</strong>s <strong>in</strong> southwestern<br />
Utah: Utah State Eng<strong>in</strong>eer Technical Publication 13, 43 p.<br />
Steiger, J.I., and Lowe, Mike, 1997, Recharge and discharge<br />
<strong>areas</strong> and quality <strong>of</strong> ground water <strong>in</strong> Tooele Valley, Tooele<br />
37
38 Utah Geological Survey<br />
County, Utah: U.S. Geological Survey Water Resources<br />
Investigations Report 97-4005, 2 plates, scale 1:100,000.<br />
Steven, T.A., Morris, H.T., and Rowley, P.D., 1990, Geologic<br />
map <strong>of</strong> the Richfield 1° x 2° quadrangle, west-central Utah:<br />
U.S. Geological Survey Geologic Quadrangle Map I-1901,<br />
scale 1:250,000.<br />
Stewart, J.H., Poole, F.G., and Wilson, R.F., 1972a, Stratigraphy<br />
and orig<strong>in</strong> <strong>of</strong> the Ch<strong>in</strong>le Formation and related Upper Triassic<br />
strata <strong>in</strong> the Colorado Plateau region: U.S. Geological<br />
Survey Pr<strong>of</strong>essional Paper 690, 336 p.<br />
—1972b, Stratigraphy and orig<strong>in</strong> <strong>of</strong> the Triassic Moenkopi Formation<br />
and related strata <strong>in</strong> the Colorado Plateau region:<br />
U.S. Geological Survey Pr<strong>of</strong>essional Paper 691, 195 p.<br />
Stokes, W.L., 1977, Subdivisions <strong>of</strong> the major physiographic<br />
prov<strong>in</strong>ces <strong>in</strong> Utah: Utah Geology, v. 4, no. 1, p. 1-17.<br />
Theis, C.V., 1935, The relation between the lower<strong>in</strong>g <strong>of</strong> the<br />
piezometric surface and the rate and duration <strong>of</strong> discharge<br />
<strong>of</strong> a well us<strong>in</strong>g groundwater storage: American Geophysical<br />
Union Transactions, v. 16, p. 519-524.<br />
Thomas, H.E., Nelson, W.B., L<strong>of</strong>gren, B.E., and Butler, R.G.,<br />
1952, Status <strong>of</strong> development <strong>of</strong> selected ground-water<br />
bas<strong>in</strong>s <strong>in</strong> Utah: Utah State Eng<strong>in</strong>eer Technical Publication<br />
7, p. 22 34.<br />
Thomas, H.E., and Taylor, G.H., 1946, Geology and groundwater<br />
resources <strong>of</strong> Cedar City and Parowan Valleys, Iron<br />
County, Utah: U.S. Geological Survey Water-Supply Paper<br />
993, 210 p.<br />
Threet, R.L., 1963, Structure <strong>of</strong> the Colorado Plateau marg<strong>in</strong><br />
near Cedar City, Utah, <strong>in</strong> Guidebook to the geology <strong>of</strong><br />
southwestern Utah: Intermounta<strong>in</strong> Association <strong>of</strong> Petroleum<br />
Geologists, p. 104-117.<br />
U.S. Env<strong>iron</strong>mental Protection Agency, 1987, Guidel<strong>in</strong>es <strong>for</strong><br />
del<strong>in</strong>eation <strong>of</strong> wellhead protection <strong>areas</strong>: U.S. Env<strong>iron</strong>mental<br />
Protection Agency document no. EPA 440/6-87-<br />
010, 114 p.<br />
Utah Division <strong>of</strong> Water Resources, 1995, Utah state water plan,<br />
Cedar/Beaver bas<strong>in</strong>: Salt Lake City, Utah Department <strong>of</strong><br />
Natural Resources, variously pag<strong>in</strong>ated.<br />
—1997, Ground-water conditions <strong>in</strong> Utah: Salt Lake City, Utah<br />
Department <strong>of</strong> Natural Resources, p. 72-77.<br />
Utah Division <strong>of</strong> Water Rights, 1980, Water use report: Salt<br />
Lake City, Utah Department <strong>of</strong> Natural Resources, p. 36-37.<br />
—1995, Water use report: Salt Lake City, Utah Department <strong>of</strong><br />
Natural Resources, p. 15.<br />
Wallace, Janae, and Lowe, Mike, 1998a, The potential impact <strong>of</strong><br />
<strong>septic</strong> <strong>tank</strong> soil-absorption systems on water quality <strong>in</strong> the<br />
pr<strong>in</strong>cipal <strong>valley</strong>-fill aquifer, Cedar Valley, Iron County,<br />
Utah–assessment and guidel<strong>in</strong>es: Utah Geological Survey<br />
Report <strong>of</strong> Investigation 239, 11 p.<br />
—1998b, The potential impact <strong>of</strong> <strong>septic</strong> <strong>tank</strong> soil-absorption<br />
systems on water quality <strong>in</strong> the pr<strong>in</strong>cipal <strong>valley</strong>-fill aquifer,<br />
Tooele Valley, Tooele County, Utah–assessment and guidel<strong>in</strong>es:<br />
Utah Geological Survey Report <strong>of</strong> Investigation 235, 10 p.<br />
—1998c, The potential impact <strong>of</strong> <strong>septic</strong> <strong>tank</strong> soil-absorption<br />
systems on water quality <strong>in</strong> the pr<strong>in</strong>cipal <strong>valley</strong>-fill aquifer,<br />
Ogden Valley, Weber County, Utah–assessment and guidel<strong>in</strong>es:<br />
Utah Geological Survey Report <strong>of</strong> Investigation 237,<br />
11 p.<br />
—1999, A mass-balance approach <strong>for</strong> recommend<strong>in</strong>g <strong>septic</strong><strong>tank</strong>-soil-absorption<br />
system <strong>density</strong>/lot-size requirements<br />
based on potential water-quality degradation due to nitrateexamples<br />
from <strong>three</strong> Utah <strong>valley</strong>s, <strong>in</strong> Spangler, L.E., and<br />
Allen, C.J., editors, Geology <strong>of</strong> northern Utah and vic<strong>in</strong>ity:<br />
Utah Geological Association Publication 27, p. 267-274<br />
Walton, W.C., 1988, Groundwater pump<strong>in</strong>g test: Lewis Publishers,<br />
Inc., Chelsea, Michigan, 201 p.<br />
Zhan, Honb<strong>in</strong>, and McKay, W. A., 1998, An assessment <strong>of</strong><br />
nitrate occurrence and transport <strong>in</strong> Washoe Valley, Nevada:<br />
Env<strong>iron</strong>mental and Eng<strong>in</strong>eer<strong>in</strong>g Geoscience, v. 4, no. 4, p.<br />
479 489.
APPENDIX A<br />
Drillers’ Logs <strong>of</strong> Sampled Wells
40 Utah Geological Survey<br />
Utah Division <strong>of</strong> Water Rights<br />
Water Well Log<br />
LOCATION: N 2060 ft E 500 ft from SW CORNER <strong>of</strong> SECTION 24 T 36S R 12W BASE SL Elevation: feet<br />
DRILLER ACTIVITIES:<br />
ACTIVITY: # 1 NEW WELL<br />
DRILLER: GARDNER DRILLING LICENSE #: 492<br />
START DATE: 11/15/1994 COMPLETION DATE: 12/07/1994<br />
BOREHOLE INFORMATION:<br />
Depth(ft)<br />
FromTo Diameter(<strong>in</strong>) Drill<strong>in</strong>g Method Drill<strong>in</strong>g Fluid<br />
0 400 14.5 R ROTARY WATER<br />
LITHOLOGY:<br />
Depth(ft)<br />
FromTo Lithologic Description Color Rock Type<br />
0 5 SILT<br />
5 70 CLAY<br />
70 73 SAND, GRAVEL<br />
73 90 CLAY<br />
90 125 GRAVEL, COBBLES<br />
125 128 CLAY<br />
128 160 SAND, GRAVEL<br />
160 170 CLAY, SAND<br />
170 198 CLAY<br />
198 204 SAND, GRAVEL<br />
204 235 GRAVEL, COBBLES<br />
235 255 CLAY<br />
255 283 GRAVEL, COBBLES<br />
283 295 CLAY<br />
295 306 CLAY, SAND, GRAVEL<br />
306 376 SAND, GRAVEL<br />
376 400 CLAY, SAND, GRAVEL<br />
WATER LEVEL DATA:<br />
Date Time Water Level (feet) Status<br />
(-)above ground<br />
12/07/1994 60.00 STATIC<br />
CONSTRUCTION - CASING:<br />
Depth(ft)<br />
FromTo Material Gage(<strong>in</strong>) Diameter(<strong>in</strong>)<br />
1 400 STEEL .280 8.00<br />
CONSTRUCTION - SCREENS/PERFORATIONS:<br />
Depth(ft) Screen(S) or Slot/ Screen Diameter/ Screen Type/<br />
FromTo Per<strong>for</strong>ation(P) Per<strong>for</strong>ation Size Length Per<strong>for</strong>ation(<strong>in</strong>) # Per<strong>for</strong>ation<br />
360 380 PERFORATION .187 2.50<br />
CONSTRUCTION - FILTER PACK/ANNULAR SEALS<br />
Depth(ft)<br />
From To Material Amount Density(pcf)<br />
0 100 CEMENT<br />
100 140 PEA GRAVEL<br />
140 150 BENTONITE HOLE PLUG<br />
150 400 PEA GRAVEL
Analysis <strong>of</strong> <strong>septic</strong>-<strong>tank</strong> <strong>density</strong>, Cedar Valley, Iron County, Utah<br />
41<br />
Utah Division <strong>of</strong> Water Rights<br />
Water Well Log<br />
LOCATION: N 2740 ft E 2740 ft from SW CORNER <strong>of</strong> SECTION 30 T 36S R 11W BASE SL Elevation:<br />
feet<br />
DRILLER ACTIVITIES:<br />
ACTIVITY: #1 NEW WELL<br />
DRILLER: GRIMSHAW & SONS WELL DRILLING INC LICENSE #: 514<br />
START DATE: 02/10/1986 COMPLETION DATE: 03/13/1986<br />
BOREHOLE INFORMATION:<br />
Depth(ft)<br />
FromTo Diameter(<strong>in</strong>) Drill<strong>in</strong>g Method Drill<strong>in</strong>g Fluid<br />
0 400 12 ROTARY<br />
LITHOLOGY:<br />
Depth(ft)<br />
FromTo Lithologic Description Color Rock Type<br />
0 25 CLAY<br />
25 35 COBBLES<br />
35 43 CLAY<br />
43 55 CLAY, BOULDERS<br />
55 120 BOULDERS<br />
120 379 CLAY, BOULDERS<br />
379 400 OTHER BEDROCK<br />
CONSTRUCTION - CASING:<br />
Depth(ft)<br />
FromTo Material Gage(<strong>in</strong>) Diameter(<strong>in</strong>)<br />
0 150 NEW .250 12<br />
CONSTRUCTION - SCREENS/PERFORATIONS:<br />
Depth(ft) Screen(S) or Slot/ Screen Diameter/ Screen Type/<br />
From To Per<strong>for</strong>ation(P) Per<strong>for</strong>ation Size Length Per<strong>for</strong>ation (<strong>in</strong>) # Per<strong>for</strong>ation<br />
150 400 PERFORATION .25 2.50 8000<br />
CONSTRUCTION - FILTER PACK/ANNULAR SEALS:<br />
Depth(ft)<br />
FromTo Material Amount Density(pcf)<br />
0 400 CEMENT<br />
100 400 GRAVEL<br />
GENERAL COMMENTS:<br />
CONSTRUCTION INFORMATION:<br />
Well head configuration: No data<br />
Cas<strong>in</strong>g Jo<strong>in</strong>t Type: Weld<br />
Per<strong>for</strong>ator used: Mill<br />
Well development: N/A<br />
Pump: N/A<br />
Comments: No data<br />
Additional data not available
42 Utah Geological Survey<br />
Utah Division <strong>of</strong> Water Rights<br />
Water Well Log<br />
LOCATION: N 1290 ft E 460 ft from SW CORNER <strong>of</strong> SECTION 23 T 36S R 12W BASE SL<br />
Elevation:<br />
feet<br />
DRILLER ACTIVITIES:<br />
ACTIVITY: # 1 NEW WELL<br />
DRILLER: Qu<strong>in</strong>n, Frank N. LICENSE #: 111<br />
START DATE: 02/18/1967 COMPLETION DATE: 03/07/1967<br />
BOREHOLE INFORMATION:<br />
Depth(ft) Diameter(<strong>in</strong>) Drill<strong>in</strong>g Method Drill<strong>in</strong>g Fluid<br />
FromTo<br />
0 228 16 CABLE<br />
LITHOLOGY:<br />
Depth(ft) Lithologic Description Color Rock Type<br />
FromTo<br />
0 1 OTHER SOIL<br />
1 3 CLAY<br />
3 8 SAND, GRAVEL<br />
8 16 CLAY, SAND<br />
16 37 CLAY<br />
37 39 WATER-BEARING, SAND, GRAVEL<br />
39 45 CLAY, SAND, SANDY<br />
45 46 SAND<br />
46 55 CLAY<br />
55 58 SAND, GRAVEL<br />
58 70 CLAY<br />
70 73 CLAY, SAND, SANDY<br />
73 80 CLAY<br />
80 83 SAND, GRAVEL<br />
83 85 CLAY, GRAVEL<br />
85 93 CLAY<br />
93 95 CLAY, GRAVEL<br />
95 106 CLAY<br />
106 110 CLAY, GRAVEL<br />
110 114 SAND, GRAVEL<br />
114 139 CLAY BROWN<br />
139 140 CLAY GRAY<br />
140 144 GRAVEL<br />
144 167 CLAY<br />
167 178 CLAY, GRAVEL<br />
178 180 GRAVEL<br />
180 201 CLAY, GRAVEL<br />
201 203 GRAVEL<br />
203 209 CLAY, GRAVEL<br />
209 211 CLAY<br />
211 228 CLAY, GRAVEL<br />
WATER LEVEL DATA:<br />
Water Level (feet) Status<br />
Date Time (-)above ground<br />
03/07/1967 18.00 STATIC<br />
CONSTRUCTION - CASING:<br />
Depth(ft) Material Gage(<strong>in</strong>) Diameter(<strong>in</strong>)<br />
FromTo<br />
0 228 NEW .25 16<br />
CONSTRUCTION - SCREENS/PERFORATIONS:<br />
Depth(ft) Screen(S) or Slot/ Screen Diameter/ Screen Type/<br />
FromTo Per<strong>for</strong>ation(P) Per<strong>for</strong>ation Size Length Per<strong>for</strong>ation(<strong>in</strong>) # Per<strong>for</strong>ations<br />
55 83 PERFORATION 3 .38 152<br />
110 114 PERFORATION 3 .38 96<br />
140 144 PERFORATION 3 .38 84<br />
178 180 PERFORATION 3 .38 60<br />
201 203 PERFORATION 3 .38 60
Analysis <strong>of</strong> <strong>septic</strong>-<strong>tank</strong> <strong>density</strong>, Cedar Valley, Iron County, Utah<br />
43<br />
Utah Division <strong>of</strong> Water Rights<br />
Water Well Log<br />
LOCATION: N 505 ft W 1665 ft from E4 CORNER <strong>of</strong> SECTION 31 T 36S R 11W BASE SL<br />
Elevation: feet<br />
DRILLER ACTIVITIES:<br />
ACTIVITY: #1 NEW WELL<br />
DRILLER: GRIMSHAW & SONS WELL DRILLING INC LICENSE #: 514<br />
START DATE: 08/11/1989 COMPLETION DATE: 08/18/1989<br />
BOREHOLE INFORMATION:<br />
Depth(ft)<br />
FromTo Diameter(<strong>in</strong>) Drill<strong>in</strong>g Method Drill<strong>in</strong>g Fluid<br />
0 290 8 ROTARY<br />
LITHOLOGY:<br />
Depth(ft)<br />
FromTo Lithologic Description Color Rock Type<br />
0 5 CLAY<br />
5 147 BOULDERS<br />
147 253 CLAY, COBBLES<br />
253 290 BOULDERS<br />
CONSTRUCTION - CASING:<br />
Depth(ft)<br />
FromTo Material Gage(<strong>in</strong>) Diameter(<strong>in</strong>)<br />
0 250 NEW .188 8<br />
CONSTRUCTION - SCREENS/PERFORATIONS:<br />
Depth(ft) Screen(S) or Slot/ Screen Diameter/ Screen Type/<br />
FromTo Per<strong>for</strong>ation(P) Per<strong>for</strong>ation Size Length Per<strong>for</strong>ation(<strong>in</strong>) # Per<strong>for</strong>ation<br />
250 290 PERFORATION 3 .19 640<br />
CONSTRUCTION - FILTER PACK/ANNULAR SEALS:<br />
Depth(ft)<br />
FromTo Material Amount Density(pcf)<br />
0 10 BENTONITE<br />
10 290 GRAVEL<br />
WELL TESTS:<br />
Date Test Method Yield (CFS) Drawdown (ft) Time Pumped (hrs)<br />
08/18/1989 PUMP .067 50 24
44 Utah Geological Survey<br />
Utah Division <strong>of</strong> Water Rights<br />
Water Well Log<br />
LOCATION: N 2740 ft E 2840 ft from SW CORNER <strong>of</strong> SECTION 30 T 36S R 11W BASE SL<br />
Elevation: feet<br />
DRILLER ACTIVITIES:<br />
ACTIVITY: #1 NEW WELL<br />
DRILLER: PETERSEN PUMPS & WELLS LICENSE #: 26<br />
START DATE: 06/16/1995 COMPLETION DATE: 08/29/1996<br />
BOREHOLE INFORMATION:<br />
Depth(ft)<br />
FromTo Diameter(<strong>in</strong>) Drill<strong>in</strong>g Method Drill<strong>in</strong>g Fluid<br />
0 220 17.0 CABLE<br />
220 430 12.0 CABLE<br />
430 610 8.00 CABLE<br />
LITHOLOGY:<br />
Depth(ft)<br />
FromTo Lithologic Description Color Rock Type<br />
0 10 LOW-PERMEABILITY, TAN/RED A SMALL SEEP<br />
AT 40'/CLAY<br />
CLAY, GRAVEL<br />
IN BETWEEN THE<br />
BOULDER/HARD<br />
10 20 LOW-PERMEABILITY, CLAY, COBBLES TAN/RED<br />
20 30 LOW-PERMEABILITY, CLAY, BOULDERS TAN/RED<br />
30 40 LOW-PERMEABILITY, CLAY, COBBLES TAN/RED<br />
40 50 LOW-PERMEABILITY, CLAY, COBBLES TAN/RED<br />
50 60 LOW-PERMEABILITY, CLAY, BOULDERS TAN/RED<br />
60 70 LOW-PERMEABILITY, CLAY, COBBLES TAN/RED<br />
70 80 HIGH-PERMEABILITY, CLAY, BOULDERS<br />
80 90 LOW-PERMEABILITY, CLAY, COBBLES<br />
90 100 HIGH-PERMEABILITY, CLAY, BOULDERS<br />
100 120 HIGH-PERMEABILITY, BOULDERS<br />
120 130 LOW-PERMEABILITY, CLAY, BOULDERS<br />
130 180 LOW-PERMEABILITY, CLAY, COBBLES<br />
180 190 HIGH-PERMEABILITY, BOULDERS<br />
190 220 LOW-PERMEABILITY, CLAY, BOULDERS FROM WHITE TO RED<br />
HARDER/GOOD WATER<br />
GRAVEL<br />
220 240 WATER-BEARING, SAND, GRAVEL<br />
240 300 LOW-PERMEABILITY, CLAY, GRAVEL, BOULDERS<br />
300 310 HIGH-PERMEABILITY, BOULDERS HARDER/WHITE<br />
TO RED/SEVERAL<br />
SMALL SEEPS<br />
310 320 WATER-BEARING, LOW-PERMEABILITY, BOULDERS<br />
320 360 LOW-PERMEABILITY, BOULDERS<br />
360 400 LOW-PERMEABILITY, BOULDERS<br />
400 420 LOW-PERMEABILITY, CLAY, GRAVEL<br />
420 430 LOW-PERMEABILITY, GRAVEL<br />
430 440 WATER-BEARING, BOULDER 435' 1' WATER<br />
440 450 LOW-PERMEABILITY, BOULDERS<br />
450 460 WATER-BEARING, LOW-PERMEABILITY, SAND, BOULDERS<br />
460 470 LOW-PERMEABILITY, COBBLES, BOULDERS HARDEST/BROWN<br />
TO TAN/451' 6"<br />
WATER<br />
470 480 LOW-PERMEABILITY, BOULDERS SMALL LAYERED<br />
SAND/BROWN TO<br />
TAN/HARDEST<br />
480 490 LOW-PERMEABILITY, COBBLES<br />
490 500 LOW-PERMEABILITY, BOULDERS<br />
500 520 LOW-PERMEABILITY, COBBLES, BOULDERS
Analysis <strong>of</strong> <strong>septic</strong>-<strong>tank</strong> <strong>density</strong>, Cedar Valley, Iron County, Utah<br />
45<br />
520 610 LOW-PERMEABILITY, CLAY, OTHER SMALL SAND<br />
(WATER) LAYERS<br />
WITH MORE CLAY<br />
IN BETWEEN THE<br />
BOULDERS<br />
BROWN TO TAN/<br />
HARDEST<br />
WATER LEVEL DATA:<br />
Date Time (-)above ground Status<br />
05/ /1996 176.00 STATIC<br />
Water Level (feet)<br />
CONSTRUCTION - CASING:<br />
Depth(ft)<br />
FromTo Material Gage(<strong>in</strong>) Diameter(<strong>in</strong>)<br />
0 380 .280 12.0<br />
350 600 .250 8.00<br />
CONSTRUCTION - SCREENS/PERFORATIONS:<br />
Depth(ft) Screen(S) or Slot/ Screen Diameter/ Screen Type/<br />
FromTo Per<strong>for</strong>ation(P) Per<strong>for</strong>ation Size Length Per<strong>for</strong>ation(<strong>in</strong>) # Per<strong>for</strong>ation<br />
220 360 PERFORATION 8-10<br />
430 600 PERFORATION 5-8<br />
CONSTRUCTION - FILTER PACK/ANNULAR SEALS:<br />
Depth(ft)<br />
FromTo Material Amount Density(pcf)<br />
0 220 CEMENT NEAT 11<br />
WELL TESTS:<br />
Date Test Method Yield (CFS) Drawdown (ft) Time Pumped (hrs)<br />
08/29/1996 PUMP .178 225 6<br />
08/29/1996 PUMP .457 274 46<br />
GENERAL COMMENTS:<br />
CONSTRUCTION INFORMATION:<br />
Well head configuration: No data<br />
Cas<strong>in</strong>g Jo<strong>in</strong>t Type: Welded<br />
Per<strong>for</strong>ator used: Mills<br />
Pump: 350 gpm Sub<br />
HP: 50<br />
Intake Depth: 530 feet<br />
Approx pump rate: 400 gpm<br />
Well dis<strong>in</strong>fected: Yes<br />
Additional data not available
46 Utah Geological Survey<br />
Utah Division <strong>of</strong> Water Rights<br />
Water Well Log (C-36-12)24abd<br />
LOCATION: S 1440 ft W 300 ft from NE CORNER <strong>of</strong> SECTION 24 T 36S R 12W BASE SL<br />
Elevation: feet<br />
DRILLER ACTIVITIES:<br />
ACTIVITY: #1 WELL REPLACEMENT<br />
DRILLER: GRIMSHAW & SONS WELL DRILLING INC. LICENSE #: 514<br />
START DATE: 06/17/1986 COMPLETION DATE: 07/11/1986<br />
BOREHOLE INFORMATION:<br />
Depth(ft)<br />
FromTo Diameter(<strong>in</strong>) Drill<strong>in</strong>g Method Drill<strong>in</strong>g Fluid<br />
0 300 16.0 ROTARY<br />
LITHOLOGY:<br />
Depth(ft)<br />
FromTo Lithologic Description Color Rock Type<br />
0 31 CLAY RED<br />
31 47 CLAY, ANT SIZE<br />
47 75 CLAY RED<br />
75 94 CLAY WHITE<br />
94 188 CLAY, GRAVEL RED<br />
188 264 CLAY, BOULDERS RED<br />
264 279 CLAY, BOULDERS BLUE<br />
279 300 CLAY, BOULDERS WHITE<br />
CONSTRUCTION - CASING:<br />
Depth(ft)<br />
FromTo Material Gage(<strong>in</strong>) Diameter(<strong>in</strong>)<br />
0 200 NEW .250 16.0<br />
CONSTRUCTION - SCREENS/PERFORATIONS:<br />
Depth(ft) Screen(S) or Slot/ Screen Diameter/ Screen Type/<br />
FromTo Per<strong>for</strong>ation(P) Per<strong>for</strong>ation Size Length Per<strong>for</strong>ation(<strong>in</strong>) # Per<strong>for</strong>ation<br />
200 300 PERFORATION .250 2.50 3200 MILLED<br />
CONSTRUCTION - FILTER PACK/ANNULAR SEALS:<br />
Depth(ft)<br />
FromTo Material Amount Density(pcf)<br />
0 165 CEMENT<br />
165 300 3/8 GRAVEL<br />
GENERAL COMMENTS:<br />
Additional data not available
Analysis <strong>of</strong> <strong>septic</strong>-<strong>tank</strong> <strong>density</strong>, Cedar Valley, Iron County, Utah<br />
47<br />
Utah Division <strong>of</strong> Water Rights<br />
Water Well Log<br />
LOCATION: S 243 ft W 580 ft from E4 CORNER <strong>of</strong> SECTION 31 T 36S R 11W BASE SL Elevation: feet<br />
DRILLER ACTIVITIES:<br />
ACTIVITY: #1NEW WELL<br />
DRILLER: GRIMSHAW & SONS WELL DRILLING INC LICENSE #: 514<br />
START DATE: 03/26/1992 COMPLETION DATE: 04/08/1992<br />
BOREHOLE INFORMATION:<br />
Depth(ft)<br />
FromTo Diameter(<strong>in</strong>) Drill<strong>in</strong>g Method Drill<strong>in</strong>g Fluid<br />
0 400 8 ROTARY<br />
LITHOLOGY:<br />
Depth(ft)<br />
FromTo Lithologic Description Color Rock Type<br />
0 23 CLAY, SILT RED RED<br />
23 123 BOULDERS CONGLOMERATE<br />
123 152 CLAY, GRAVEL, BOULDERS<br />
152 370 CLAY, BOULDERS<br />
370 383 HARDPAN/MUDSTONE YELLOW MUDSTONE, YELLOW<br />
383 400 HARDPAN/MUDSTONE RED RED MUDSTONE<br />
CONSTRUCTION - CASING:<br />
Depth(ft)<br />
FromTo Material Gage(<strong>in</strong>) Diameter(<strong>in</strong>)<br />
0 280 .188 8<br />
320 360 .188 8<br />
CONSTRUCTION - SCREENS/PERFORATIONS:<br />
Depth(ft) Screen(S) or Slot/ Screen Diameter/ Screen Type/<br />
FromTo Per<strong>for</strong>ation(P) Per<strong>for</strong>ation Size Length Per<strong>for</strong>ation (<strong>in</strong>.) # Per<strong>for</strong>ation<br />
280 320 PERFORATION .125 2.5 640<br />
360 400 PERFORATION .125 2.5 640<br />
CONSTRUCTION - FILTER PACK/ANNULAR SEALS:<br />
Depth(ft)<br />
FromTo Material Amount Density(pcf)<br />
0 100 GROUT CEMENT<br />
100 400 GRAVEL SIZE 3/8
48 Utah Geological Survey<br />
Utah Division <strong>of</strong> Water Rights<br />
Water Well Log<br />
LOCATION: N 530 ft E 1110 ft from SW CORNER <strong>of</strong> SECTION 19 T 36S R 11W BASE SL<br />
Elevation: feet<br />
DRILLER ACTIVITIES:<br />
ACTIVITY: #1 NEW WELL<br />
DRILLER: BRADSHAW PRESTON & SONS LICENSE #: 114<br />
START DATE: 06/15/1978 COMPLETION DATE: 07/06/1978<br />
BOREHOLE INFORMATION:<br />
Depth(ft)<br />
FromTo Diameter(<strong>in</strong>) Drill<strong>in</strong>g Method Drill<strong>in</strong>g Fluid<br />
0 200 10.8 CABLE<br />
LITHOLOGY:<br />
Depth(ft)<br />
FromTo Lithologic Description Color Rock Type<br />
0 2 OTHER LOAM<br />
2 12 CLAY<br />
12 30 CLAY, SAND<br />
30 38 CLAY<br />
38 46 GRAVEL<br />
46 55 CLAY<br />
55 64 GRAVEL<br />
64 71 GRAVEL, BOULDERS<br />
71 200 GRAVEL<br />
WATER LEVEL DATA:<br />
Date Time Water Level (feet) (-)above ground Status<br />
07/06/1978 112.00 STATIC<br />
CONSTRUCTION - CASING:<br />
Depth(ft)<br />
FromTo Material Gage(<strong>in</strong>) Diameter(<strong>in</strong>)<br />
0 200 NEW .219 10.8<br />
CONSTRUCTION - SCREENS/PERFORATIONS:<br />
Depth(ft) Screen(S) or Slot/ Screen Diameter/ Screen Type/<br />
FromTo Per<strong>for</strong>ation(P) Per<strong>for</strong>ation Size Length Per<strong>for</strong>ation(<strong>in</strong>) # Per<strong>for</strong>ation<br />
125 197 PERFORATION .38 2.50 800<br />
CONSTRUCTION - FILTER PACK/ANNULAR SEALS:<br />
Depth(ft)<br />
FromTo Material Amount Density(pcf)<br />
0 38 CEMENT/GROUT
Analysis <strong>of</strong> <strong>septic</strong>-<strong>tank</strong> <strong>density</strong>, Cedar Valley, Iron County, Utah<br />
49<br />
Utah Division <strong>of</strong> Water Rights<br />
Water Well Log<br />
(C-36-11)31aab<br />
LOCATION: S 886 ft E 2653 ft from NW CORNER <strong>of</strong> SECTION 31 T 36S R 11W BASE SL<br />
Elevation:feet<br />
DRILLER ACTIVITIES:<br />
ACTIVITY: # 1 NEW WELL<br />
DRILLER: GRIMSHAW & SONS WELL DRILLING INC LICENSE #: 514<br />
START DATE: 02/26/1991 COMPLETION DATE: 03/06/1991<br />
BOREHOLE INFORMATION:<br />
Depth(ft)<br />
FromTo Diameter(<strong>in</strong>) Drill<strong>in</strong>g Method Drill<strong>in</strong>g Fluid<br />
0 400 8 ROTARY<br />
LITHOLOGY:<br />
Depth(ft)<br />
FromTo Lithologic Description Color Rock Type<br />
0 25 CLAY<br />
25 132 BOULDERS<br />
132 400 CLAY, COBBLES<br />
WATER LEVEL DATA:<br />
Date Time Water Level (feet)(-) above ground Status<br />
03/08/1991 170.00 STATIC<br />
CONSTRUCTION - CASING:<br />
Depth(ft)<br />
FromTo Material Gage(<strong>in</strong>) Diameter(<strong>in</strong>)<br />
0 320 NEW .188 8<br />
CONSTRUCTION - SCREENS/PERFORATIONS:<br />
Depth(ft) Screen(S) or Slot/ Screen Diameter ScreenType/<br />
FromTo Per<strong>for</strong>ation(P) Per<strong>for</strong>ation Size Length Per<strong>for</strong>ation (<strong>in</strong>.) # Per<strong>for</strong>ation<br />
320 400 PERFORATION 2.50 .19 1280<br />
CONSTRUCTION - FILTER PACK/ANNULAR SEALS:<br />
Depth(ft)<br />
FromTo Material Amount Density(pcf)<br />
0 10 BENTONITE<br />
10 400 GRAVEL<br />
WELL TESTS:<br />
Date Test Method Yield (CFS) Drawdown (ft) Time Pumped (hrs)<br />
03/08/1991 PUMP .056 40 20<br />
03/08/1991 PUMP .056 80 10
50 Utah Geological Survey
Analysis <strong>of</strong> <strong>septic</strong>-<strong>tank</strong> <strong>density</strong>, Cedar Valley, Iron County, Utah<br />
51<br />
Hamiltons Fort pump<strong>in</strong>g well<br />
Utah Division <strong>of</strong> Water Rights<br />
Water Well Log<br />
LOCATION: N 1310 ft W<br />
Elevation: feet<br />
50 ft from S4 CORNER <strong>of</strong> SECTION 25 T 36S R 12W BASE SL<br />
DRILLER ACTIVITIES:<br />
ACTIVITY: #1 NEW WELL<br />
DRILLER: PETERSEN PUMPS & WELLS LICENSE #: 26<br />
START DATE: 04/15/1992 COMPLETION DATE: 08/10/1993<br />
BOREHOLE INFORMATION:<br />
Depth(ft)<br />
FromTo Diameter(<strong>in</strong>) Drill<strong>in</strong>g Method Drill<strong>in</strong>g Fluid<br />
0 145 8.00 CABLE<br />
LITHOLOGY:<br />
Depth(ft)<br />
FromTo Lithologic Description Color Rock Type<br />
0 45 CLAY BLUE<br />
45 50 OTHER CORAL SANDSTONE<br />
50 65 CLAY, OTHER BLUE CLAY ROCK<br />
65 72 OTHER ROCK<br />
72 106 CLAY, OTHER CORAL CLAY ROCK<br />
106 121 WATER-BEARING, OTHER SANDSTONE<br />
121 220 LOW-PERMEABILITY BLUE<br />
WATER LEVEL DATA:<br />
Date Time Water Level (feet) (-)above ground Status<br />
08/10/1993 72.00<br />
CONSTRUCTION - CASING:<br />
Depth(ft)<br />
FromTo Material Gage(<strong>in</strong>) Diameter(<strong>in</strong>)<br />
0 121 NEW .277 8.00<br />
CONSTRUCTION - FILTER PACK/ANNULAR SEALS:<br />
Depth(ft)<br />
FromTo Material Amount Density(pcf)<br />
0 20 1 5<br />
WELL TESTS:<br />
Date Test Method Yield (CFS) Drawdown (ft) Time Pumped (hrs)<br />
08/08/1993 BAILER .013 15<br />
GENERAL COMMENTS:<br />
CONSTRUCTION INFORMATION:<br />
Well head Configuration: No data<br />
Cas<strong>in</strong>g Jo<strong>in</strong>t Type: Weld Per<strong>for</strong>ator: Mills<br />
PUMP: Submergible Horsepower: 1 Pump Intake: 105 feet<br />
Approx max pump rate: no data Well dis<strong>in</strong>fected: Yes
52 Utah Geological Survey<br />
Utah Division <strong>of</strong> Water Rights<br />
Water Well Log<br />
LOCATION: S 510 ft E 540 ft from N4 CORNER <strong>of</strong> SECTION 3 T 36S R 12W BASE SL<br />
Elevation: feet<br />
ACTIVITY: #1 NEW WELL<br />
DRILLER: AQUA 1 SERVICE LICENSE #: 27<br />
START DATE: 09/18/1975 COMPLETION DATE: 09/24/1975<br />
BOREHOLE INFORMATION:<br />
Depth(ft)<br />
FromTo Diameter(<strong>in</strong>) Drill<strong>in</strong>g Method Drill<strong>in</strong>g Fluid<br />
0 132 5 CABLE<br />
LITHOLOGY:<br />
Depth(ft)<br />
FromTo Lithologic Description Color Rock Type<br />
0 37 CLAY<br />
37 46 GRAVEL<br />
46 72 CLAY, GRAVEL<br />
72 76 CLAY, GRAVEL, SANDY<br />
76 78 GRAVEL<br />
78 83 CLAY, GRAVELY<br />
83 84 GRAVEL<br />
84 90 CLAY<br />
90 91 GRAVEL<br />
91 121 CLAY, GRAVEL, BOULDERS<br />
121 131 CLAY<br />
131 132 GRAVEL<br />
WATER LEVEL DATA:<br />
Date Time Water Level (feet)(-) above ground Status<br />
09/19/1975 37.00 STATIC<br />
CONSTRUCTION - CASING:<br />
Depth(ft)<br />
From To Material Gage(<strong>in</strong>) Diameter(<strong>in</strong>)<br />
0 132 NEW .188 5<br />
CONSTRUCTION - SCREENS/PERFORATIONS:<br />
Depth(ft) Screen(S) or Slot/ Screen Diameter/ Screen Type/<br />
FromTo Per<strong>for</strong>ation(P) Per<strong>for</strong>ation Size Length Per<strong>for</strong>ation(<strong>in</strong>) # Per<strong>for</strong>ation<br />
95 115 PERFORATION .13 2.50 40<br />
124 132 PERFORATION .13 2.50 20<br />
WELL TESTS:<br />
Date Test Method Yield (CFS) Drawdown (ft) Time Pumped (hrs)<br />
09/19/1975 BAILER .062
Analysis <strong>of</strong> <strong>septic</strong>-<strong>tank</strong> <strong>density</strong>, Cedar Valley, Iron County, Utah<br />
53
54 Utah Geological Survey
Analysis <strong>of</strong> <strong>septic</strong>-<strong>tank</strong> <strong>density</strong>, Cedar Valley, Iron County, Utah<br />
55<br />
Utah Division <strong>of</strong> Water Rights<br />
Water Well Log<br />
LOCATION: N 1076 ft E 82 ft from W4 CORNER <strong>of</strong> SECTION 11 T 36S R 12W BASE SL Elevation: Feet<br />
DRILLER ACTIVITIES:<br />
ACTIVITY: #1 NEW WELL<br />
DRILLER: AQUA 1 SERVICE LICENSE #: 27<br />
START DATE: 09/10/1995 COMPLETION DATE: 09/30/1995<br />
BOREHOLE INFORMATION:<br />
Depth(ft)<br />
FromTo Diameter(<strong>in</strong>) Drill<strong>in</strong>g Method Drill<strong>in</strong>g Fluid<br />
0 400 14.7 MUD ROTARY BENTONITE<br />
LITHOLOGY:<br />
Depth(ft)<br />
FromTo Lithologic Description Color Rock Type<br />
0 360 CLAY, SAND<br />
360 400 SAND, GRAVEL<br />
WATER LEVEL DATA:<br />
Date Time Water Level (feet) (-)above ground Status<br />
09/30/1995 103.00 STATIC<br />
CONSTRUCTION - FILTER PACK/ANNULAR SEALS:<br />
Depth(ft)<br />
FromTo Material Amount Density(pcf)<br />
0 120 BENSEAL GROUT (BAGS) 90<br />
120 400 GRAVEL PACK 3/8<br />
GENERAL COMMENTS:<br />
CONSTRUCTION INFORMATION:<br />
Well head configuration: well cap<br />
Cas<strong>in</strong>g jo<strong>in</strong>t type: welded<br />
Per<strong>for</strong>ator Used: no data available<br />
ADDITIONAL INFORMATION NOT AVAILABLE
56 Utah Geological Survey<br />
Utah Division <strong>of</strong> Water Rights<br />
Water Well Log<br />
LOCATION: S 1750 ft W 2050 ft from NE CORNER <strong>of</strong> SECTION 11 T 36S R 12W BASE SL Elevation:<br />
feet<br />
DRILLER ACTIVITIES:<br />
ACTIVITY: # 1 NEW WELL<br />
DRILLER: GRIMSHAW & SONS WELL DRILLING INC LICENSE #: 514<br />
START DATE: 11/19/1996 COMPLETION DATE: 11/28/1996<br />
BOREHOLE INFORMATION:<br />
Depth(ft)<br />
FromTo Diameter(<strong>in</strong>) Drill<strong>in</strong>g Method Drill<strong>in</strong>g Fluid<br />
0 304 12.5 ROTARY BENTONITE<br />
LITHOLOGY:<br />
Depth(ft)<br />
FromTo Lithologic Description Color Rock Type<br />
0 40 CLAY RED<br />
40 63 CLAY, OTHER LITE BROWN LOTS OF SMALL CHARCOAL CHIPS<br />
63 177 CLAY BROWN<br />
177 264 CLAY BROWN/GREEN<br />
264 270 SAND YELLOW<br />
270 286 GRAVEL, SMALL-ANT SIZE<br />
TO PEA GRAVEL<br />
286 304 CLAY RED<br />
WATER LEVEL DATA:<br />
Date Time Water Level (feet) (-) above ground Status<br />
11/28/1996 30.00 STATIC<br />
CONSTRUCTION - CASING:<br />
Depth(ft)<br />
FromTo Material Gage(<strong>in</strong>) Diameter(<strong>in</strong>)<br />
0 264 STEEL .188 6.00<br />
CONSTRUCTION - SCREENS/PERFORATIONS:<br />
Depth(ft) Screen(S) or Slot/ Screen Diameter/ Screen Type/<br />
From To Per<strong>for</strong>ation(P) Per<strong>for</strong>ation Size Length Per<strong>for</strong>ation (<strong>in</strong>) # Per<strong>for</strong>ation<br />
264 304 PERFORATION .125 2.50 6 ROW<br />
CONSTRUCTION - FILTER PACK/ANNULAR SEALS:<br />
Depth(ft)<br />
FromTo Material Amount Density(pcf)<br />
0 18 BENTONITE<br />
18 304 PEA GRAVEL 1/4-3/8<br />
WELL TESTS:<br />
Date Test Method Yield (CFS) Drawdown (ft) Time Pumped (hrs)<br />
11/26/1996 SEE FILE .000<br />
GENERAL COMMENTS:<br />
CONSTRUCTION INFORMATION:<br />
Well head configuration: No data<br />
Cas<strong>in</strong>g Jo<strong>in</strong>t Type: Weld<br />
Per<strong>for</strong>ator used: Milled<br />
Additional data not available
Analysis <strong>of</strong> <strong>septic</strong>-<strong>tank</strong> <strong>density</strong>, Cedar Valley, Iron County, Utah<br />
57<br />
Utah Division <strong>of</strong> Water Rights<br />
Water Well Log<br />
LOCATION: N 155 ft E 1365 ft from SW CORNER <strong>of</strong> SECTION 3 T 36S R 12W BASE SL<br />
Elevation: feet<br />
DRILLER ACTIVITIES:<br />
ACTIVITY: # 1 NEW WELL<br />
DRILLER: GRIMSHAW & SONS WELL DRILLING INC LICENSE #: 514<br />
START DATE: 08/30/1996 COMPLETION DATE: 10/04/1996<br />
BOREHOLE INFORMATION:<br />
Depth(ft)<br />
FromTo Diameter(<strong>in</strong>) Drill<strong>in</strong>g Method Drill<strong>in</strong>g Fluid<br />
0 538 24.0 ROTARY BENTONITE<br />
LITHOLOGY:<br />
Depth(ft)<br />
FromTo Lithologic Description Color Rock Type<br />
0 73 CLAY RED CEDAR CANYON CLAY/RED<br />
73 147 CLAY BLUE LAKE BOTTOM/BLUE<br />
147 156 CLAY, GRAVEL BLUE SM. GRAVEL/CLAY BLUE<br />
156 209 CLAY BLUE BLUE<br />
209 234 WATER-BEARING, HIGH - PERMEABILITY COBBLES RED CEDAR CANYON/RED<br />
234 308 CLAY<br />
308 441 WATER- BEARING, HIGH-PERMEABILITY, BOULDERS<br />
441 538 WATER-BEARING, LOW- PERMEABILITY CLAY<br />
COBBLES YELLOW CLAY/YELLOW<br />
WATER LEVEL DATA:<br />
Date Time Water Level (feet) (-)above ground Status<br />
10/04/1996 32.20 STATIC<br />
CONSTRUCTION - CASING:<br />
Depth(ft)<br />
From To Material Gage(<strong>in</strong>) Diameter(<strong>in</strong>)<br />
0 238 STEEL .375 16.0<br />
CONSTRUCTION - SCREENS/PERFORATIONS:<br />
Depth(ft) Screen(S) or Slot Screen Diameter/ Screen Type/<br />
FromTo Per<strong>for</strong>ation(P) Per<strong>for</strong>ation Size Length Per<strong>for</strong>ation(<strong>in</strong>) # Per<strong>for</strong>ation<br />
238 538 PERFORATION .125 2.50 16 ROW<br />
CONSTRUCTION - FILTER PACK/ANNULAR SEALS:<br />
Depth(ft)<br />
FromTo Material Amount Density(pcf)<br />
0 200 GROUT 23 12<br />
200 538 3/8" PEA GRAVEL<br />
GENERAL COMMENTS:<br />
CONSTRUCTION INFORMATION:<br />
Well head configuration: Grouted to 200 feet<br />
Cas<strong>in</strong>g Jo<strong>in</strong>t Type: Weld<br />
Per<strong>for</strong>ator used: Milled<br />
Well Development: See paperwork on file<br />
Comments:<br />
A 3" gravel tube was placed <strong>in</strong> well to 200' well did take a lot <strong>of</strong> gravel while test pump<strong>in</strong>g.<br />
Additional data not available
58 Utah Geological Survey
Analysis <strong>of</strong> <strong>septic</strong>-<strong>tank</strong> <strong>density</strong>, Cedar Valley, Iron County, Utah<br />
59<br />
Utah Division <strong>of</strong> Water Rights<br />
Water Well Log<br />
LOCATION: S 470 ft E 310 ft from N4 CORNER <strong>of</strong> SECTION 9 T 35S R 11W BASE SL<br />
Elevation: feet<br />
DRILLER ACTIVITIES:<br />
ACTIVITY: #1 WELL REPLACEMENT<br />
DRILLER: GRIMSHAW & SONS WELL DRILLING INC LICENSE #: 514 START DATE: 10/06/1998<br />
COMPLETION DATE: 12/04/1998<br />
BOREHOLE INFORMATION:<br />
Depth(ft)<br />
FromTo Diameter(<strong>in</strong>) Drill<strong>in</strong>g Method Drill<strong>in</strong>g Fluid<br />
0 465 24 ROTARY BENTONITE<br />
LITHOLOGY:<br />
Depth(ft)Lithologic Description Color Rock Type<br />
FromTo<br />
0 43 CLAY, SILT RED<br />
43 56 SILT, GRAVEL LT BROWN CLAY<br />
56 68 CLAY LT BROWN CLAY<br />
68 81 GRAVEL<br />
81 105 CLAY BROWN<br />
105 109 WATER-BEARING, LOW-PERMEABILITY, CLAY, GRAVEL SOME GRAVEL<br />
109 143 WATER-BEARING, HIGH-PERMEABILITY, GRAVEL<br />
143 168 WATER-BEARING, HIGH-PERMEABILITY, COBBLES<br />
168 224 WATER-BEARING, LOW-PERMEABILITY, CLAY, GRAVEL<br />
224 234 WATER-BEARING, HIGH-PERMEABILITY, GRAVEL<br />
234 303 CLAY<br />
303 315 WATER-BEARING, HIGH-PERMEABILITY, GRAVEL<br />
315 333 CLAY<br />
333 337 WATER-BEARING, LOW-PERMEABILITY, CLAY, GRAVEL<br />
337 416 CLAY<br />
416 445 WATER-BEARING, LOW-PERMEABILITY, CLAY, GRAVEL SOME GRAVEL<br />
445 465 CLAY<br />
WATER LEVEL DATA:<br />
Date Time Water Level (feet) (-) above ground Status<br />
12/04/1998 20.00 STATIC<br />
CONSTRUCTION - CASING:<br />
Depth(ft)<br />
FromTo Material Gage(<strong>in</strong>) Diameter(<strong>in</strong>)<br />
0 180 STEEL .250 12.0<br />
265 345 STEEL .250 12.0<br />
CONSTRUCTION - SCREENS/PERFORATIONS:<br />
Depth(ft) Screen(S) or Slot/ Screen Diameter/ Screen Type/<br />
FromTo Per<strong>for</strong>ation(P) Per<strong>for</strong>ation Size Length Per<strong>for</strong>ation(<strong>in</strong>) # Per<strong>for</strong>ation<br />
180 265 PERFORATION .125 2.50 12 ROW<br />
345 465 PERFORATION .125 2.50 12 ROW<br />
CONSTRUCTION - FILTER PACK/ANNULAR SEALS:<br />
Depth(ft)<br />
FromTo Material Amount Density(pcf)<br />
0 100 GROUT 12<br />
105 465 PEA GRAVEL 3/8"<br />
GENERAL COMMENTS:<br />
CONSTRUCTION INFORMATION:<br />
Well Head Configuration: 100' cf 4" grave tube<br />
Cas<strong>in</strong>g Jo<strong>in</strong>t Type: weld<br />
Per<strong>for</strong>ator Used: milled<br />
WELL DEVELOPMENT: no data<br />
Additional data not available
60 Utah Geological Survey<br />
Utah Division <strong>of</strong> Water Rights<br />
Water Well Log<br />
LOCATION: N 60 ft W 160 ft from S4 CORNER <strong>of</strong> SECTION 8 T 35S R 11W BASE SL<br />
Elevation: feet<br />
DRILLER ACTIVITIES:<br />
ACTIVITY: #1 WELL REPLACEMENT<br />
DRILLER: B & B Drill<strong>in</strong>g Co. LICENSE #: 126<br />
START DATE: 09/04/1971 COMPLETION DATE: 11/20/1971<br />
BOREHOLE INFORMATION:<br />
Depth(ft)<br />
FromTo Diameter(<strong>in</strong>) Drill<strong>in</strong>g Method Drill<strong>in</strong>g Fluid<br />
0 300 10 ROTARY<br />
LITHOLOGY:<br />
Depth(ft)<br />
FromTo Lithologic Description Color Rock Type<br />
0 52 CLAY<br />
52 61 SAND<br />
61 70 CLAY<br />
70 82 SAND<br />
82 205 CLAY, SAND<br />
205 300 SAND, GRAVEL<br />
WATER LEVEL DATA:<br />
Date Time Water Level (feet) (-)above ground Status<br />
11/20/1971 45.00 STATIC<br />
CONSTRUCTION - CASING:<br />
Depth(ft)<br />
FromTo Material Gage(<strong>in</strong>) Diameter(<strong>in</strong>)<br />
0 300 10<br />
CONSTRUCTION - SCREENS/PERFORATIONS:<br />
Depth(ft) Screen(S) or Slot/ Screen Diameter/ Screen Type/<br />
FromTo Per<strong>for</strong>ation(P) Per<strong>for</strong>ation Size Length Per<strong>for</strong>ation(<strong>in</strong>) # Per<strong>for</strong>ations<br />
200 300 PERFORATION .19 3<br />
CONSTRUCTION - FILTER PACK/ANNULAR SEALS:<br />
Depth(ft)<br />
FromTo Material Amount Density(pcf)<br />
0 300 GRAVEL<br />
WELL TESTS:<br />
Date Test Method Yield (CFS) Drawdown (ft) Time Pumped (hrs)<br />
11/20/1971 PUMP 1.114 158 10
APPENDIX B<br />
Drillers’ Logs <strong>of</strong> Aquifer Test Wells
62 Utah Geological Survey
Analysis <strong>of</strong> <strong>septic</strong>-<strong>tank</strong> <strong>density</strong>, Cedar Valley, Iron County, Utah<br />
63
64 Utah Geological Survey
Analysis <strong>of</strong> <strong>septic</strong>-<strong>tank</strong> <strong>density</strong>, Cedar Valley, Iron County, Utah<br />
65
66 Utah Geological Survey