Supply and Demand for Dental Supply and Demand for Dental ...
Supply and Demand for Dental Supply and Demand for Dental ...
Supply and Demand for Dental Supply and Demand for Dental ...

Create successful ePaper yourself
Turn your PDF publications into a flip-book with our unique Google optimized e-Paper software.
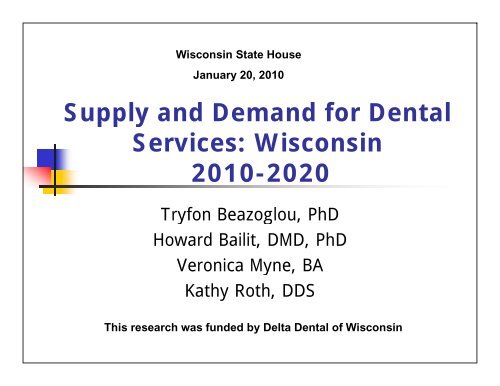
Wisconsin State House<br />
January 20, 2010<br />
<strong>Supply</strong> <strong>and</strong> Dem<strong>and</strong> <strong>for</strong> <strong>Dental</strong><br />
Services: Wisconsin<br />
2010-20202020<br />
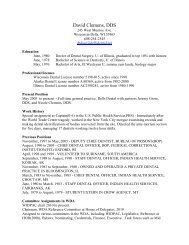
Tryfon Beazoglou, PhD<br />
Howard Bailit, DMD, PhD<br />
Veronica Myne, BA<br />
Kathy Roth, DDS<br />
This research was funded by Delta <strong>Dental</strong> of Wisconsin
Organization<br />
• Study Objectives<br />
• Methods<br />
• Major Findings<br />
• Baseline<br />
• Trends<br />
• Access disparities<br />
• Discussion
Definitions<br />
Need Vs. Dem<strong>and</strong>
Objectives<br />
• Determine Current/Future <strong>Supply</strong> <strong>and</strong><br />
Dem<strong>and</strong> <strong>for</strong> <strong>Dental</strong> Services<br />
• Estimate Surplus/Shortage DDS, RDH<br />
• Examine Policy Options to Reduce<br />
Access Disparities
Methods: Data Sources<br />
• Number Dentists<br />
• ADA master file<br />
• State of Wisconsin<br />
• Phone book/Websites<br />
• Number Licensed Hygienists<br />
• State t of Wisconsini<br />
• Practice survey
Methods: Data Sources<br />
• Survey Practice/Clinic Characteristics<br />
• Marquette Applicants, Students, Grads<br />
• Population Demographics<br />
• <strong>Dental</strong> Care Expenditures<br />
• Utilization Rates<br />
• Medicaid claims<br />
• Delta <strong>Dental</strong> claims
Methods: Analyses<br />
• Effective Dem<strong>and</strong><br />
• Population, dental expenses per capita<br />
• <strong>Supply</strong><br />
• Active dentists, new dentists, estimated<br />
retirees <strong>and</strong> productivity growth<br />
• Care <strong>for</strong> Underserved<br />
– Safety Net <strong>and</strong><br />
Private Practices
Baseline<br />
Work<strong>for</strong>ce
Private System, 2009<br />
Dentists*<br />
Mean Age (years) 52.0<br />
Female (%) 16.66<br />
Specialists (%) 17.1<br />
Marquette Grads (%) 60.9<br />
Dentists/Population 1/1,811<br />
Active Practitioners 3,142<br />
<strong>Dental</strong> Hygienists** 2,891<br />
<strong>Dental</strong> Assistants** 2,465<br />
*Total number including full <strong>and</strong> part-time<br />
** Estimated from survey
<strong>Dental</strong> Schools<br />
<strong>Dental</strong> School Number Percent<br />
Marquette 1,916 60.9<br />
Minnesota 360 11.4<br />
Iowa 163 5.2<br />
Illinois – Chicago 76 2.4<br />
Northwestern 56 1.7<br />
Loyola 57 1.7<br />
S. Illinois 22
Specialists<br />
Specialty Number Percentage<br />
Orthodontics 159 29.4<br />
Surgery 117 21.6<br />
Pediatrics 79 14.6<br />
Endodontics 63 11.6<br />
Prosthetics 56 10.3<br />
Periodontics 55 10.1<br />
Pathology 3
Dentist Occupations<br />
Occupation Number Percentage<br />
Full-Time Practice * 2,343 74.7<br />
Part-Time Practice 429 13.6<br />
Faculty 104 3.3<br />
Hospital 8
Dentist Age, 2010<br />
Age Group<br />
Percentage<br />
69 4.7
County <strong>Dental</strong> Work<strong>for</strong>ce<br />
Pop N DDS DDS Female Spec. POP/<br />
% Age % % DDS<br />
200K+ 4 43.8 51.5 18.4 22.1 1497<br />
100-200K 10 25.5 52.1 17.2 19.6 1810<br />
50-100K 13 17.1 52.5 15.1 12.0 1833<br />
25-50K 19 8.8 52.3 11.6 4.6 2622<br />
County Characteristics<br />
Pop N Pop $$ Badger Rent DMFS<br />
% % Index<br />
200K+ 4 36.6 $57.1 9.7 1.4 43.7<br />
100-200K 10 25.8 53.7 8.8 1.2 44.7<br />
50-100K 13 17.5 53.2 8.6 1.1 45.2<br />
25-50K 19 12.8 46.7 11.4 .9 46.7<br />
General Practice Survey, 2009<br />
Practice<br />
Dentist<br />
Dentists 1.82 -<br />
Operatories 5.34 2.93<br />
Office Space (SF) 2,866 1,592<br />
Hygienists 264 2.64 146 1.46<br />
<strong>Dental</strong> Assistants 2.25 1.24<br />
Other Staff 2.49 1.38<br />
Patient Visits 6,158 3,384<br />
DDS/Hours/Year 2,493 1,385<br />
Gross Billings $1,043,773 $639,732<br />
Net Income $422,875 $259,181
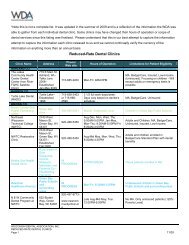
Safety Net Clinics, 2009<br />
FQHC Clinics* 15<br />
FTE Dentists 53<br />
Hygienists 38<br />
Other Staff 107<br />
Visits 140,058<br />
*Wisconsin Primary Care Association Survey
Trends<br />
Future Work<strong>for</strong>ce
Trends: 2000-2009<br />
• Number Dentists<br />
• 2000 2,979<br />
• 2009 3,142<br />
• Reasons <strong>for</strong> Difference<br />
• Growth Wisconsin GDP (5.4%/yr.)<br />
• More non-Wisconsin i dentists<br />
t<br />
• Fewer retirements<br />
• Marquette graduates
Trends: 2010-2020<br />
Year<br />
Population<br />
(000)<br />
Dentists<br />
Pop/DDS<br />
2010 5,751 3,161 1,820<br />
2012 5,822 3,199 1,821<br />
2014 5,894 3,239 1,822<br />
2016 5,966 3,278 1,822<br />
2018 6,038 3,318 1,822<br />
2020 6,110 3,358 1,823<br />
Change 6.25% 6.23% -
Growth DDS Productivity,<br />
<strong>Dental</strong> Dem<strong>and</strong>, 2010 - 2020<br />
Annual Growth<br />
Rate<br />
Dentist Productivity 2.61%<br />
Per Capita Dem<strong>and</strong>* 1.67%<br />
*6.25% Expected growth per capita dental expenditures<br />
p g p p p<br />
4.58% <strong>Dental</strong> CPI
Number Hygienists, <strong>Dental</strong><br />
Assistants, 2010-2020<br />
2010 2020<br />
Hygienists 2,891 3,085<br />
Assistants 2,465 2,630<br />
Annual Production<br />
RDH 172<br />
DA 219
Access Disparities
Access Problem<br />
Delta<br />
Medicaid<br />
Medicaid, Delta County<br />
Utilization Rates
HKD, Medicaid, Delta<br />
Utilization, 12 Month Enrollment<br />
100.0%<br />
80.0%<br />
60.0%<br />
40.0% 0%<br />
20.0%<br />
00% 0.0%<br />
Age<br />
Delta<br />
HKD<br />
Medicaid<br />
0 5 10 15 20 25<br />
2005
Comparison Medicaid <strong>and</strong><br />
Delta Fees<br />
• Medicaid/Delta Fees<br />
• Diagnostic Preventive 47.2%<br />
• Restorative 39.8%<br />
• Private Practice<br />
• Expenses/Gross Billings = 59.6%
Disparities<br />
Options
Reduce Disparities<br />
• Increase Medicaid Fees<br />
• Implement FQHC School Program<br />
• Exp<strong>and</strong> FQHC <strong>Dental</strong> Safety Net<br />
• Increase <strong>Supply</strong> Dentists
Conclusions<br />
• 2000–2009 Dentists Grew Faster than<br />
Population<br />
• 2010–2020 Estimate Dentist <strong>Supply</strong><br />
Grow Faster than Population Dem<strong>and</strong><br />
• Disparities Primarily Financial Problem<br />
• Many Options to Reduce Disparities