estimation of expected repair cost for detached breakwater
estimation of expected repair cost for detached breakwater
estimation of expected repair cost for detached breakwater

You also want an ePaper? Increase the reach of your titles
YUMPU automatically turns print PDFs into web optimized ePapers that Google loves.
eakwaters was investigated in this study.<br />
2.8 Assumptions and Conditions in Estimation<br />
The <strong>repair</strong> was assumed to be completed by the<br />
incidence <strong>of</strong> the maximum wave in the next year. In<br />
the <strong>repair</strong>, the pr<strong>of</strong>ile <strong>of</strong> the <strong>detached</strong> <strong>breakwater</strong> was<br />
restored to the initial configuration. The hydraulic<br />
per<strong>for</strong>mances <strong>of</strong> the <strong>repair</strong>ed <strong>detached</strong> <strong>breakwater</strong><br />
were assumed to be the same as that <strong>of</strong> the <strong>detached</strong><br />
<strong>breakwater</strong> just after the initial state.<br />
The number <strong>of</strong> the iteration in Monte Carlo<br />
simulation was 10,000. The interest used in the<br />
<strong>estimation</strong> <strong>of</strong> the total <strong>repair</strong> <strong>cost</strong> was 0.04. The<br />
duration <strong>of</strong> the incident N i wave was 4,000 waves.<br />
The constants <strong>for</strong> estimating the <strong>cost</strong> <strong>for</strong> <strong>repair</strong>ing<br />
the <strong>breakwater</strong> body were C ru = 14,000 JPY/m 3<br />
(JPY: Japanese Yen) and C r0 = 60,000 JPY/m 3 . The<br />
constants <strong>for</strong> estimating the <strong>cost</strong> equivalent to the<br />
amount <strong>of</strong> damage to the coastal zone behind the<br />
<strong>detached</strong> <strong>breakwater</strong> were C da = 8.25×10 7 JPY//m<br />
and C db = 7.8×10 6 JPY/m.<br />
3. RESULTS AND DISCUSSION<br />
3.1 Time Series in a Sample<br />
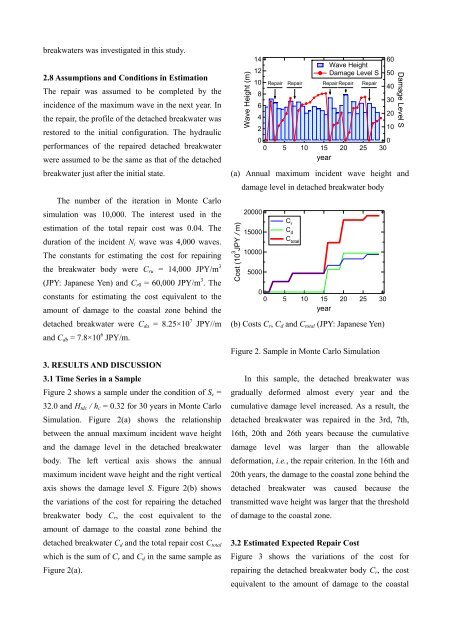
Figure 2 shows a sample under the condition <strong>of</strong> S c =<br />
32.0 and H tdc / h c = 0.32 <strong>for</strong> 30 years in Monte Carlo<br />
Simulation. Figure 2(a) shows the relationship<br />
between the annual maximum incident wave height<br />
and the damage level in the <strong>detached</strong> <strong>breakwater</strong><br />
body. The left vertical axis shows the annual<br />
maximum incident wave height and the right vertical<br />
axis shows the damage level S. Figure 2(b) shows<br />
the variations <strong>of</strong> the <strong>cost</strong> <strong>for</strong> <strong>repair</strong>ing the <strong>detached</strong><br />
<strong>breakwater</strong> body C r , the <strong>cost</strong> equivalent to the<br />
amount <strong>of</strong> damage to the coastal zone behind the<br />
<strong>detached</strong> <strong>breakwater</strong> C d and the total <strong>repair</strong> <strong>cost</strong> C total<br />
which is the sum <strong>of</strong> C r and C d in the same sample as<br />
Figure 2(a).<br />
(a) Annual maximum incident wave height and<br />
damage level in <strong>detached</strong> <strong>breakwater</strong> body<br />
Cost (10 3 JPY / m)<br />
Wave Height (m)<br />
14<br />
12<br />
10<br />
8<br />
6<br />
4<br />
2<br />
20000<br />
15000<br />
10000<br />
5000<br />
0<br />
0<br />
0<br />
0<br />
5<br />
5<br />
C r<br />
C d<br />
C total<br />
10<br />
10<br />
15<br />
year<br />
15<br />
year<br />
Wave Height<br />
Damage Level S<br />
Repair Repair Repair Repair Repair<br />
(b) Costs C r , C d and C total (JPY: Japanese Yen)<br />
Figure 2. Sample in Monte Carlo Simulation<br />
In this sample, the <strong>detached</strong> <strong>breakwater</strong> was<br />
gradually de<strong>for</strong>med almost every year and the<br />
cumulative damage level increased. As a result, the<br />
<strong>detached</strong> <strong>breakwater</strong> was <strong>repair</strong>ed in the 3rd, 7th,<br />
16th, 20th and 26th years because the cumulative<br />
damage level was larger than the allowable<br />
de<strong>for</strong>mation, i.e., the <strong>repair</strong> criterion. In the 16th and<br />
20th years, the damage to the coastal zone behind the<br />
<strong>detached</strong> <strong>breakwater</strong> was caused because the<br />
transmitted wave height was larger that the threshold<br />
<strong>of</strong> damage to the coastal zone.<br />
3.2 Estimated Expected Repair Cost<br />
Figure 3 shows the variations <strong>of</strong> the <strong>cost</strong> <strong>for</strong><br />
<strong>repair</strong>ing the <strong>detached</strong> <strong>breakwater</strong> body C r , the <strong>cost</strong><br />
equivalent to the amount <strong>of</strong> damage to the coastal<br />
20<br />
20<br />
25<br />
25<br />
0<br />
30<br />
30<br />
60<br />
50<br />
40<br />
30<br />
20<br />
10<br />
Damage Level S