Seismic Analysis of Water Supply Systems by Earthquake Scenario ...
Seismic Analysis of Water Supply Systems by Earthquake Scenario ...
Seismic Analysis of Water Supply Systems by Earthquake Scenario ...

Create successful ePaper yourself
Turn your PDF publications into a flip-book with our unique Google optimized e-Paper software.
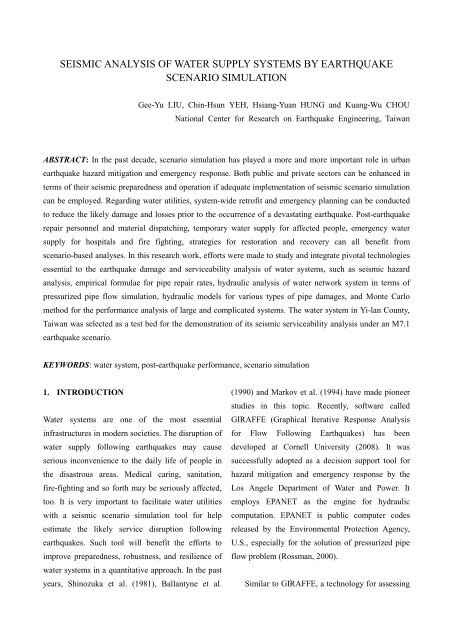
SEISMIC ANALYSIS OF WATER SUPPLY SYSTEMS BY EARTHQUAKE<br />
SCENARIO SIMULATION<br />
Gee-Yu LIU, Chin-Hsun YEH, Hsiang-Yuan HUNG and Kuang-Wu CHOU<br />
National Center for Research on <strong>Earthquake</strong> Engineering, Taiwan<br />
ABSTRACT: In the past decade, scenario simulation has played a more and more important role in urban<br />
earthquake hazard mitigation and emergency response. Both public and private sectors can be enhanced in<br />
terms <strong>of</strong> their seismic preparedness and operation if adequate implementation <strong>of</strong> seismic scenario simulation<br />
can be employed. Regarding water utilities, system-wide retr<strong>of</strong>it and emergency planning can be conducted<br />
to reduce the likely damage and losses prior to the occurrence <strong>of</strong> a devastating earthquake. Post-earthquake<br />
repair personnel and material dispatching, temporary water supply for affected people, emergency water<br />
supply for hospitals and fire fighting, strategies for restoration and recovery can all benefit from<br />
scenario-based analyses. In this research work, efforts were made to study and integrate pivotal technologies<br />
essential to the earthquake damage and serviceability analysis <strong>of</strong> water systems, such as seismic hazard<br />
analysis, empirical formulae for pipe repair rates, hydraulic analysis <strong>of</strong> water network system in terms <strong>of</strong><br />
pressurized pipe flow simulation, hydraulic models for various types <strong>of</strong> pipe damages, and Monte Carlo<br />
method for the performance analysis <strong>of</strong> large and complicated systems. The water system in Yi-lan County,<br />
Taiwan was selected as a test bed for the demonstration <strong>of</strong> its seismic serviceability analysis under an M7.1<br />
earthquake scenario.<br />
KEYWORDS: water system, post-earthquake performance, scenario simulation<br />
1. INTRODUCTION<br />
<strong>Water</strong> systems are one <strong>of</strong> the most essential<br />
infrastructures in modern societies. The disruption <strong>of</strong><br />
water supply following earthquakes may cause<br />
serious inconvenience to the daily life <strong>of</strong> people in<br />
the disastrous areas. Medical caring, sanitation,<br />
fire-fighting and so forth may be seriously affected,<br />
too. It is very important to facilitate water utilities<br />
with a seismic scenario simulation tool for help<br />
estimate the likely service disruption following<br />
earthquakes. Such tool will benefit the efforts to<br />
improve preparedness, robustness, and resilience <strong>of</strong><br />
water systems in a quantitative approach. In the past<br />
years, Shinozuka et al. (1981), Ballantyne et al.<br />
(1990) and Markov et al. (1994) have made pioneer<br />
studies in this topic. Recently, s<strong>of</strong>tware called<br />
GIRAFFE (Graphical Iterative Response <strong>Analysis</strong><br />
for Flow Following <strong>Earthquake</strong>s) has been<br />
developed at Cornell University (2008). It was<br />
successfully adopted as a decision support tool for<br />
hazard mitigation and emergency response <strong>by</strong> the<br />
Los Angele Department <strong>of</strong> <strong>Water</strong> and Power. It<br />
employs EPANET as the engine for hydraulic<br />
computation. EPANET is public computer codes<br />
released <strong>by</strong> the Environmental Protection Agency,<br />
U.S., especially for the solution <strong>of</strong> pressurized pipe<br />
flow problem (Rossman, 2000).<br />
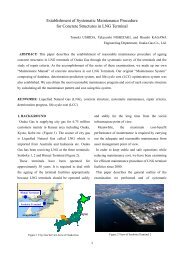
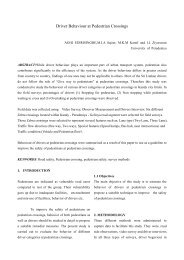
Similar to GIRAFFE, a technology for assessing
the post-earthquake performance <strong>of</strong> water systems<br />
has been developed at NCREE (Liu et al., 2010 &<br />
2011). It consists <strong>of</strong> several steps, as depicted in<br />
Figure 1. (1) estimate the seismic hazards (ground<br />
shaking and failure) <strong>of</strong> where the interested water<br />
network system locates, (2) simulate the locations <strong>of</strong><br />
pipe damages according to the hazards and pipe<br />
repair rates (numbers <strong>of</strong> repairs per unit pipe length<br />
caused <strong>by</strong> ground shaking and deformation,<br />
respectively), (3) classify the properties <strong>of</strong> each pipe<br />
damage (whether a break or a leak, and what which<br />
model <strong>of</strong> pipe leak if it is a leak; the probability<br />
model for pipe damages employed <strong>by</strong> GIRAFFE was<br />
adopted here), (4) modify the hydraulic model <strong>of</strong> the<br />
water network system to take into account the pipe<br />
damages, (5) execute EPANET and take out the<br />
water supply nodes affected <strong>by</strong> negative pressure<br />
from the solution. Details <strong>of</strong> these steps will be<br />
explained in the following sections.<br />
EQ source parameters<br />
ground motion attenuation<br />
site effect<br />
fault rupturing model<br />
liquefaction susceptibility<br />
liquefaction settlement model<br />
pipe repair rate<br />
pipe damage locating algorithm<br />
equipment vulnerability<br />
power outage<br />
…<br />
pipe damage hydraulic models<br />
EPANET s<strong>of</strong>tware<br />
pre- and post-processors<br />
EQ Event<br />
<strong>Seismic</strong> Hazards<br />
Ground<br />
Ground<br />
Shaking<br />
Failure<br />
Numbers <strong>of</strong><br />
Damage<br />
Pipe Damage<br />
and<br />
Malfunction<br />
Locations <strong>of</strong><br />
<strong>of</strong><br />
Pipe Damage<br />
Equipment<br />
Hydraulic <strong>Analysis</strong><br />
System Serviceability<br />
Figure 1 Flowchart for the serviceability assessment<br />
<strong>of</strong> water systems following earthquakes<br />
2. PIPE DAMAGE MODELING<br />
Repair rate (RR) is defined as the number <strong>of</strong> repairs<br />
(or damages) per unit pipe length (km). It is widely<br />
employed to indicate pipe fragility under seismic<br />
effects. Numerous investigations have been made to<br />
express the relationship between pipe repair rate and<br />
earthquake-induced ground shaking (e.g. peak<br />
ground acceleration, PGA) or ground failure (e.g.<br />
permanent ground displacement, PGD). The pipe<br />
material and diameter affect its repair rate, too. The<br />
empirical formulae for pipe repair rates have been<br />
proposed <strong>by</strong> the authors, which read (Liu et al.,<br />
2011):<br />
RR = C ⋅ RR 0<br />
RR<br />
0<br />
where<br />
RR PGA<br />
RR PGD<br />
= max[ RR ,RR ] + RR<br />
PGA<br />
=<br />
= 0.6445 ⋅ PGD<br />
PGDFault<br />
−3<br />
6.5756 × 10 ⋅ ( PGA −<br />
0.728<br />
PGDLiq<br />
100)<br />
0.878<br />
⋅ p<br />
where RR<br />
0<br />
is the standard pipe repair rate, C is<br />
an adjustment coefficient and is a function <strong>of</strong> pipe<br />
material and diameter, PGA and PGD are in<br />
cm/sec 2 and cm, respectively. The terms<br />
PGDFault<br />
,<br />
PGD<br />
Liq<br />
and p<br />
Liq<br />
represent the fault<br />
rupturing and soil liquefaction-induced PGDs, and<br />
the probability <strong>of</strong> occurrence <strong>of</strong> soil liquefaction,<br />
respectively.<br />
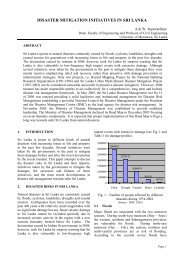
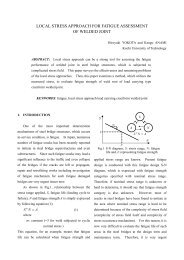
Conventionally, a stationary Poisson process is<br />
widely used to simulate the damage locations along a<br />
pipe. In this study, an approach based on the<br />
expected number <strong>of</strong> damages <strong>of</strong> pipes was otherwise<br />
proposed. From Figure 2, let the length <strong>of</strong> a typical<br />
pipe segment be L . Assume there are a total <strong>of</strong> N<br />
pipes in the water pipe network under study. Let all<br />
pipes be broken down into segments <strong>of</strong> constant<br />
length L from their beginning nodes (the length <strong>of</strong><br />
the last segment <strong>of</strong> each pipe may not equal L ), and<br />
be denoted as ( i , j)<br />
, where i refers to pipe i<br />
( i = 1,..., N ) and j refers to its j -th segment. The<br />
expected number <strong>of</strong> pipe damage <strong>of</strong> any pipe<br />
segment ( i , j)<br />
can be decided according to the<br />
segment length and the corresponding pipe repair<br />
Liq
ate. Denote this number as e ij<br />
. Starting with the<br />
origin <strong>of</strong> the number line, if all the expected numbers<br />
<strong>of</strong> pipe damage e<br />
11<br />
, e12,...,<br />
e21,<br />
e22,...,<br />
e NJ<br />
(where<br />
N<br />
J<br />
N<br />
refers to the last segment <strong>of</strong> pipe N ) can be<br />
sequentially accumulated as ( e 11<br />
), ( e<br />
11<br />
+ e12<br />
),<br />
( e ),<br />
11<br />
+ e12<br />
+ e13 ...,(<br />
e<br />
11<br />
+ e12<br />
+ ... + e NJ<br />
) and denoted<br />
N<br />
on the number line, then the interval [ 0, E<br />
R<br />
] , where<br />
E<br />
R<br />
equals to the summation <strong>of</strong> all the expected<br />
numbers <strong>of</strong> pipe damage, consists <strong>of</strong> as many<br />
sub-intervals as the number <strong>of</strong> all pipe segments with<br />
lengths e<br />
11<br />
, e12,...,<br />
e21,<br />
e22,...,<br />
e NJ<br />
. This also means<br />
N<br />
that there exists a one-on-one mapping between any<br />
real-number within [ 0, E<br />
R<br />
] and a specific pipe<br />
segment.<br />
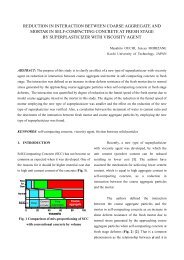
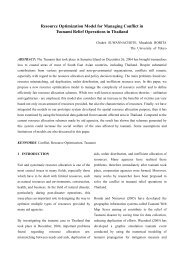
were adopted in this study. This model includes pipe<br />
break and various types <strong>of</strong> pipe leaks, and the<br />
probability that each will occur in various pipe<br />
materials, and also the hydraulic models and<br />
parameters for each type <strong>of</strong> pipe damage. Following<br />
their findings from water pipelines and their<br />
damages in past earthquakes in the U.S., water pipe<br />
materials could be classified into 5 types: cast iron,<br />
ductile iron, jointed concrete, riveted steel and<br />
welded steel. Furthermore, there are five different<br />
types <strong>of</strong> pipe leaks, namely the annular<br />
disengagement, round crack, longitudinal crack,<br />
local loss <strong>of</strong> pipe wall, and local tear <strong>of</strong> pipe wall at<br />
welded slip joint, as illustrated in Figure 3.<br />
Conventional approach:<br />
Assume that pipe damage follows a Poisson process<br />
Proposed approach:<br />
0<br />
Accumulated<br />
number <strong>of</strong> pipe<br />
damage points<br />
E R<br />
Generate a random number within [0, E R ], designate the location, and repeat E R times<br />
Figure 2 Comparison between the conventional and<br />
the proposed approaches for simulating pipe damage<br />
locations probabilistically<br />
To simulate a location <strong>of</strong> damage along the pipe,<br />
first, an arbitrary number between 0 and E<br />
R<br />
can be<br />
generated using a random number generator that<br />
follows uniform distribution. It will refer to one<br />
single segment, say e nm<br />
, along the axis <strong>of</strong> number<br />
line. Finally, the midpoint <strong>of</strong> the m -th segment <strong>of</strong><br />
the n -th pipe is designated as a pipe damage<br />
location. The same process can be repeated E R<br />
times to determine all pipe damage locations.<br />
The hydraulic models for pipe damages<br />
proposed in GIRAFFE (Cornell University, 2008)<br />
Figure 3 Schematic diagrams <strong>of</strong> the 5 types <strong>of</strong> pipe<br />
leaks (Cornell University, 2008)<br />
GIRAFFE further proposed the hydraulic models<br />
for pipe breaks and leaks, respectively. A pipe break<br />
and its hydraulic model can be depicted as the left<br />
schematic diagram in Figure 4. At each <strong>of</strong> the broken<br />
ends, a reservoir and a short pipe with a check valve<br />
are needed being added to mimic the mechanism <strong>of</strong><br />
water flowing into the atmosphere. To take into<br />
account the effect <strong>of</strong> a pipe break in simulation,<br />
several steps to modify the hydraulic model <strong>of</strong> the<br />
broken water system should be taken. They are: (1)<br />
Decide the location and elevation <strong>of</strong> pipe break point,<br />
(2) Remove the original link (pipe segment), (3) Add<br />
two new nodes A and B at the location <strong>of</strong> pipe break<br />
point, (4) Add two new links connecting the original
pipe segment ends to A and B, respectively, (5) Add<br />
two new nodes A’ and B’ with the elevation <strong>of</strong> pipe<br />
break point and designate them as reservoirs, and<br />
finally (6) Add two new links connecting A-A’ and<br />
B-B’ and specify them with one-way check valves.<br />
Figure 5 Hydraulic model for a pipe leak (Cornell<br />
University, 2008)<br />
3. HYDRAULIC ANALYSIS AND NEGATIVE<br />
PRESSURE ISSUE<br />
Figure 4 Hydraulic model for a pipe break (Cornell<br />
University, 2008)<br />
On the other hand, a pipe leak and its hydraulic<br />
model could be depicted as the right schematic<br />
diagram in Figure 5. A pipe leak is hydraulically<br />
equivalent to a sprinkler with a specific discharge<br />
coefficient and an orifice size. This sprinkler is<br />
further proven to be equivalent to a fictitious pipe<br />
linking the original pipe and an added reservoir. A<br />
check valve is designated to the fictitious pipe<br />
ensuring that water flows from the leaking pipe to<br />
the reservoir. The steps to modify the hydraulic<br />
model <strong>of</strong> the leaking water system could be<br />
summarized as follows: (1) Decide the location and<br />
elevation <strong>of</strong> pipe leak point, (2) Remove the original<br />
link (pipe segment), (3) Add a new node A at the<br />
location <strong>of</strong> pipe leak point, (4) Add two new links<br />
connecting the original pipe segment ends to A, (5)<br />
Add a new node A’ with the elevation <strong>of</strong> pipe leak<br />
point and designate it as a reservoir, and finally (6)<br />
Add a new link connecting A and A’ and specify it as<br />
a fictitious pipe with a diameter <strong>of</strong> corresponding<br />
pipe leak model, and also specify it with a one-way<br />
check valve.<br />
Figure 6 depicts the schematic diagram <strong>of</strong> a<br />
simplified water network. A water network system<br />
usually consists <strong>of</strong> tanks, reservoirs, pumps, valves<br />
and numerous pipes and nodes. The hydraulics <strong>of</strong><br />
such a system can be assumed as pressurized pipe<br />
flows, and can be solved <strong>by</strong> using two sets <strong>of</strong><br />
equations (Rossman, 2000). Let there be N nodes,<br />
NF fixed nodes (e.g. tanks and reservoirs) and K<br />
pipes in a water network, then the first set prescribe<br />
the difference <strong>of</strong> water head at the ends <strong>of</strong> each pipe<br />
and read:<br />
H − H<br />
i<br />
j<br />
= h<br />
ij<br />
= r ⋅Q<br />
n<br />
ij<br />
+ m ⋅Q<br />
where H , h ,Q , r , n and m are the nodal head, head<br />
loss, flow rate, resistance coefficient, flow exponent<br />
and minor loss coefficient, respectively. The most<br />
widely used empirical formulae for the pipe<br />
resistance coefficient are the Darcy-Weisbach,<br />
Hazen-Williams or Chezy-Manning equation, all <strong>of</strong><br />
which employ flow rate and various pipe parameters.<br />
The second set prescribes the balance <strong>of</strong> flow at each<br />
node and read:<br />
∑<br />
j<br />
Q − D = 0<br />
ij<br />
i<br />
2<br />
ij
where<br />
D<br />
i<br />
is the demand at node i . By using these<br />
two sets <strong>of</strong> equations, the pipe flow can be solved in<br />
terms <strong>of</strong> the water heads H<br />
i<br />
at N nodes and the<br />
pipe flow rate Q (from node j to node i ) in<br />
K pipes.<br />
ij<br />
(4) Perform hydraulic analysis using EPANET.<br />
(5) Check the pressure at all nodes from the result <strong>of</strong><br />
Step (4) and, following the approach proposed <strong>by</strong><br />
Ballantyne et al. (1990) to eliminate the negative<br />
pressure and summarize the water supply <strong>by</strong><br />
excluding the demands (supplies) at nodes <strong>of</strong><br />
negative pressure.<br />
Read input file for the hydraulic<br />
analysis <strong>of</strong> the water system<br />
Figure 6 The schematic diagram <strong>of</strong> a simplified<br />
hydraulic network (Rossman, 2000)<br />
The procedure for assessing the post-earthquake<br />
performance <strong>of</strong> a water system is illustrated in the<br />
flowchart in Figure 7, which reads:<br />
Modify input file according to<br />
the simulated pipeline damage<br />
Pipeline damage causes<br />
any node disconnected<br />
from the system network<br />
YES<br />
Remove the disconnected nodes<br />
NO<br />
(1) Read the input file for the hydraulic analysis <strong>of</strong><br />
the interested water system. This file is usually<br />
prepared <strong>by</strong> the water utilities and is compatible<br />
with the employed analysis s<strong>of</strong>tware in terms <strong>of</strong><br />
data formatting. All attributes <strong>of</strong> the components<br />
in the water system (e.g. reservoirs, tanks, pumps,<br />
nodes and pipes) are defined in the file.<br />
(2) Simulate the pipeline damage <strong>of</strong> the water system<br />
based on an earthquake scenario. A pre-processor<br />
has been developed in this study to decide the<br />
locations and attributes <strong>of</strong> pipe breaks and leaks<br />
in the pipeline network in a probabilistic way, and<br />
then to modify the input file according to the<br />
simulated pipeline damage. It takes into account<br />
the seismic hazard and the pipe repair rate, and<br />
the pipe damage models Proposed in GIRAFFE<br />
(Cornell University, 2008) were employed.<br />
(3) Check the connectivity <strong>of</strong> all nodes to the system<br />
with simulated pipeline damage. Remove the<br />
disconnected nodes <strong>by</strong> further modifying the<br />
input file.<br />
Pre-processor<br />
Perform hydraulic<br />
analysis using EPANET<br />
Post-processor<br />
Negative pressure<br />
NO<br />
occurs at any node<br />
YES<br />
Remove water supply at nodes <strong>of</strong> negative pressure<br />
Evaluate the serviceability <strong>of</strong> the damaged water system<br />
End<br />
Figure 7 Flowchart for assessing post-earthquake<br />
performance <strong>of</strong> a water system<br />
While performing hydraulic analysis <strong>of</strong> a water<br />
network with pipe damage, it is likely to predict<br />
negative pressure at some nodes. Negative pressure<br />
is generated due to the assumption that the pipe<br />
flows are always full and pressurized. However,<br />
water pipelines are not air-tight, especially when
they are damaged. As a result, hydraulic analysis <strong>of</strong> a<br />
damaged water network tends toward overestimating<br />
its ability to convey water. Elimination <strong>of</strong> negative<br />
pressure under such circumstance is therefore<br />
advised. In this study, the approach proposed <strong>by</strong><br />
Ballantyne et al. (1990), which assumes that no<br />
water will flow through negative pressure nodes, was<br />
employed in Step 5 <strong>of</strong> the assessment procedure.<br />
Pipes<br />
Junctions<br />
Tanks or reservoirs<br />
礁 溪 鄉<br />
員 山 鄉<br />
宜 蘭 市<br />
頭 城 鎮<br />
壯 圍 鄉<br />
4. CASE STUDY<br />
三 星 鄉<br />
五 結 鄉<br />
羅 東 鎮<br />
The <strong>of</strong>f-shore <strong>of</strong> eastern coast is one <strong>of</strong> the most<br />
earthquake-prone areas in Taiwan region. In this<br />
study, the water system in Yi-lan County, one <strong>of</strong> the<br />
three counties in East Taiwan, was chosen as the test<br />
bed for the implementation <strong>of</strong> the proposed ESLE<br />
technology. The water system in Yi-lan County is<br />
operated <strong>by</strong> the Eighth Branch <strong>of</strong> the Taiwan <strong>Water</strong><br />
Corporation. Its service area is 814 kilometer square.<br />
The total pipe length is approximately 2,600 km. The<br />
system serves 150,500 customers or 427,000 people,<br />
with an average supply <strong>of</strong> 162,395 CMD (2010). The<br />
major pipes include PVC pipes (63%), ductile iron<br />
pipes (26%), HIWP (high-impact PVC) pipes (6%)<br />
and cast iron pipes (1%). The entire system is<br />
simplified as a hydraulic node-and-link network,<br />
depicted in Figure 8, with a total <strong>of</strong> 358 nodes and<br />
439 links.<br />
Consider an earthquake occurring <strong>of</strong>f-shore<br />
Yi-lan County. The earthquake magnitude is 7.1, the<br />
epicenter locates at the coordinates <strong>of</strong> ( 121.88<br />
E,<br />
24.28<br />
N ) and the focal depth is 20km. Assume that<br />
the source mechanism is a horizontal line source <strong>of</strong><br />
84.2km with north-south orientation. The ground<br />
shaking and ground failure induced <strong>by</strong> this scenario<br />
earthquake can be simulated <strong>by</strong> TELES and be<br />
illustrated as Figure 9.<br />
冬 山 鄉<br />
蘇 澳 鎮<br />
Figure 8 The water system in Yi-lan County<br />
PGA<br />
PGD ( 土 壤 液 化 )<br />
PGA (g)<br />
PGD (cm)<br />
y<br />
0.54 to 0.6<br />
45 to 50<br />
0.48 to 0.54<br />
40 to 45<br />
0.42 to 0.48<br />
35 to 40<br />
0.36 to 0.42<br />
30 to 35<br />
0.3 to 0.36<br />
25 to 30<br />
0.24 to 0.3<br />
20 to 25<br />
0.18 to 0.24<br />
15 to 20<br />
0.12 to 0.18<br />
10 to 15<br />
0.06 to 0.12<br />
5 to 10<br />
0 to 0.06<br />
0 to 5 (<br />
Figure 9 Simulated distribution <strong>of</strong> PGA (left) and<br />
liquefaction-induced PGD (right) in Yi-lan County<br />
under the M7.1 scenario earthquake<br />
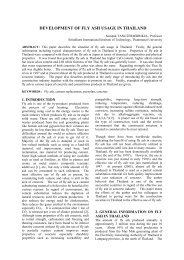
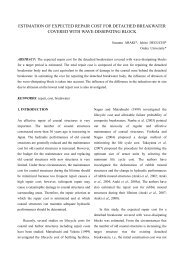
The Monte Carlo method was employed to<br />
estimate the average post-earthquake serviceability<br />
<strong>of</strong> the system. One hundred times <strong>of</strong> simulation were<br />
performed, and the pipe breaks and leaks due to<br />
ground shaking and failure were decided according<br />
to a random process in each run. The simulation<br />
results are depicted in Figure 10. Here, the<br />
serviceability index (SI), defined as the ratio <strong>of</strong> flow<br />
at demand nodes after and before an earthquake, is
used to quantify the system’s ability to meet the<br />
demand in each town. Under this scenario, the worst<br />
reduction in SI occurs in Tou-cheng (0.3521), while<br />
the other two worst reductions occur in Zhuangwei<br />
(0.5091) and Jiao-xi (0.5430), respectively.<br />
Serviceability Index<br />
0 to 0.1<br />
0.1 to 0.2<br />
0.2 to 0.3<br />
0.3 to 0.4<br />
0.4 to 0.5<br />
0.5 to 0.6<br />
0.6 to 0.7<br />
0.7 to 0.8<br />
0.8 to 0.9<br />
0.9 to 1<br />
1 to 1<br />
礁 溪 鄉<br />
頭 城 鎮<br />
system in terms <strong>of</strong> the serviceability index (SI) <strong>of</strong><br />
each service area was simulated.<br />
ACKNOWLEDGEMENT<br />
The research funding from <strong>Water</strong> Resource Agency,<br />
MOEA, Taiwan under Grants MOEA-WRA-<br />
0990095 and MOEA-WRA-1000090 is gratefully<br />
acknowledged. This research was made possible<br />
through kind helps from the Taiwan <strong>Water</strong><br />
Corporation for providing technical assistance and<br />
database.<br />
員 山 鄉<br />
宜 蘭 市<br />
壯 圍 鄉<br />
REFERENCES<br />
三 星 鄉<br />
五 結 鄉<br />
羅 東 鎮<br />
Ballantyne, D. B., Berg, E., Kennedy, J., Reneau, R.<br />
and Wu, D. (1990). <strong>Earthquake</strong> Loss Estimation<br />
大 同 鄉<br />
冬 山 鄉<br />
蘇 澳 鎮<br />
Modeling <strong>of</strong> the Seattle <strong>Water</strong> System, Technical<br />
Report, Kennedy/Jenks/Chilton, Federal Way, WA.<br />
南 澳 鄉<br />
Cornell University. (2008). GIRAFFE User’s<br />
Manual, School <strong>of</strong> Civil & Environmental Eng.,<br />
Cornell University, Ithaca, NY.<br />
Figure 10 The simulated serviceability <strong>of</strong> Yi-lan’s<br />
water system under the M7.1 scenario earthquake<br />
5. CONCLUDING REMARKS<br />
A technology for assessing the seismic performance<br />
<strong>of</strong> water systems has been developed. Key issues<br />
including models <strong>of</strong> strong motion attenuation and<br />
pipe repair rate, and the pipe damage model have<br />
explained. Particularly, a new approach for the<br />
simulation <strong>of</strong> pipe damage locations based on the<br />
expected number <strong>of</strong> damages <strong>of</strong> pipe segment has<br />
been proposed. The water network system in Yi-lan<br />
County, Taiwan was employed as a test bed for case<br />
study. A major earthquake occurring <strong>of</strong>f-shore was<br />
considered. The post-earthquake performance <strong>of</strong> the<br />
Liu, G.-Y., Chung, L.-L., Yeh, C.-H., Wang, R.-Z.,<br />
Chou, K.-W., Hung, H.-Y., Chen, S.-A., Chen, Z.-H.<br />
and Yu, S.-H. (2010). A Study on Pipeline <strong>Seismic</strong><br />
Performance and System Post-<strong>Earthquake</strong> Response<br />
<strong>of</strong> <strong>Water</strong> Utilities (1/2), Technical Report MOEA-<br />
WRA-0990095, <strong>Water</strong> Resource Agency, MOEA,<br />
Taipei.<br />
Liu, G.-Y., Chung, L.-L., Huang, C.-W., Yeh, C.-H.,<br />
Chou, K.-W., Hung, H.-Y., Chen, Z.-H., Chou, C.-H.<br />
and Tsai, L.-C. (2011). A Study on Pipeline <strong>Seismic</strong><br />
Performance and System Post-<strong>Earthquake</strong> Response<br />
<strong>of</strong> <strong>Water</strong> Utilities (2/2), Technical Report MOEA-<br />
WRA-1000090, <strong>Water</strong> Resource Agency, MOEA,<br />
Taipei.
Markov, I. Grigoriu, M. D. and O’Rourke, T. D.<br />
(1994). An Evaluation <strong>of</strong> <strong>Seismic</strong> Serviceability<br />
<strong>Water</strong> <strong>Supply</strong> Networks with Application to the San<br />
Francisco Auxiliary <strong>Water</strong> <strong>Supply</strong> System, Technical<br />
Report NCEER-94-0001, National Center for<br />
<strong>Earthquake</strong> Engineering Research, Buffalo, NY.<br />
Rossman, L.A. (2000). EPANET 2 User’s Manual,<br />
EPA (U.S. Environmental Protection Agency),<br />
Cincinnati, OH.<br />
Shinozuka, M, Tan, R. Y. and Toike, T. (1981).<br />
Serviceability <strong>of</strong> <strong>Water</strong> Transmission <strong>Systems</strong> under<br />
<strong>Seismic</strong> Risk, Lifeline <strong>Earthquake</strong> Engineering, the<br />
Current State <strong>of</strong> Knowledge, ASCE, New York, NY.<br />
Yeh, C. H., Loh, C.-H. and Tsai, K.C. (2003).<br />
“Development <strong>of</strong> <strong>Earthquake</strong> Assessment Methodology<br />
in NCREE,” Proc. Joint NCREE/JRC Workshop<br />
Int. Collaboration on <strong>Earthquake</strong> Disaster<br />
Mitigation Research, Technical Report NCREE-03<br />
-029, pp.83–92, Taipei.