Interactive poster - SoHO - Nasa
Interactive poster - SoHO - Nasa
Interactive poster - SoHO - Nasa

Create successful ePaper yourself
Turn your PDF publications into a flip-book with our unique Google optimized e-Paper software.
Measure the Motion of a Coronal<br />
Mass Ejection<br />
Activity: Calculate the velocity and acceleration of a coronal mass ejection (CME)<br />
based on its position in a series of images from the Large-Angle Spectrometric Coronograph<br />
(LASCO) instrument on SOHO.<br />
Materials: ruler, calculator, and a set of CME images from the LASCO instrument<br />
on SOHO. You can use the ones shown here or gather a set from<br />
http://soho.nascom.nasa.gov/classroom/lessons/rdat_cme_imgs.html<br />
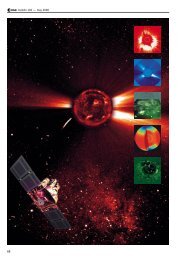
Background: An important part of space weather research is to measure the velocity<br />
of CMEs and their acceleration as they leave the Sun. This is done by tracing features<br />
in the CME and measuring their positions at different times. In the sequence<br />
of images shown on the right, you can see a CME erupting from the Sun on the<br />
right side of the coronagraph disk. The white circle shows the size and location of<br />
the Sun. The black disk is the occulting disk that blocks the surface of the Sun and<br />
the inner corona. The lines along the bottom of the image mark off units of the Sun’s<br />
diameter.<br />
Procedure: Select a feature of the CME that you can see in all five images—for instance,<br />
the outermost extent of the cloud, or the inner edge. Measure its position in<br />
each image. Your measurements can be converted to kilometers using a simple ratio:<br />
actual distance of feature from Sun<br />
diameter of the Sun (1.4 million km)<br />
=<br />
position of feature as measured on image<br />
diameter of Sun as measured on image<br />
Using the distance from the Sun and the time (listed on each image), you can calculate<br />
the average velocity. Velocity is defined as the rate of change of position. Using<br />
the changes in position and time, the velocity for the period can be calculated using<br />
the following equation: v = (s 2<br />
- s 1<br />
) / (t 2<br />
- t 1<br />
), where s 2<br />
is the position at time, t 2<br />
; s 1<br />
is<br />
the position at time, t 1<br />
. The acceleration equals the change in velocity over time; that<br />
is, a = (v 2<br />
- v 1<br />
) / (t 2<br />
- t 1<br />
), where v 2<br />
is the velocity at time t 2<br />
; v 1<br />
is the velocity at time<br />
t 1<br />
. You can record your results in a table.<br />
Universal Time Time Interval Position Avg. Velocity Avg. Acceleration<br />
8:05<br />
8:36<br />
9:27<br />
10:25<br />
11:23<br />
To see a video clip of this CME, go to: http://soho.nascom.nasa.gov/classroom/lasco_cme.mov<br />
Further Questions and Activities<br />
• Select another feature, trace it, and calculate the velocity and acceleration. Is it<br />
different from the velocity and acceleration of the other feature you measured Scientists<br />
often look at a number of points in the CME to get an overall idea of what is<br />
happening.<br />
• How does the size of the CME change with time What kind of forces might be<br />
acting on the CME How would these account for your data