Interactive poster - SoHO - Nasa
Interactive poster - SoHO - Nasa
Interactive poster - SoHO - Nasa

You also want an ePaper? Increase the reach of your titles
YUMPU automatically turns print PDFs into web optimized ePapers that Google loves.
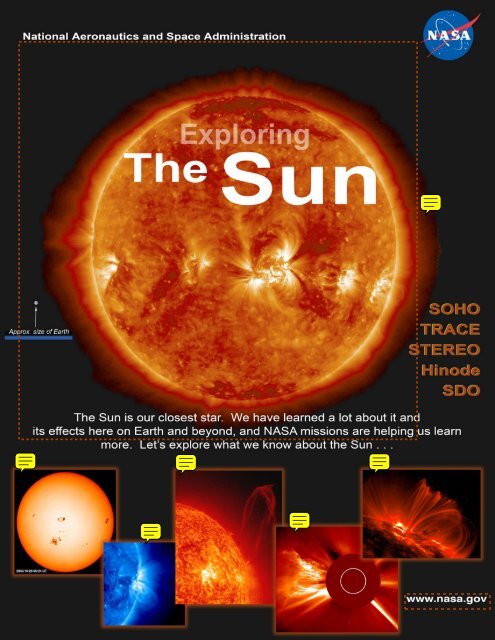
Our Star, The Sun<br />
Looking up at the sky with the naked eye, the Sun seems static, constant. It provides the warmth and light that<br />
supports life on Earth. From the ground, the only noticeable variations in the Sun are its location (where will it rise<br />
and set today) and its color (will the atmosphere make it<br />
turn pink or orange) Scientists have learned a lot more<br />
about the Sun in the past 400 years. We know that the<br />
Sun is the center of our solar system and it rotates about<br />
every 27 days. At its core a huge thermonuclear reactor<br />
fuses hydrogen atoms into helium, its two most common<br />
elements, producing million degree temperatures. Near its<br />
surface, the Sun is like a pot of boiling water, with bubbles<br />
of hot, electrified gas—actually electrons and protons in<br />
a fourth state of matter known as plasma—circulating up<br />
from the interior, rising to the surface, and bursting out<br />
into space. The surface temperature is a much milder 6,000<br />
degree C.<br />
How big is it The Sun is basically an average star in<br />
size and shares many similarities with most stars. The Sun<br />
is about one million miles (1.6 million km) across, which<br />
means that almost 110 Earths could be placed side by side<br />
across it. Even more astonishing, one million Earths could<br />
fit inside it, like gum balls in a bubble gum machine. Yet,<br />
since Earth is 93 million miles (150 million km) away from it, the Sun hardly seems to be so huge, appearing from<br />
Earth to be about the size of the Moon. The relatively small Moon, though, is a mere 250,000 miles (400,000 km)<br />
from Earth -- that’s why it appears to be Sun-sized. The next closest star, Alpha Centauri, is over four light years<br />
away (the distance that light travels in one year is a light year) and just<br />
twinkles in the night sky like the other stars. Because the Sun is by far<br />
our closest star, we can learn a great deal about all stars by studying it.<br />
Sunspots<br />
Sunspots are dark splotches on the Sun caused by the appearance<br />
of cooler (3000 degrees Celsius) areas amidst the roiling gases on<br />
the surface (6000 degrees C). These areas are cooler because intense<br />
magnetic fields, 1000 times stronger than the magnetic field of Earth,<br />
prevent hot plasma from rising<br />
to the surface. An average<br />
sunspot is about the size of<br />
Earth. The largest ones can<br />
be 20 times the size of Earth.<br />
These spots are often the source<br />
of solar storms like the larger<br />
Close-up of a sunspot<br />
Major parts of the Sun<br />
Credit: Swedish Solar Telescope<br />
Several large sunspots<br />
coronal mass ejections (CMEs) and smaller, but more intense, solar flares.<br />
Many people do not realize that the Sun goes through an 11-year solar<br />
cycle of activity, usually measured by the numbers of sunspots. At its peak,<br />
the Sun sports a large number of spots, many of them quite big; near its<br />
minimum period, there are often no sunspots at all. The next peak period of<br />
high activity should occur around 2012. The number of solar storms also changes with the solar cycle. At its peak,<br />
the Sun can produce many solar storms a day.<br />
Credit: SOHO, NASA/ESA
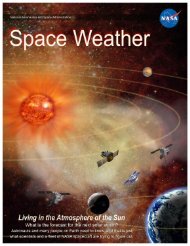
Space Weather from the Sun<br />
One of the most important solar events from Earth’s perspective is the coronal mass ejection (CME), the solar<br />
equivalent of a hurricane. A CME is the eruption of a huge bubble of plasma from the Sun’s outer atmosphere, or corona.<br />
The corona is the gaseous region above the surface that extends millions of miles into space. Thin and faint compared<br />
to the Sun’s surface, the corona is only visible to the naked eye during a total solar eclipse. Complicated magnetic<br />
fields extend from the interior to create great arches and loops above the surface. The buildup and interaction of these<br />
magnetic loops seems to supply the energy to produce the violent<br />
explosion of a CME.<br />
The magnetic loops of the Sun’s field are believed to hold<br />
down the newer fields emerging from below the surface. They also<br />
tie down the hot plasma carried by those fields, much like a net<br />
holding down a hot-air balloon. Scientists suggest that this causes<br />
tremendous upward pressure to build until the magnetic field<br />
breaks apart, allowing a CME to escape at high speed.<br />
A CME plasma cloud races through space at speeds from near<br />
one million miles per hour (400 km/sec) to 5 million mph, which<br />
Solar storm striking Earth’s magnetic shield<br />
means if it is directed towards Earth, it would reach us in one<br />
to five days. A typical CME can carry more than 10 billion tons<br />
of plasma into the solar system, a mass equal to that of 100,000<br />
battleships. The energy in the bubble of solar plasma is comparable<br />
(shown in blue)<br />
to a hundred hurricanes. Its energy and magnetic fields associated with that plasma impact Earth’s protective magnetic<br />
shield in space (the magnetosphere).<br />
What are the effects on Earth and its people The energy from<br />
a CME does not directly reach the surface of Earth. The cloud is<br />
blocked by our own magnetosphere, then slides around to the back<br />
side of Earth, where it can inject energy into Earth’s magnetosphere,<br />
exciting particles trapped there. Under certain conditions, the particles<br />
follow the magnetic field lines down to Earth near the Poles. The<br />
visible signs of this activity are beautiful aurora (often called Northern<br />
and Southern lights), shimmering curtains of colorful glowing<br />
lights seen in the night sky (right). However, at times various kinds of<br />
technology suffer harmful effects: satellites fail, electric generators get<br />
overloaded; and communication and navigation equipment become<br />
disrupted. Astronauts can even become ill by solar storm radiation.<br />
Scientists at NASA are working hard to find ways to better<br />
observe and then predict when these solar storms will occur<br />
and how Earth will respond. The graphic (left) identifies all of<br />
the current (white) and future (yellow) missions involved in<br />
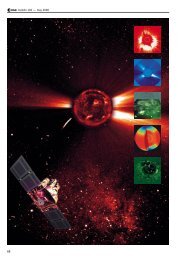
this effort. The Solar and Heliospheric Observatory (SOHO)<br />
spacecraft (launched 1995) has been a major workhorse for solar<br />
studies, observing the Sun 24/7 with 12 instruments. TRACE<br />
(1999) studies smaller areas of the Sun’s surface in greater detail.<br />
STEREO (2006) observes the Sun from two separate spacecraft<br />
that can provide a 3D perspective of solar events. Hinode<br />
(2007) captures very detailed images and data on the Sun. And<br />
the Solar Dynamics Observatory (2008) will essentially take<br />
over SOHO’s role, but bring to bear new and greatly enhanced<br />
instruments. Together with the other spacecraft and projects in<br />
place, NASA will be able to model all types solar activity and<br />
impacts from the Sun to Earth and even beyond. If human<br />
spaceflight is going to carry astronauts to the Moon, Mars, and<br />
NASA’s fleet of solar and magnetospheric missions (not to scale)<br />
Credit: SOHO, NASA/ESA<br />
even further, we need to know much more about predicting<br />
solar storms.<br />
Credit: Dominic Cantin
Measure the Motion of a Coronal<br />
Mass Ejection<br />
Activity: Calculate the velocity and acceleration of a coronal mass ejection (CME)<br />
based on its position in a series of images from the Large-Angle Spectrometric Coronograph<br />
(LASCO) instrument on SOHO.<br />
Materials: ruler, calculator, and a set of CME images from the LASCO instrument<br />
on SOHO. You can use the ones shown here or gather a set from<br />
http://soho.nascom.nasa.gov/classroom/lessons/rdat_cme_imgs.html<br />
Background: An important part of space weather research is to measure the velocity<br />
of CMEs and their acceleration as they leave the Sun. This is done by tracing features<br />
in the CME and measuring their positions at different times. In the sequence<br />
of images shown on the right, you can see a CME erupting from the Sun on the<br />
right side of the coronagraph disk. The white circle shows the size and location of<br />
the Sun. The black disk is the occulting disk that blocks the surface of the Sun and<br />
the inner corona. The lines along the bottom of the image mark off units of the Sun’s<br />
diameter.<br />
Procedure: Select a feature of the CME that you can see in all five images—for instance,<br />
the outermost extent of the cloud, or the inner edge. Measure its position in<br />
each image. Your measurements can be converted to kilometers using a simple ratio:<br />
actual distance of feature from Sun<br />
diameter of the Sun (1.4 million km)<br />
=<br />
position of feature as measured on image<br />
diameter of Sun as measured on image<br />
Using the distance from the Sun and the time (listed on each image), you can calculate<br />
the average velocity. Velocity is defined as the rate of change of position. Using<br />
the changes in position and time, the velocity for the period can be calculated using<br />
the following equation: v = (s 2<br />
- s 1<br />
) / (t 2<br />
- t 1<br />
), where s 2<br />
is the position at time, t 2<br />
; s 1<br />
is<br />
the position at time, t 1<br />
. The acceleration equals the change in velocity over time; that<br />
is, a = (v 2<br />
- v 1<br />
) / (t 2<br />
- t 1<br />
), where v 2<br />
is the velocity at time t 2<br />
; v 1<br />
is the velocity at time<br />
t 1<br />
. You can record your results in a table.<br />
Universal Time Time Interval Position Avg. Velocity Avg. Acceleration<br />
8:05<br />
8:36<br />
9:27<br />
10:25<br />
11:23<br />
To see a video clip of this CME, go to: http://soho.nascom.nasa.gov/classroom/lasco_cme.mov<br />
Further Questions and Activities<br />
• Select another feature, trace it, and calculate the velocity and acceleration. Is it<br />
different from the velocity and acceleration of the other feature you measured Scientists<br />
often look at a number of points in the CME to get an overall idea of what is<br />
happening.<br />
• How does the size of the CME change with time What kind of forces might be<br />
acting on the CME How would these account for your data
Mapping Magnetic Fields<br />
Objectives: Students will learn about the poles of bar magnets, detect and draw a magnetic field using compasses, and that<br />
magnets have invisible magnetic fields, just as the Earth and Sun have magnetic fields.<br />
Materials (per group of two students): two compasses; 2 Alnico bar magnets; 4 sheets of 8” x 11” paper; paper clips; pencils;<br />
ruler; tape.<br />
Pre-Activity: Ask students about their experiences with magnetism and their ideas about what it is and what causes it. Ask<br />
whether or not Earth is magnetic and how they know this. Also what a magnetic compass is and what it does.<br />
Procedures:<br />
Step 1 -- Allow students to experiment with the magnets. Suggest they try to get the magnets to attract and repel each<br />
other and other objects like paper clips and rulers.<br />
Step 2 -- Teach the students how a compass works by having them hold the compass so the disk is horizontal and the N-S<br />
(North-South) markings are facing up. Have them align the line marked “N” with the arrow inside the compass. Explain<br />
how compasses are used in the wilderness.<br />
Step 3 -- Have each group tape some white paper together and place the bar<br />
magnets on top and in the middle of the taped paper. Tell them that they will<br />
now begin to trace the magnetic force field. To make the tracings, have them<br />
do the following:<br />
a. Draw a dot somewhere near the magnet and place the center of the<br />
compass over it.<br />
b. Draw a dot at the location of the arrowhead (or tail) of the compass<br />
needle.<br />
c. Move the compass center to this new dot and again draw a dot at the<br />
location of the compass needle head (or tail).<br />
d. Remove the compass from the paper and draw lines connecting the dots<br />
with arrows indicating the direction that the compass points.<br />
e. Repeat steps c and d until the line meets with the magnet or paper’s<br />
edge.<br />
f. Pick another spot near the magnet and repeat the process.<br />
Bar magnet with mapped magnetic fields<br />
Have them continue until they have the lines surrounding the magnet as shown in the picture: a di-pole (two-pole)<br />
pattern of force field showing magnetic field lines.<br />
Hints: We recommend using AlNiCo (i.e., aluminum, nickel and cobalt) or cow magnets rather than Chrome-Steel<br />
as they hold their magnetism longer. Also, remember that compasses can easily change polarity when a bar magnet is<br />
dragged across the compass needle without allowing the needle to move.<br />
Assessment Questions: What do you notice about the interaction of the bar magnets What do all the mateirals that<br />
repond to the magnet have in common What happens when you bring a compass near a magnet (The Complete<br />
Teachers’ Guide is available for download at: http://cse.ssl.berkeley.edu/exploringmagnetism)<br />
Additional Resources<br />
Sun-Earth Day event and solar resources:<br />
Daily space weather news and aurora predictions:<br />
Simple matching Suns activity (middle school):<br />
Daily images/movies of the Sun:<br />
Solar 3D images/movies (need 3D glasses):<br />
NASA produced educational multimedia materials:<br />
Solar Dynamics Observatory mission:<br />
Space weather center educational activities:<br />
<strong>Interactive</strong> space weather <strong>poster</strong> (in PDF):<br />
Information about solar cycles:<br />
http://sunearthday.nasa.gov<br />
http://spaceweather.com<br />
http://soho.nascom.nasa.gov/classroom/matching_activity.html<br />
http://soho.nascom.nasa.gov<br />
http://stereo.gsfc.nasa.gov/gallery/3dimages.shtml<br />
http://core.nasa.gov<br />
http://sdo.gsfc.nasa.gov<br />
http://www.spaceweathercenter.org/<br />
http://soho.nascom.nasa.gov/spaceweather/lenticular/SWpost_movies.pdf<br />
http://solarscience.msfc.nasa.gov/SunspotCycle.shtml<br />
EW-2008-1-028-GSFC<br />
To engage with an interactive version of this <strong>poster</strong> with movies and additional resources, go to: http://soho.nascom.nasa.gov/classroom/for_students.html