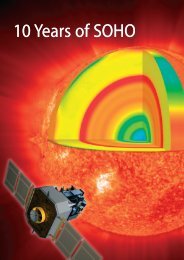
Four years of SOHO Discoveries-Some Highlights - Nasa
Four years of SOHO Discoveries-Some Highlights - Nasa
Four years of SOHO Discoveries-Some Highlights - Nasa
- No tags were found...

You also want an ePaper? Increase the reach of your titles
YUMPU automatically turns print PDFs into web optimized ePapers that Google loves.
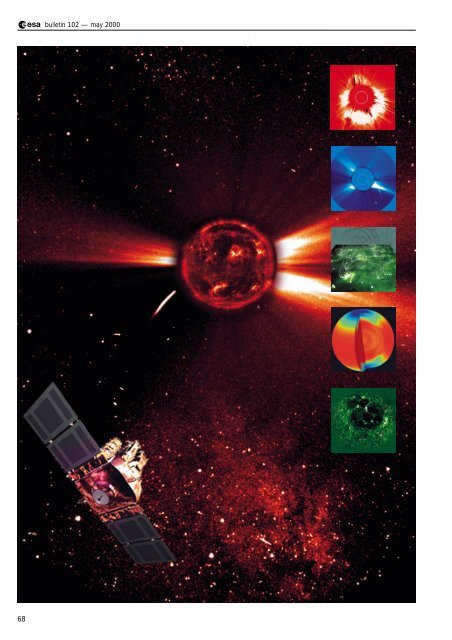
ulletin 102 — may 2000 bull68
ulletin 102 — may 2000 bullTable 1. The <strong>SOHO</strong> scientific instrumentsInvestigationPrincipal InvestigatorGOLF Global Oscillations at Low Frequencies A. Gabriel, IAS, Orsay, FranceVIRGO Variability <strong>of</strong> Solar Irradiance and Gravity Oscillations C. Fröhlich, PMOD Davos, SwitzerlandMDI Michelson Doppler Imager P. Scherrer, Stanford University, USASUMER Solar Ultraviolet Measurements <strong>of</strong> Emitted Radiation K. Wilhelm, MPAe Lindau, GermanyCDS Coronal Diagnostic Spectrometer R. Harrison, RAL, Chilton, UKEIT Extreme-Ultraviolet Imaging Telescope J.-P. Delaboudinière, IAS, Orsay, FranceUVCS Ultra-Violet Coronagraph Spectrometer J. Kohl, SAO, Cambridge, USALASCO Large-Angle Spectroscopic Coronagraph R. Howard, NRL, Washington, USASWAN Solar Wind Anisotropies J.-L. Bertaux, SA, Verrières, FranceCELIAS Charge, Element and Isotope Analysis System P. Bochsler, Univ. <strong>of</strong> Bern, SwitzerlandCOSTEP Comprehensive Supra-Thermal and Energetic-Particle Analyser H. Kunow, Univ. <strong>of</strong> Kiel, GermanyERNE Energetic and Relativistic Nuclei and Electron Experiment J. Torsti, Univ. <strong>of</strong> Turku, FinlandIAS : Institut d’Astrophysique Spatiale SAO : Smithsonian Astrophysical ObservatoryPMOD : Physikalisch-Meteorologisches Observatorium Davos NRL : Naval Research LaboratoryRAL : Rutherford Appleton Laboratory SA : Service d’AeronomieMPAe: Max-Planck-Institut für Aeronomiecan infer the temperature, density, elementaland isotopic abundances, interior mixing,interior rotation and flows, even the age <strong>of</strong> theSolar System, and pursue such esotericmatters as testing the constancy <strong>of</strong> thegravitational constant.Interior rotation and flowsThe nearly uninterrupted data from <strong>SOHO</strong>’sMichelson Doppler Imager (MDI) yield oscillationpower spectra with an unprecedented signalto-noiseratio that allow the determination <strong>of</strong>the frequency splittings <strong>of</strong> the global resonantacoustic modes <strong>of</strong> the Sun with exceptionalaccuracy. These data confirm that the decreasein angular velocity Ω with latitude seen at thesurface extends with little radial variationthrough much <strong>of</strong> the convection zone, at thebase <strong>of</strong> which is an adjustment layer, called the‘tachocline’, leading to nearly uniform rotationdeeper in the radiative interior (Fig. 1).Furthermore, a prominent rotational shearinglayer in which Ω increases just below the surfaceis discernible at low- to mid-latitudes.The MDI team has also been able to study thesolar rotation closer to the poles than has beenachieved in previous investigations. The datahave revealed that the angular velocity isdistinctly lower at high latitudes than previouslyextrapolated from measurements at lowerlatitudes based on surface Doppler observationsand helioseismology. Moreover, they foundevidence <strong>of</strong> a submerged polar jet nearlatitudes <strong>of</strong> 75°, which is rotating more rapidlythan its immediate surroundings (red oval nearthe poles in Fig. 2).Alternating zonal bands <strong>of</strong> faster and slowerrotation (± 7 m/s) at a depth <strong>of</strong> 2 – 9 Mmappear to coincide with an evolving pattern <strong>of</strong>‘torsional oscillations’ reported from earliersurface Doppler studies (Fig. 2). Clear evidence<strong>of</strong> the migration <strong>of</strong> these zonal flows towardsthe equator has been found, and a recentstudy has established that these banded flowsare not merely a near-surface phenomenon.Rather, they extend downward at least 60 Mm(some 8% <strong>of</strong> the total solar radius) and thusare evident over a significant fraction <strong>of</strong> thenearly 200 Mm depth <strong>of</strong> the solar convectionzone (Fig. 3).Long-lived velocity cells extending over 40–50°<strong>of</strong> longitude, but less than 10° <strong>of</strong> latitude, havebeen identified with the elusive ‘giant cells’ byBeck et al.. Their suprisingly large aspect ratiomay be a consequence <strong>of</strong> the Sun’s differentialrotation, whereby larger features are broken upby rotational shear.High-precision MDI measurements <strong>of</strong> the Sun’sshape obtained during two special 360° rollmanoeuvres <strong>of</strong> the <strong>SOHO</strong> spacecraft have70
ulletin 102 — may 2000 bullFigure 6. A vertical cutthrough the upperconvection zone showingsubsurface flows andsound speedinhomogeneities (fromKosovichev et al.)Figure 7. The geometry<strong>of</strong> the time-distanceanalysis <strong>of</strong> subsurfacemeridional flows (fromGiles et al.)persist to great depths (Fig. 7), and thereforemay play an important role in the 11-year solarcycle. They found the meridional flow to persistto a depth <strong>of</strong> at least 26 Mm, with a depthaveragedvelocity <strong>of</strong> 23.5 ± 0.6 m/s at midlatitude.More recently, they extended thesemeasurements to a depth <strong>of</strong> 0.8 R withoutfinding any evidence <strong>of</strong> a return flow. Continuityconsiderations led them to estimate the returnflow below 0.8 R at approximately 5 m/s,which might actually be detectable in thefuture, providing a useful constraint for dynamotheories.One <strong>of</strong> the most exciting applications <strong>of</strong> solartomography is in studying the birth andevolution <strong>of</strong> active regions and complexes <strong>of</strong>solar activity. Kosovichev et al. have studiedthe emergence <strong>of</strong> an active region on the Sun’sdisc with this technique and their resultssuggest that the emerging flux ropes travel veryquickly through the upper 18 Mm <strong>of</strong> theconvection zone. They estimate the speed <strong>of</strong>emergence at about 1.3 km/s, which issomewhat higher than predicted by earliertheories. Wave speeds vary in the emergingactive region by about 0.5 km/s. The observeddevelopment <strong>of</strong> the active region suggests thatthe sunspots are formed as a result <strong>of</strong> theconcentration <strong>of</strong> magnetic flux close to thesurface. The Stanford team also presentedtime-distance results on the subsurfacestructure <strong>of</strong> a large sunspot observed on20 June 1998 (Fig. 8). The wave-speedperturbations in the spot are much stronger thanin the emerging flux (0.3–1 km/s). At a depth <strong>of</strong>4 Mm, a 1 km/s wave-speed perturbationcorresponds to a 10% temperature variation(approx. 2800 K) or to a 18 kG magnetic field.Beneath the spot, the perturbation is negativein the subsurface layers and becomes positivefurther down in the interior. Their tomographicimages also revealed sunspot ‘fingers’ – long,narrow structures at a depth <strong>of</strong> about 4 Mm –depth (Mm)horizontal distance (Mm)74
soho discoverieswhich connect the sunspot with surroundingpores <strong>of</strong> the same polarity. Pores with theopposite polarity are not connected to the spot.MDI has also made the first observations <strong>of</strong>seismic waves from a solar flare, opening uppossibilities for studying both the flares and thesolar interior. During the impulsive phase <strong>of</strong> theX2.6-class flare <strong>of</strong> 9 July 1996, a high-energyelectron beam caused an explosive evaporation<strong>of</strong> chromospheric plasma at supersonicvelocities. The upward motion was balanced bya downward recoil in the lower chromosphere,which excited propagating waves in the solarinterior. On the surface, the outgoing circularflare waves resembled ripples from a pebblethrown into a pond (Fig. 9). The seismic wavepropagated at least 120 000 km from the flare’sepicentre, with an average speed <strong>of</strong> about50 km/s on the solar surface.Transition-region dynamicsExplosive events and ‘blinkers’Several types <strong>of</strong> transient events have beendetected in the quiet Sun. High-velocity eventsin the solar transition region, also called‘explosive events’, were first discovered in theearly eighties based on ultraviolet observationswith the High-Resolution Telescope-Spectrometer(HRTS) rocket payload. They have largevelocity dispersions, approximately ±100 km/s,i.e. velocities are directed both towards andaway from the observer causing a strongbroadening <strong>of</strong> the spectral lines observed.Explosive events have been studied extensivelyby a number <strong>of</strong> authors using SUMER data,and several results support the magneticreconnection origin <strong>of</strong> these features. Innes etal. have reported explosive events that showspatially separated blue- and red-shifted jetsand some that show transverse motion <strong>of</strong> blueand red shifts, as predicted if reconnectionwas the source (Fig. 10). Comparisons withmagnetograms from MDI and those obtainedat ground-based solar observatories have alsoprovided evidence that transition-region explosiveevents are a manifestation <strong>of</strong> magneticreconnection occurring in the quiet Sun.Harrison et al. have presented a comprehensivestudy <strong>of</strong> EUV flashes, also known as ‘blinkers’,Figure 8. The subsurface sound speedperturbations in a sunspot region observed on20 June 1998 by MDI. The horizontal size <strong>of</strong>the box is 13 deg (158 Mm), the depth is24 Mm. The horizontal cut in panels (a) and (b)reaches down to a depth <strong>of</strong> 21.6 Mm, while inpanel (c) it is 4.8 Mm deep. Positive variationsare shown in red, negative variations in blue.Scaling: ±1 km/s (from Kosovichev et al.)75
ulletin 102 — may 2000 bullFigure 9. Seismic waves(‘sun quake’) produced bya solar flare on 9 July1996 (from Kosovichev &Zharkova)y, Mmy, Mmx, Mm x, MmFigure 10. Bi-directionalplasma jets observed bySUMER in Si IV 1393 Å inJune 1996 and aschematic <strong>of</strong> the plasmaflow (from Innes et al.)which were identified in the quiet Sun network asintensity enhancements <strong>of</strong> order 10–40% usingCDS (Fig. 11). They have analysed 97 blinkerevents and identified blinker spectral, temporaland spatial characteristics, their distribution,frequency and general properties, across abroad range <strong>of</strong> temperatures, from 20 000 to1 200 000 K. The blinkers are most pronouncedin the transition region lines O III, O IV and O V,with modest or no detectable signature athigher and lower temperatures. A typical blinkerlasts about 1000 s, but due to a long tail <strong>of</strong>longer duration events the average duration is2400 s. Comparisons with plasma coolingtimes led to the conclusion that there must becontinuous energy input throughout the blinkerevent. There are about 3000 blinker events inprogress at any given time. Remarkably, lineratios from O III, O IV and O V show nosignificant change throughout the blinker event,suggesting that the intensity increase is not atemperature effect, but is predominantlycaused by increases in density or filling factor.The thermal-energy content <strong>of</strong> an averageblinker is estimated as 2 x 10 25 erg.While the explosive events appear as extremelybroad line pr<strong>of</strong>iles with Doppler shifts <strong>of</strong>76
ulletin 102 — may 2000 bullMore recent investigations using SUMERobservations have revisited this problem,addressing possible errors in the restwavelengths <strong>of</strong> lines from highly ionised atoms(e.g. Ne VIII, Na IX, Mg X, Fe XII). Using full-discscans from SUMER and assuming that all massor wave-motion effects on the limb cancel outstatistically, new rest wavelengths for Ne VIIIand Mg X have been established, leading toblueshifts <strong>of</strong> 2.5 km/s and 4.5 km/s, respectively,at disc centre.These recent results suggest that the uppertransition region and lower corona appearblue-shifted in the quiet Sun, with a steeptransition from red- to blue-shifts above 5 x 10 5 K.This transition is significant because it hasmajor implications for the transition region andsolar-wind modelling, as well as for ourunderstanding <strong>of</strong> the structure <strong>of</strong> the solaratmosphere.The networkEarly models <strong>of</strong> the solar atmosphere assumedthat the temperature structure <strong>of</strong> the upperatmosphere was continuous, with a thintransition region connecting the chromospherewith the corona. This depiction now appearstoo simplistic. Rather, it seems that the solaratmosphere consists <strong>of</strong> a hierarchy <strong>of</strong>isothermal, highly dynamic loop structures.Of particular interest in this context is thenetwork, which is believed to be the backbone<strong>of</strong> the entire solar atmosphere and the basicchannel <strong>of</strong> the energy responsible for heatingthe corona and accelerating the solar wind.Patsourakos et al. have used CDS data tostudy the width variation <strong>of</strong> the network withtemperature. They found that the networkboundaries have an almost constant width upto about 250 000 K (where the network contrastis also strongest) and then fan out rapidly atcoronal temperatures. The network in thelower transition region is about 10 arcsecacross and spreads to about 16 arcsec at1 MK. These results are in very good agreementwith Gabriel’s transition region-corona model,dating from1976.Active-region dynamicsEIT, SUMER and CDS observations haveclearly demonstrated that the solar transitionregion and corona are extremely dynamic andtime variable in nature. Large line shifts <strong>of</strong> up to60 km/s were observed with CDS in individualactive region loops (Fig. 13). High Dopplershifts are common in active-region loops andstrong shifts are present in parts <strong>of</strong> loops fortemperatures up to 0.5 MK. Regions with bothred and blue shifts are seen. While typicalvalues correspond to velocities <strong>of</strong> ± 50-100 km/s,shifts approaching 200 km/s have beendetected. At temperatures T > 1 MK, i.e. inMg IX 368 Å or Fe XVI 360 Å, only small shiftsare seen. The high Doppler shifts thereforeseem to be restricted to the transition region.Brynildsen et al. studied 3-min transition-regionoscillations above sunspots by analysing timeseries recorded in O V 629 Å, N V 1238 Å and1242 Å, and the chromospheric Si II 1260 Åline in NOAA 8378. The 3-min oscillations thatFigure 13. CoronalDiagnostic Spectrometer(CDS) raster imagesshowing the intensity andvelocity distribution <strong>of</strong>transition-region plasmain AR8737 on the southwestlimb in October1999. Six emission lineswere observedsimultaneously, <strong>of</strong> whichone is shown here(O V 629 Å, formed atabout 230 000 K). Dopplershifts corresponding to avelocity greater than± 40 km/s (144 000 km/h)are fully red/blue.Contours outline areaswith velocities exceeding± 50 km/s (180 000 km/h)(courtesy <strong>of</strong> T. Fredvik &O. Kjeldseth-Moe)78
soho discoveriesFigure 16. Magneticcarpet. Model <strong>of</strong> magneticfield lines based on MDImagnetograms,superimposed on animage <strong>of</strong> the solar coronain Fe XII 195 Å from EIT(courtesy <strong>of</strong> <strong>SOHO</strong>/MDIConsortium)distribution <strong>of</strong> apparent locations <strong>of</strong> CMEsvaried during this period as expected. While thepointing stability provided by the <strong>SOHO</strong>platform in its L-1 orbit and the use <strong>of</strong> CCDdetectors have resulted in superior brightnesssensitivity for LASCO over earlier coronagraphs,they have not detected a significant population<strong>of</strong> fainter (i.e. low-mass) CMEs. The generalshape <strong>of</strong> the distribution <strong>of</strong> apparent sizes forLASCO CMEs is similar to those <strong>of</strong> earlierreports, but the average (median) apparent size<strong>of</strong> 72° (vs. 50°) is significantly larger.St.Cyr et al. have also reported on a population<strong>of</strong> CMEs with large apparent sizes, whichappear to have a significant longitudinalcomponent directed along the Sun–Earth line,either toward or away from the Earth. These arethe so-called ‘halo CMEs’ (Fig. 18). Using fulldiscEIT images, they found that 40 out <strong>of</strong> 92 <strong>of</strong>these events might have been directed towardsthe Earth. A comparison <strong>of</strong> the timing <strong>of</strong> thoseevents with the Kp geomagnetic storm index inthe days following the CME showed that 15out <strong>of</strong> 21 (71%) <strong>of</strong> the Kp > 6 storms could beaccounted for as <strong>SOHO</strong> LASCO/EIT front-sidehalo CMEs. Three more Kp storms may haveFigure 17. Progress <strong>of</strong> aCoronal Mass Ejection(CME) observed over an8 h period on 5-6 August1999 by LASCO C3. Thedark disc blocks the Sunso that the LASCOinstrument can observethe structures <strong>of</strong> thecorona in visible light.The white circlerepresents the size andposition <strong>of</strong> the Sun(courtesy <strong>of</strong> <strong>SOHO</strong>/LASCOConsortium)81
ulletin 102 — may 2000 bullFigure 18. Massive ‘halo’CME as recorded byLASCO C2 on 17 February2000. Displayed here is aso-called ‘runningdifference’ image,showing the variation inbrightness from oneframe to the next(courtesy <strong>of</strong> <strong>SOHO</strong>/LASCOConsortium)Figure 19. Sequence <strong>of</strong>EIT difference imagesshowing the intensity(density) enhancementand following rarefactionassociated with a shockwave expanding acrossthe solar disc from thesite <strong>of</strong> the origin <strong>of</strong> aCME, recorded on 12 May1997. A halo CME wasobserved by LASCO.These images wereformed from thedifferences <strong>of</strong> successiveimages in the emissionlines <strong>of</strong> Fe XII near 195 Å;this ion is formed attemperatures <strong>of</strong> about 1.5million degrees. The wavefront travels at speeds <strong>of</strong>~ 300 km/s, typical <strong>of</strong> afast mode Alfvén shock inthe lower solar corona(from Thompson et al.)been missed during LASCO/EIT datagaps, bringing the possible associationrate to 18 out <strong>of</strong> 21 (86%).EIT has discovered large-scale transientwaves in the corona, also called‘Coronal Moreton Waves’ or ‘EITwaves’, propagating outward fromactive regions below CMEs. Theseevents are usually recorded in theFe XII 195 Å bandpass, during highcadence(< 20 min) observations. Theirappearance is stunning in that theyusually affect most <strong>of</strong> the visible solardisc (Fig. 19). They generally propagateat speeds <strong>of</strong> 200–500 km/s, traversinga solar diameter in less than an hour.Active regions distort the waves locally,bending them towards the lower Alfvénspeed regions. On the basis <strong>of</strong> speedand propagation characteristics, the EIT waveswere associated with fast-mode shock waves.Another interesting aspect <strong>of</strong> these coronalMoreton waves is their association with theacceleration and injection <strong>of</strong> high-energyelectrons and protons, as measured, forexample, by COSTEP and ERNE.Solar windOrigin and speed pr<strong>of</strong>ile <strong>of</strong> the fast windCoronal-hole outflow velocity maps obtainedwith the SUMER instrument in the Ne VIIIemission line at 770 Å show a clear relationshipbetween coronal-hole outflow velocity and thechromospheric network structure (Fig. 20), withthe largest outflow velocities occurring alongnetwork boundaries and at the intersection <strong>of</strong>network boundaries. This can be consideredthe first direct spectroscopic determination <strong>of</strong>the source regions <strong>of</strong> the fast solar wind incoronal holes.Proton and O VI outflow velocities in coronalholes have been measured by UVCS using theDoppler dimming method. The O VI outflowvelocity was found to be significantly higherthan the proton velocity, with a very steepincrease between 1.5 and 2.5 R , reachingoutflow velocities <strong>of</strong> 300 km/s at around 2 R (Fig. 21). While the hydrogen outflow velocitiesare still consistent with some conventionaltheoretical models for polar wind acceleration,the higher oxygen flow speeds cannot beexplained by these models. A possibleexplanation is <strong>of</strong>fered by the dissipation <strong>of</strong> highfrequencyAlfvén waves via gyroresonance withion-cyclotron Larmor motions, which can heatand accelerate ions differently depending ontheir charge and mass.Speed pr<strong>of</strong>ile <strong>of</strong> the slow solar windTime-lapse sequences <strong>of</strong> LASCO white-lightcoronagraph images give the impression <strong>of</strong> acontinuous outflow <strong>of</strong> material in the streamerbelt. Density enhancements, or ‘blobs’, formnear the cusps <strong>of</strong> helmet streamers and appearto be carried outward by the ambient solarwind. Sheeley et al., using data from theLASCO C2 and C3 coronagraphs, have traceda large number <strong>of</strong> such ‘blobs’ from 2 to over25 solar radii. Assuming that these ‘blobs’ arecarried away by the solar wind like leaves on82
soho discoveriesthe river, they have measured the accelerationpr<strong>of</strong>ile <strong>of</strong> the slow solar wind, which typicallydoubles its speed from 150 km/s near 5 R to300 km/s near 25 R . They found a constantacceleration <strong>of</strong> about 4 ms -2 through most <strong>of</strong>the 30 R field-<strong>of</strong>-view. The speed pr<strong>of</strong>ile isconsistent with an iso-thermal solar-windexpansion at a temperature <strong>of</strong> about 1.1 MKand a sonic point near 5 R .Solar-wind compositionUsing data from the CELIAS/MTOF sensor, theCELIAS team has made the first in-situdetermination <strong>of</strong> the isotopic composition <strong>of</strong>calcium and nitrogen in the solar wind. Thesemeasurements are important for studies <strong>of</strong>stellar modelling and Solar System formation,because the present-day solar Ca isotopicabundances are unchanged from their originalisotopic composition in the solar nebula. Theisotopic ratios 40Ca/ 42 Ca and 40Ca/ 44 Cameasured in the solar wind were found to beconsistent with terrestrial values. The isotoperatio 14 N/ 15 N was found to be 200 ± 60,indicating a depletion <strong>of</strong> 15 N in the terrestrialatmosphere compared to solar matter.Ion freeze-in temperatures were measured byCELIAS/CTOF with a time resolution <strong>of</strong> 5 min.These measurements indicate that some <strong>of</strong> thefilamentary structures <strong>of</strong> the inner coronaobserved in H α survive in the inter-planetarymedium as far as 1 AU.Figure 20. Source regions <strong>of</strong> the fast solar wind. Background: EIT full-Sun imagetaken in the emission line <strong>of</strong> Fe XII 195 Å, revealing gas at 1.5 million degreesshaped by magnetic fields. Bright regions indicate hot, dense plasma loopswith strong magnetic fields, while dark regions imply an open magnetic fieldgeometry, and are the source <strong>of</strong> the high-speed solar wind. The ‘zoomed-in’or ‘close-up’ region shows a Doppler velocity map <strong>of</strong> plasma at about630 000 K at the base <strong>of</strong> the corona, as recorded by SUMER in the Ne VIIIemission line at 770 Å. Blue represents blue shifts or outflows and redrepresents red shifts or downflows. The blue regions are inside a coronal hole,or open magnetic field region, where the high-speed solar wind is accelerated.Superposed are the edges <strong>of</strong> ‘honeycomb-shaped’ patterns <strong>of</strong> magnetic fieldsat the surface <strong>of</strong> the Sun (from Hassler et al.)The unprecedented time resolution <strong>of</strong> theCELIAS/CTOF data has allowed a fine-scaledstudy <strong>of</strong> the elemental Fe/O ratio as a function<strong>of</strong> the solar-wind bulk speed. Since Fe is a lowFirst Ionisation Potential (FIP) element and O ahigh-FIP element, their relative abundance isdiagnostic for the so-called ‘FIP fractionationprocess’. The Fe/O abundance shows acontinuos decrease with increasing solar-windspeed by a factor <strong>of</strong> two between 350 km/sand 500 km/s, in correspondence with thewell-established FIP effect.Comets<strong>SOHO</strong> is not only providing new measurementsabout the Sun. On 4 February 2000, <strong>SOHO</strong>discovered its 100th comet, 93 <strong>of</strong> which belongto the Sun-grazing Kreutz family (Fig. 22). Aparticular feature is the presence <strong>of</strong> a dust tailfor only a few Sun grazers. Analysis <strong>of</strong> the lightcurves is used to investigate the properties <strong>of</strong>the nuclei (size, fragmentation, destruction) andthe dust production rates.Thanks to rapid communication from theLASCO group and the near-real-time observingcapabilities <strong>of</strong> the <strong>SOHO</strong> instruments, UVCScould make spectroscopy measurements <strong>of</strong>Figure 21. Empirical outflow velocity <strong>of</strong> O VI and H I in coronal holes over thepoles (from Kohl et al.)83
ulletin 102 — may 2000 bullseveral comets on the day <strong>of</strong> their discovery.UVCS measurements <strong>of</strong> comet C/1996Y1obtained at 6.8 R confirmed the predictions <strong>of</strong>models <strong>of</strong> the cometary bow shock driven bymass-loading as cometary molecules areionised and swept up in the solar wind. Fromthe width and shift <strong>of</strong> the line pr<strong>of</strong>iles, the solarwindspeed at 6.8 R could be determined (640km/s). The outgassing rate <strong>of</strong> the comet wasestimated at 20 kg/s, implying an activenucleus area <strong>of</strong> only about 6.7 m in diameterand a mass <strong>of</strong> about 120 000 kg.Figure 22. LASCO sees two comets plunge into the Sun. In a rare celestialspectacle, two comets were observed by the LASCO coronagraph plunginginto the Sun’s atmosphere in close succession, on 1 and 2 June 1998.Science instruments on <strong>SOHO</strong> have discovered more than 100 comets,including many so-called ‘Sun grazers’, but none in such close succession(courtesy <strong>of</strong> <strong>SOHO</strong>/LASCO Consortium)Figure 23. SWAN H I Ly-α image <strong>of</strong> the huge cloud <strong>of</strong> hydrogen surroundingcomet Hale-Bopp when it neared the Sun in the spring <strong>of</strong> 1997. The smallyellow dot shows the Sun to scale (from Combi et al.)Comets are surrounded by large clouds <strong>of</strong>hydrogen, produced by the break-up <strong>of</strong> watermolecules evaporating from the comets’ ice.The solar-wind mapper SWAN sees these largeclouds <strong>of</strong> hydrogen glowing in the light <strong>of</strong> theH I Lyman-α line. The huge cloud <strong>of</strong> hydrogensurrounding Comet Hale-Bopp (Fig. 23) duringits perihelion passage in the spring <strong>of</strong> 1997 wasmore than 100 million kilometres wide,diminishing in intensity outwards (contour lines).It far exceeded the great comet’s visible tail(inset photograph). Although generated by acomet nucleus perhaps only 40 km in diameter,the hydrogen cloud was 70 times wider thanthe Sun itself (yellow dot to scale) and ten timeswider than the hydrogen cloud <strong>of</strong> CometHyakutake observed by SWAN in 1996. Thewater evaporation rate <strong>of</strong> Hale-Bopp wasmeasured by SWAN at more than 200 milliontons per day. Comet Wirtanen, the target forESA’s Rosetta mission (2003), pumped outwater vapour at a rate <strong>of</strong> 20 000 tons a dayduring its most recent periodic visit to the Sun,according to the SWAN data. SWAN has alsoseen something else extraordinary – thebiggest shadow ever observed in our SolarSystem, namely that <strong>of</strong> a comet projected onthe sky behind it (Fig. 24).HeliosphereThe Sun is moving through the Local InterstellarCloud (LIC) at about 26 km/s. The solar windbuilds a cavity, the heliosphere, within theionised gas component <strong>of</strong> the LIC. The neutralatoms (e.g. He) <strong>of</strong> the LIC, on the other hand,enter the heliosphere unaffected. The He flowproperties are now well-constrained from aseries <strong>of</strong> measurements (v He= 25.5 ± 0.5 km/s,T He= 6000 ± 1000 K). These values are inagreement with the LIC velocity andtemperature deduced from stellar spectroscopy.Hydrogen, on the other hand, isexpected to be affected by coupling with thedecelerated plasma via charge-exchange.Neutral hydrogen heating and decelerationtherefore provides a measurement <strong>of</strong> thiscoupling and, in turn, <strong>of</strong> the plasma density inthe LIC, which is responsible for most <strong>of</strong> theheliosphere’s confinement.84
soho discoveriesThe SWAN team, analysing data fromabsorption cells, found hydrogen temperaturesT 0<strong>of</strong> 11 500 ± 1500 K, i.e. significantly abovethe temperature <strong>of</strong> the interstellar He flow (6000± 1000 K), requiring strong heating <strong>of</strong> morethan 3500 K at the heliosphere interface. Part<strong>of</strong> this excess temperature is probably due toradiative-transfer effects.The apparent interstellar hydrogen velocity inthe up- and downwind direction was measuredto be -25.4 ±1 km/s and +21.6 ±1.3 km/s,respectively, with the most precise determination(since model-independent) <strong>of</strong> the H flowdirection. The new estimate <strong>of</strong> the upwinddirection from SWAN measurements is252.3 ± 0.73 deg and 8.7 ± 0.90 deg in eclipticcoordinates, which is <strong>of</strong>f by about 3–4 deg fromthe He flow direction. The SWAN teamspeculates that this might be a sign <strong>of</strong> anasymmetry in the heliospheric interface due tothe ambient interstellar magnetic field.Comparing the above hydrogen temperatureand velocity measurements by SWAN withheliospheric models leads to an estimate <strong>of</strong> theinterstellar plasma density <strong>of</strong> n e ≈ 0.04 cm -3 . Itis interesting to note that the plasma frequencyfor n e ≈ 0.04 cm -3 is 1.8 kHz, i.e. exactly thevalue <strong>of</strong> the remarkably stable cut-<strong>of</strong>f frequencyobserved by Voyager.Of particular interest for future studies might bethe temperature minimum measured betweenthe upwind and downwind directions. Classicalmodels predict a monotonic increase in theline-<strong>of</strong>-sight temperature from upwind todownwind. The authors interpret this behaviouras first evidence <strong>of</strong> the existence <strong>of</strong> two distinctpopulations at different velocities, as predictedby some heliosphere/interstellar-gas interfacemodels. If confirmed, this should provide agood diagnostic <strong>of</strong> the interface.Total solar irradiance variationsThe VIRGO instrument on <strong>SOHO</strong> extends therecord <strong>of</strong> Total Solar Irradiance (TSI)measurements into cycle 23. In Figure 25,measurements from six independent spacebasedradiometers since 1978 (top) have beencombined to produce the composite TSI overtwo decades (bottom). They show that theSun’s output fluctuates during each 11-<strong>years</strong>unspot cycle, changing by about 0.1%between maxima (1980 and 1990) and minima(1987 and 1997) in solar activity. Temporarydips <strong>of</strong> up to 0.3% and a few days duration arethe result <strong>of</strong> large sunspots passing over theFigure 24. SWANobservations <strong>of</strong> cometHale-Bopp’s shadow(courtesy <strong>of</strong> <strong>SOHO</strong>/SWANConsortium)85
ulletin 102 — may 2000 bullFigure 25. Total solarirradiance variations from1978 to 1999. The dataare from the Hickey-Frieden (HF) radiometer <strong>of</strong>the Earth RadiationBudget (ERB) experimenton Nimbus-7 (1978-1992),the two Active CavityRadiometer IrradianceMonitors (ACRIM I and II)aboard the SolarMaximum Mission (1980-1989) and the UpperAtmosphere ResearchSatellite (1991-),respectively, and theVIRGO radiometers on<strong>SOHO</strong> (1996-). Also shownare the data from theradiometer on the ERB(1984-), and SOVA2 aspart <strong>of</strong> the SolarVariability Experiment onthe European RetrievableCarrier (1992-1993) (fromQuinn and Fröhlich)visible hemisphere. The larger number <strong>of</strong>sunspots near the peak in the 11-year cycle isaccompanied by a general rise in magneticactivity that creates an increase in the luminousoutput which exceeds the cooling effects <strong>of</strong>sunspots. Offsets between the various datasets are the direct result <strong>of</strong> uncertainties in theabsolute radiometer scale <strong>of</strong> the radiometers(±0.3%). Despite these biases, each data setclearly shows varying radiation levels that trackthe overall 11-year solar activity cycle.Conclusions<strong>SOHO</strong> set out to tackle three broad topics insolar and heliospheric physics: the structureand dynamics <strong>of</strong> the solar interior, the heatingand dynamics <strong>of</strong> the solar corona, and theacceleration and composition <strong>of</strong> the solar wind.In all three areas, its observations have allowedgreat strides to be made in our understanding<strong>of</strong> the diverse physical processes at work inour Sun. This has been made possible bythe comprehensive suite <strong>of</strong> state-<strong>of</strong>-the-artinstruments mounted on the superb and stable<strong>SOHO</strong> spacecraft, operating from the uniquevantage point <strong>of</strong> the L1 halo orbit.In such complex areas <strong>of</strong> research as solarphysics, progress is not made by just a fewpeople acting in a vacuum. The scientificachievements <strong>of</strong> the <strong>SOHO</strong> mission are theresults <strong>of</strong> a concerted, multi-disciplinary effortby a large international community <strong>of</strong> solarscientists, involving sound investments inspace hardware, coupled with a vigorous andwell-coordinated scientific operation andinterpretation effort. The interplay betweentheory and observations has already providedmany new insights and will continue to do s<strong>of</strong>or many <strong>years</strong>.With the wealth <strong>of</strong> <strong>SOHO</strong> data already in thearchive (and many more data yet to come,hopefully well beyond the next solar maximum),we should be able to unravel even more <strong>of</strong> themysteries <strong>of</strong> our closest star.AcknowledgementsThe great success <strong>of</strong> the <strong>SOHO</strong> mission is atribute to the many people who designed andbuilt this exquisite spacecraft and theseexcellent instruments, and to the many peoplewho diligently work behind the scenes to keepit up and running. Special thanks go to: HaroldW. Benefield and his AlliedSignal FlightOperations Team; Helmut Schweitzer andJean-Philippe Olive from the ESA/MMS TechnicalSupport Team; the Science Operations CoordinatorsLaura Roberts, Joan Hollis and PietMartens; Craig Roberts, John Rowe and theircolleagues from Flight Dynamics, the colleaguesfrom DSN, and, last but not least, to FrancisVandenbussche and his recovery team formaking a miracle come true! r86